
Main menu

  • Home
  • Content
    • Current
    • Ahead of print
    • Past Issues
    • JNM Supplement
    • SNMMI Annual Meeting Abstracts
    • Continuing Education
    • JNM Podcasts
  • Subscriptions
    • Subscribers
    • Institutional and Non-member
    • Rates
    • Journal Claims
    • Corporate & Special Sales
  • Authors
    • Submit to JNM
    • Information for Authors
    • Assignment of Copyright
    • AQARA requirements
  • Info
    • Reviewers
    • Permissions
    • Advertisers
  • About
    • About Us
    • Editorial Board
    • Contact Information
  • More
    • Alerts
    • Feedback
    • Help
    • SNMMI Journals
  • SNMMI
    • JNM
    • JNMT
    • SNMMI Journals
    • SNMMI

User menu

  • Subscribe
  • My alerts
  • Log in
  • Log out
  • My Cart

Search

  • Advanced search
Journal of Nuclear Medicine
  • SNMMI
    • JNM
    • JNMT
    • SNMMI Journals
    • SNMMI
  • Subscribe
  • My alerts
  • Log in
  • Log out
  • My Cart
Journal of Nuclear Medicine

Advanced Search

  • Home
  • Content
    • Current
    • Ahead of print
    • Past Issues
    • JNM Supplement
    • SNMMI Annual Meeting Abstracts
    • Continuing Education
    • JNM Podcasts
  • Subscriptions
    • Subscribers
    • Institutional and Non-member
    • Rates
    • Journal Claims
    • Corporate & Special Sales
  • Authors
    • Submit to JNM
    • Information for Authors
    • Assignment of Copyright
    • AQARA requirements
  • Info
    • Reviewers
    • Permissions
    • Advertisers
  • About
    • About Us
    • Editorial Board
    • Contact Information
  • More
    • Alerts
    • Feedback
    • Help
    • SNMMI Journals
  • View or Listen to JNM Podcast
  • Visit JNM on Facebook
  • Join JNM on LinkedIn
  • Follow JNM on Twitter
  • Subscribe to our RSS feeds
Research ArticleClinical Investigations

18F-FDG Uptake Rate Is a Biomarker of Eosinophilic Inflammation and Airway Response in Asthma

R. Scott Harris, José G. Venegas, Chanikarn Wongviriyawong, Tilo Winkler, Mamary Kone, Guido Musch, Marcos F. Vidal Melo, Nicolas de Prost, Daniel L. Hamilos, Roshi Afshar, Josalyn Cho, Andrew D. Luster and Benjamin D. Medoff
Journal of Nuclear Medicine November 2011, 52 (11) 1713-1720; DOI: https://doi.org/10.2967/jnumed.110.086355
R. Scott Harris
  • Find this author on Google Scholar
  • Find this author on PubMed
  • Search for this author on this site
José G. Venegas
  • Find this author on Google Scholar
  • Find this author on PubMed
  • Search for this author on this site
Chanikarn Wongviriyawong
  • Find this author on Google Scholar
  • Find this author on PubMed
  • Search for this author on this site
Tilo Winkler
  • Find this author on Google Scholar
  • Find this author on PubMed
  • Search for this author on this site
Mamary Kone
  • Find this author on Google Scholar
  • Find this author on PubMed
  • Search for this author on this site
Guido Musch
  • Find this author on Google Scholar
  • Find this author on PubMed
  • Search for this author on this site
Marcos F. Vidal Melo
  • Find this author on Google Scholar
  • Find this author on PubMed
  • Search for this author on this site
Nicolas de Prost
  • Find this author on Google Scholar
  • Find this author on PubMed
  • Search for this author on this site
Daniel L. Hamilos
  • Find this author on Google Scholar
  • Find this author on PubMed
  • Search for this author on this site
Roshi Afshar
  • Find this author on Google Scholar
  • Find this author on PubMed
  • Search for this author on this site
Josalyn Cho
  • Find this author on Google Scholar
  • Find this author on PubMed
  • Search for this author on this site
Andrew D. Luster
  • Find this author on Google Scholar
  • Find this author on PubMed
  • Search for this author on this site
Benjamin D. Medoff
  • Find this author on Google Scholar
  • Find this author on PubMed
  • Search for this author on this site
  • Article
  • Figures & Data
  • Supplemental
  • Info & Metrics
  • PDF
Loading

This article has a correction. Please see:

  • Erratum - April 01, 2014

Abstract

In asthma, the relationship among airway inflammation, airway hyperresponsiveness, and lung function is poorly understood. Methods to noninvasively assess these relationships in human subjects are needed. We sought to determine whether 18F-FDG uptake rate (Ki, min−1) could serve as a biomarker of eosinophilic inflammation and local lung function. Methods: We used PET/CT to assess regional pulmonary perfusion (Q˙), specific ventilation per unit volume (sV˙A), fractional gas content (Fgas), airway wall thickness, and regional Ki 10 h after segmental allergen challenge to the right middle lobe in 6 asthmatic subjects with demonstrated atopy. Q˙, sV˙A, and Fgas in the allergen-challenged lobe were compared with the right upper lobe, where diluent was applied as a control. The airway wall thickness aspect ratio (ω) of the allergen-challenged airway was compared with those of similarly sized airways from unaffected areas of the lung. Differences in Ki between allergen and diluent segments were compared with those in cell counts obtained 24 h after the allergen challenge by a bronchoalveolar lavage of the respective segments. Results: We found systematic reductions in regional Q˙, sV˙A, and Fgas and increased ω in all subjects. The ratio of eosinophil count (allergen to diluent) was linearly related (R2 = 0.9917, P < 0.001) to the ratio of Ki. Conclusion: Regional Ki measured with PET is a noninvasive and highly predictive biomarker of eosinophilic airway inflammation and its functional effects. This method may serve to help in the understanding of allergic inflammation and test the therapeutic effectiveness of novel drugs or treatments.

  • airway constriction
  • ventilation–perfusion ratio
  • pulmonary gas exchange
  • fluorine isotopes
  • emission-computed tomography
  • nitrogen isotopes

Asthma is a complex syndrome broadly defined by airway inflammation, airway hyperresponsiveness, and mucus hypersecretion (1). In most cases, the airway inflammation of asthma results from an allergic reaction to an inhaled substance (2). In response to an antigenic challenge, airways develop eosinophilic inflammation with edema and increased mucus production. Although great progress has been made in the understanding of the pathogenesis of asthma (3), treatment has been hampered by the seeming lack of effectiveness of new treatments tested in clinical trials that appeared promising in animal models (4,5). Therefore, there is a need for disease biomarkers in human subjects with asthma so that novel therapies can be tested on small groups of asthma subjects before large-scale human trials are undertaken.

One potential candidate biomarker of inflammation is imaging of 18F-FDG uptake rate (Ki) using PET. In particular, local assessment of Ki after a segmental challenge appears particularly attractive because other parts of the lung can be used as a control, accounting for potential biologic variance in response among subjects and reducing the number of studies required for significance. In this approach, regional inflammation is induced by local bronchoscopic application of a proinflammatory substance, and the inflammatory reaction is assessed from the imaged local response of Ki. This method was successfully used to test medications against neutrophilic inflammation after endotoxin challenge, in a study in which Ki was shown to correlate with bronchoalveolar lavage (BAL) neutrophil counts (6). In allergic asthmatic patients, previous investigators have found an increase in 18F-FDG uptake in the region of segmental allergen challenge (7), but the relationship of the changes in Ki to local alterations in lung function (ventilation and perfusion) or to inflammatory cell counts in the challenged region was not assessed. Here, we present the feasibility of using a combination of segmental allergen challenge with noninvasive PET/CT to test the extent to which Ki in allergen-exposed regions correlates with BAL eosinophil counts and whether local increases in Ki correlate with alterations in local ventilation or perfusion, measured with PET, or with changes in airway wall thickness, measured with high-resolution CT (HRCT).

MATERIALS AND METHODS

Subject Characteristics

Six atopic asthmatic patients (5 female, 1 male) volunteered to be studied with protocols and procedures approved by the Human Research Committee of the Massachusetts General Hospital. All subjects met the National Asthma Education and Prevention Program's definition of asthma (8), had disease of mild to moderate severity based on spirometry and physician assessment (8), and had symptoms upon cat or dust mite exposure, with a corresponding positive skin prick test. Although some subjects had a history of inhaled corticosteroid use, they had not been receiving corticosteroids for at least 1 mo before the study. Subjects were on no other medications except for short-acting β-agonists for asthma and loratadine for nasal symptoms, both of which were withheld 12 h before the first bronchoscopy. The dosage of standardized allergen for bronchoscopic challenge was determined from quantitative skin testing as previously described (9). Standardized allergen extract for cat hair, Dermatophagoides pteronyssinus, and Dermatophagoides farinae were purchased from Greer Laboratories. Standardized cat hair allergen extract contained less than 1 ng of endotoxin per milliliter; standardized D. pteronyssinus and D. farinae allergen extract contained at least 9 ng of endotoxin per milliliter. Informed consent was obtained from each subject before the study. Characteristics of the individual subjects can be found in Table 1.

View this table:
  • View inline
  • View popup
TABLE 1

Subject Characteristics

Protocol

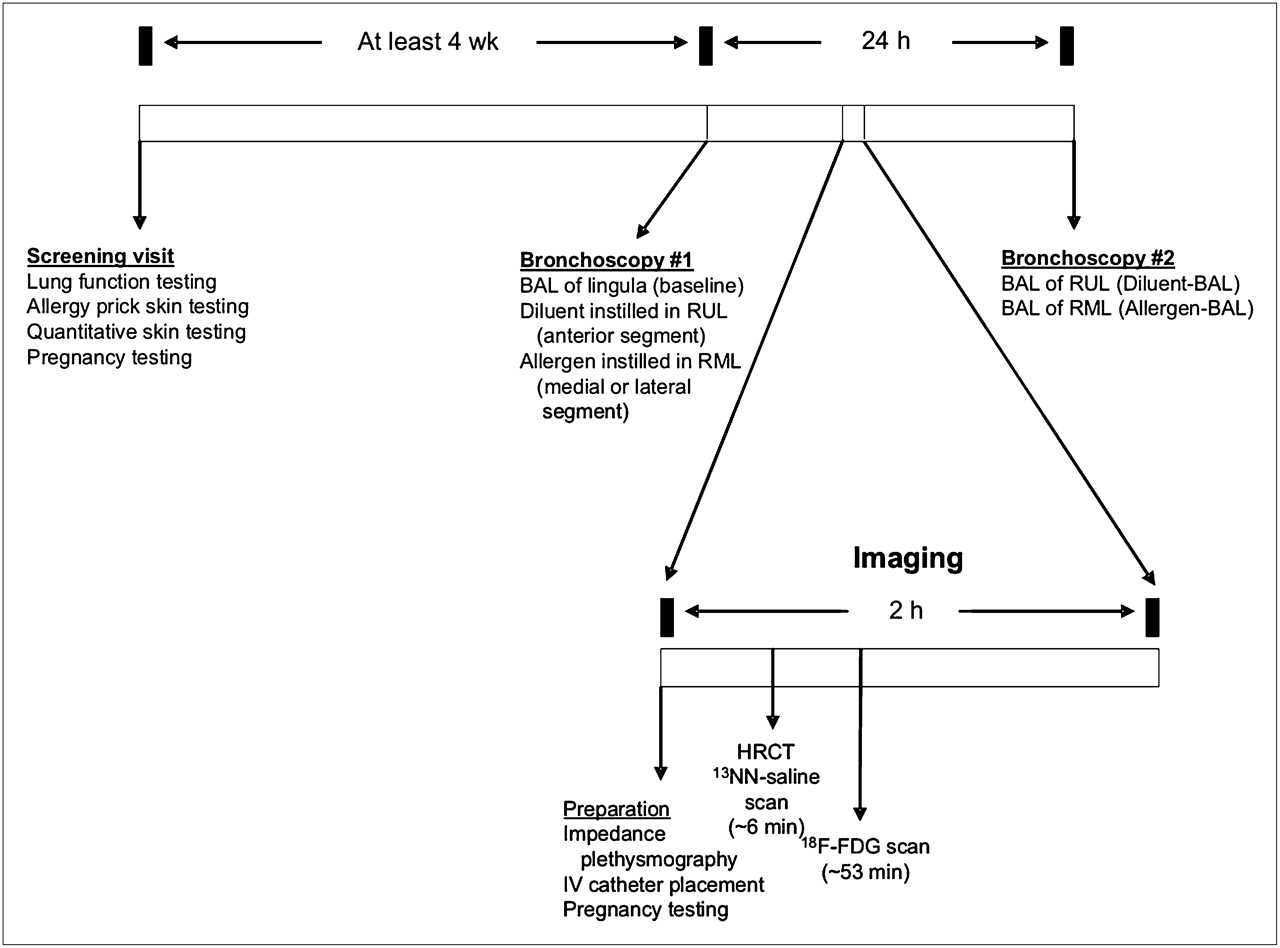
Segmental allergen challenge was performed at least 4 wk after measurements of atopy and any symptoms of infection as previously described (10). Subjects underwent fiberoptic bronchoscopy under conscious sedation and topical anesthetic (<300 mg total dose of lidocaine) on 2 occasions separated by 24 h, with imaging approximately 10 h after the first bronchoscopy (Fig. 1). During the first bronchoscopy, BAL was performed in the lingula with 120 mL of saline, and the return was sent for cellular analysis (baseline). Diluent (2 mL) was instilled into the anterior segment of the right upper lobe (RUL), and then allergen (2 mL) was instilled in the medial or lateral segment of the right middle lobe (RML) after a small test dose was found to be tolerated by the subject.

FIGURE 1.
  • Download figure
  • Open in new tab
  • Download powerpoint
FIGURE 1.

Protocol schema. Screening visit identifies subjects with mild asthma who are atopic. During first bronchoscopy, BAL is performed in lingula (baseline), diluent is applied in RUL, and allergen is applied in RML. After approximately 10 h, subject undergoes HRCT scan and 2 PET scans: 13NN-saline and 18F-FDG emission. Next morning, subject undergoes second bronchoscopy, during which BAL is performed in RUL and RML. BAL fluid is sent for cellular analysis from lingula and from RUL and RML.

For imaging, we used a PET/CT scanner (Biograph 64; Siemens AG) to obtain an HRCT of the thorax and 2 types of emission PET scans. The first emission scan (∼5 min) was acquired to measure regional pulmonary perfusion (Q˙) and specific ventilation per unit volume (sV˙A) from the kinetics of 13N (13NN) injected intravenously as a bolus in saline solution at the start of a brief (∼30 s) interval of apnea as described in detail elsewhere (11,12). Briefly, because of its low solubility in tissues (partition coefficient [λwater/air], 0.015 at 37°C), on arrival into the pulmonary capillaries virtually all 13NN diffuses into the alveolar airspace at first pass and regional tracer concentration during apnea is proportional to regional Q˙. When breathing resumes, regional sV˙A can be derived from the tracer washout rate, because 13NN is eliminated from the lung almost exclusively by ventilation. A second emission dynamic set of scans of 52-min 45-s duration was acquired to measure the uptake kinetics of 18F-FDG (∼370 MBq), which was infused intravenously over 60 s. Starting at the beginning of the infusion, sequential PET frames were acquired while venous blood was sampled at 5 min 30 s, 9 min 30 s, 25 min, 37 min, and 42 min 30 s (13). Blood samples (1 mL) were spun down, and the activity of plasma was measured in a γ-counter cross-calibrated to the PET scanner. After being transported into the cell by the same mechanism as glucose, 18F-FDG is phosphorylated by hexokinase to 18F-FDG-6-phosphate, which accumulates in proportion to the metabolic rate of the cell. Net Ki, a measure of cellular metabolic activity, was calculated with the graphical method of Patlak et al. (14,15) by plotting lung activity normalized to plasma activity versus the integral of plasma activity normalized to plasma activity. At steady state of tracer transfer between plasma and intracellular compartments, the plot becomes a straight line (in the lung, usually 8–10 min after injection of 18F-FDG), the slope of which corresponds to Ki. Ki was not density-normalized, since in this model any increase in density is primarily due to an influx of inflammatory exudate. The average total effective dose for the subjects (including the HRCT, 13NN-saline, and 18F-FDG) was 10.3 mSv.

During a second bronchoscopy, two 120-mL BALs were performed on the airway that received diluent and the airway that received allergen, and the returns were sent for cellular analysis. Cell differential counts for BAL were determined by enumerating alveolar macrophages, neutrophils, eosinophils, and lymphocytes on cytocentrifuged preparations stained with Diff-Quick (Dade Behring). Antibodies to CD3 (UCHT1), CD4 (SK3), and CD8 (RPA-T8), purchased from BD Biosciences, were used in these experiments and directly conjugated to their respective fluorochromes. Isolated cells from the BAL were blocked with 10% human serum and stained in phosphate-buffered saline with 1% fetal calf serum. Cells were then fixed with 2% paraformaldehyde. Samples were run on an FACSCalibur (BD Biosciences) cytometer and analyzed with FlowJo Software (Tree Star). BAL lymphocytes were specifically analyzed using forward and side scatter properties as previously described (9). Because the cells were resuspended in 5 mL of fluid after centrifugation, the resulting concentrations were multiplied by 5 mL to yield the total number of cells in the sample.

Data Analysis

Total and differential cell counts were compared among the baseline, diluent, and allergen samples. HRCT scans were analyzed using Pulmonary Workstation 2 (VIDA Diagnostics). Fractional gas content (Fgas) was calculated as the volume of gas divided by the volume of lung for a region of interest. Whole-lung and lobe masks were generated and used for Fgas, Q˙, and sV˙A analysis. Average airway wall and luminal cross-sectional areas were estimated for the allergen-challenged airway (medial or lateral segmental bronchus), the diluent airway (anterior segmental bronchus), and the lingular bronchus. The wall thickness aspect ratio (ω, calculated as the average airway wall area divided by the total airway area excluding a portion of both ends) was calculated for these airways and then compared with the average obtained from within the rest of the lung (control airways) that had similar inner cross-sectional area (within 25% of the luminal area). Regional Q˙ and sV˙A, relative to the mean of the lung (mean-normalized Q˙ and sV˙A) were calculated as previously described (11,12) for the whole lung, allergen lobe, and diluent lobe. Ki was assessed as the influx constant determined from the slope of a Patlak plot, constructed from the tissue and plasma radioactivity (14,16). Regional Q˙, sV˙A, Fgas, and ω in the allergen- and diluent-exposed airways were plotted against Ki. Also, the ratio of eosinophil counts taken from the allergen lobe BAL relative to that obtained from the diluent lobe BAL were plotted against the ratio of Ki of the allergen-challenged lobe relative to that of the diluent lobe. A linear regression was performed on that dataset, and the Pearson correlation coefficient was calculated. For cell count, airway response, and Q˙ and sV˙A data, both parametric and nonparametric tests yielded similar results; thus, the results of simple paired t tests are reported. Unpaired t tests were applied to the airway response data, where the choice of control airways for comparison was based on size. Data are expressed as mean ± SD. Differences in results were considered to be statistically significant when P was less than 0.05.

RESULTS

All subjects except for one (h114) had normal spirometry results (Table 1). The subject without normal results had mild obstruction, as well as an increased body mass index. All subjects had low cell counts in BAL fluid at baseline (lingula), with a low number of eosinophils (Supplemental Fig. 1; supplemental materials are available online only at http://jnm.snmjournals.org). However, in the allergen BAL, there was a significant increase in the total cell count that was predominantly due to an increase in the number of eosinophils (Supplemental Fig. 1). There was an increase in neutrophils and monocytes, but this was not consistent in all subjects and was less than eosinophils by at least a factor of 5. There was also an increase in the number of CD4 lymphocytes in the allergen BAL, as we have seen previously (9). These data are consistent with an allergic inflammation localized in the allergen-challenged segment of the lung. The diluent-challenged segment had a mild neutrophilic and eosinophilic inflammatory reaction, but the magnitude of the cellular inflammatory response was much less than that in the allergen-challenged segment (Supplemental Fig. 1).

On visual inspection of HRCT images, the allergen-challenged segment showed reduced aeration in all subjects, whereas the diluent-challenged segment remained relatively normal. The changes in the RML likely result from inflammation in response to the allergen, because these changes were not seen in the RUL after diluent instillation. The 13NN emission scans showed reduced Q˙ and sV˙A in the allergen-challenged segment relative to the diluent segment (Fig. 2). The mean-normalized Q˙ and sV˙Awere 76% and 83% less, respectively, in the allergen-challenged segment than in the diluent segment (Fig. 3). The 18F-FDG scan showed increased tracer uptake in the allergen-challenged segment consistent with increased inflammation in that segment (Fig. 2). The ω of the allergen-challenged bronchus was significantly elevated by about 8%, compared with that measured in airways of similar size from other regions in the lung (Fig. 4). In contrast, ω of diluent and baseline airways was not different from that of airways of similar size in other regions of the lung. Taken together, these data suggest that segmental allergen challenge induced a localized inflammatory response characterized by eosinophilia and increased pulmonary metabolic rate. This response was associated with localized airway wall thickening or narrowing leading to hypoventilation and hypoperfusion of the challenged segment.

FIGURE 2.
  • Download figure
  • Open in new tab
  • Download powerpoint
FIGURE 2.

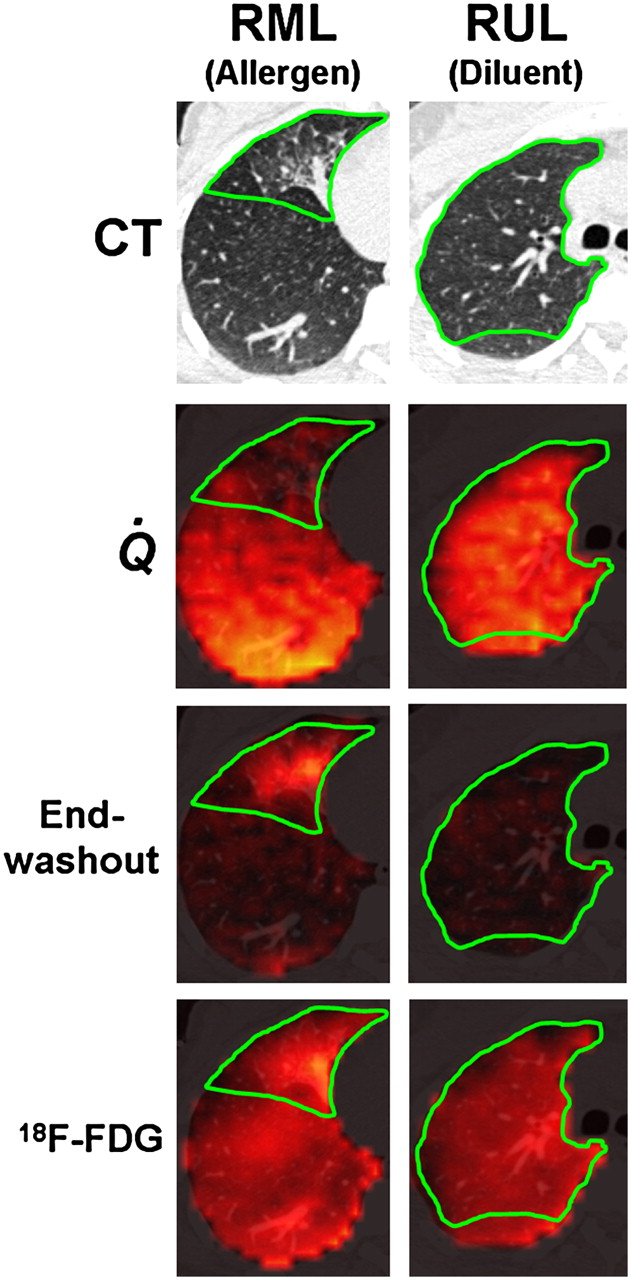
Example images. First row: Axial CT slice through RML and RUL, where allergen and diluent, respectively, were administered. Green border shows approximate location of RML and RUL. Second row: Fused perfusion images from 13NN-saline PET scan during breath-hold and CT. Perfusion is reduced in allergen region but normal in diluent region. Third row: Fused end-washout image from 13NN ventilation scan and CT. Ventilation-defective area in region of allergen challenge manifests as tracer retention at end of washout. In contrast, no residual tracer was present in diluent region by end of washout. Fourth row: 18F-FDG scan showing increased uptake in allergen region, compared with diluent region.

FIGURE 3.
  • Download figure
  • Open in new tab
  • Download powerpoint
FIGURE 3.

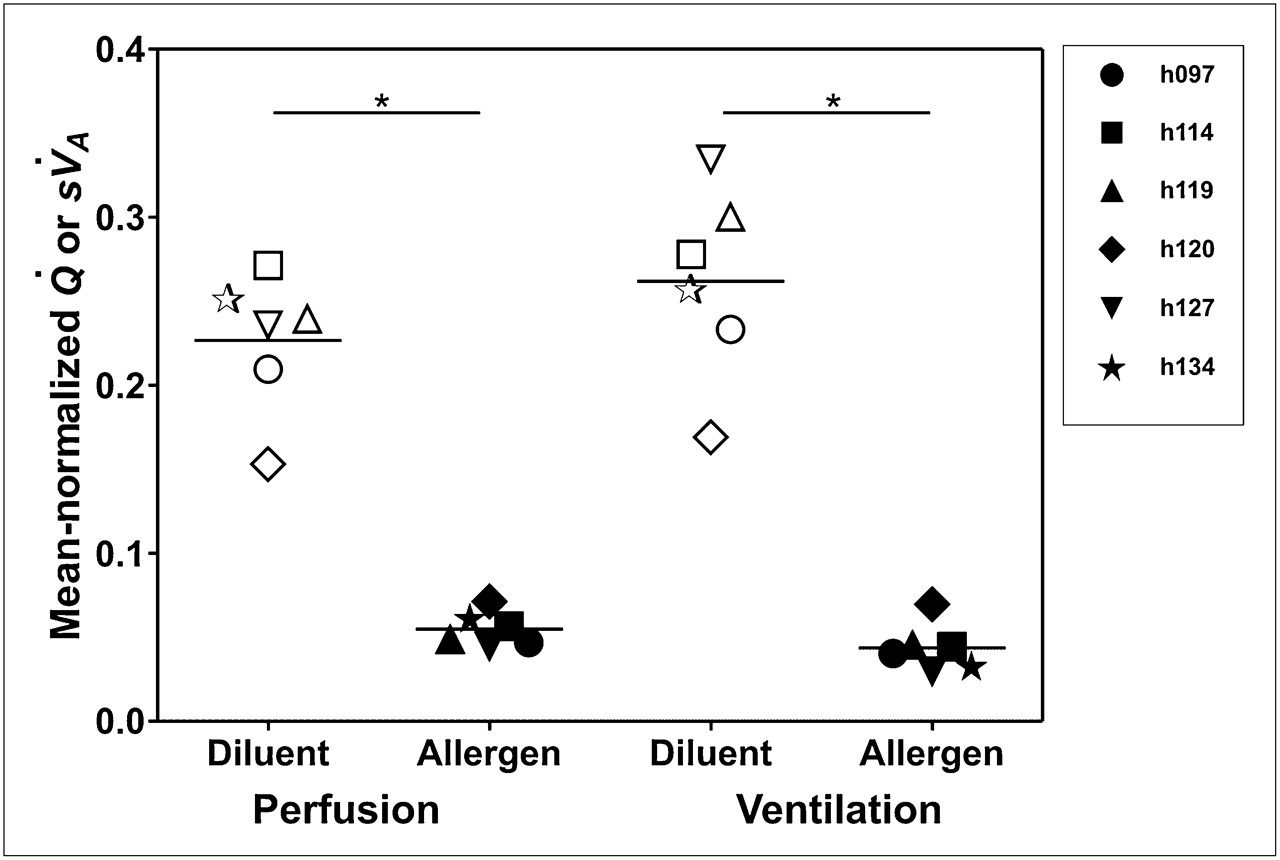
Perfusion and ventilation. Mean-normalized perfusion and ventilation are substantially lower in allergen-challenged region than in diluent region (*P < 0.001 for each comparison).

FIGURE 4.
  • Download figure
  • Open in new tab
  • Download powerpoint
FIGURE 4.

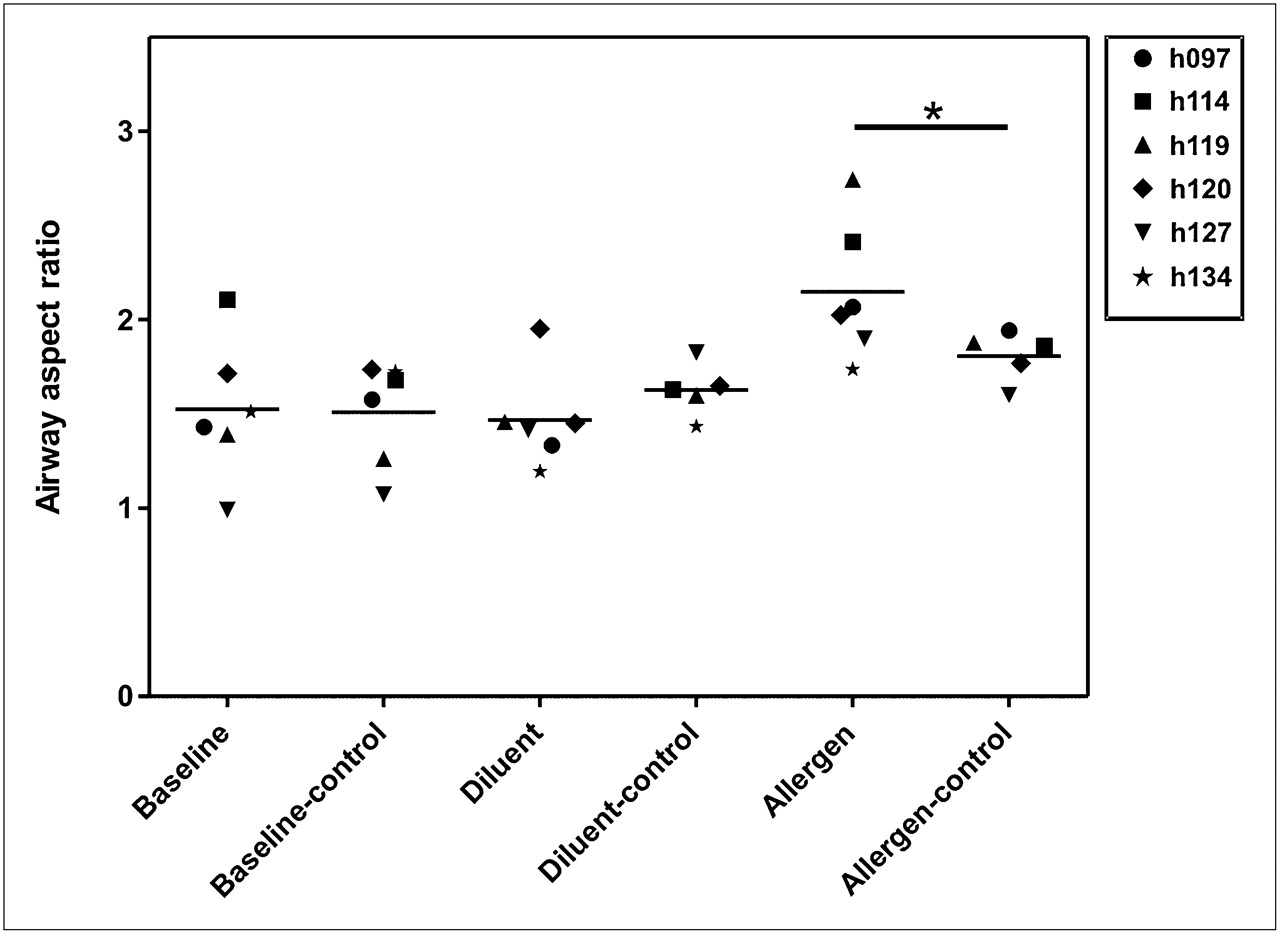
Airway response. Aspect ratio was calculated as average airway wall area divided by average total airway area. Because we had no baseline CT scan for comparison, we chose other airways of similar size (within 25%) and calculated their aspect ratio. These were used as control airways for comparison. Baseline (lingula) and diluent airways are similar in aspect ratio to other airways of similar size (baseline-control and diluent-control, respectively). Allergen-challenged airway has larger aspect ratio (meaning either thicker wall or smaller inner lumen or both) than other airways of similar size (allergen compared with allergen-control, P < 0.05).

Q˙, sV˙A, ω, and Fgas showed systematic differences between allergen and diluent regions for each subject (Fig. 5), and these variables showed systematic changes with 18F-FDG uptake (Fig. 5). On average, the Ki in the allergen-challenged segment was about twice that in the diluent-exposed one (Table 2). The ratio of eosinophils (allergen to diluent) was linearly related to the ratio of Ki (R2 = 0.9917, P < 0.001, Fig. 6):EoAll/EoDil=124×Ki,All/Ki,Dil−110,where EoAll is the eosinophil count in the allergen-challenged segment, EoDil is the eosinophil count in the diluent segment, Ki,All is the Ki in the allergen-challenged segment, and Ki,Dil is the Ki in the diluent segment. The ratio of allergen and diluent BAL for all other cell counts (neutrophils, monocytes, CD4 lymphocytes, or CD8 lymphocytes) was much less correlated with the ratio in Ki between allergen and diluent regions measured with PET (Supplemental Fig. 2).

FIGURE 5.
  • Download figure
  • Open in new tab
  • Download powerpoint
FIGURE 5.

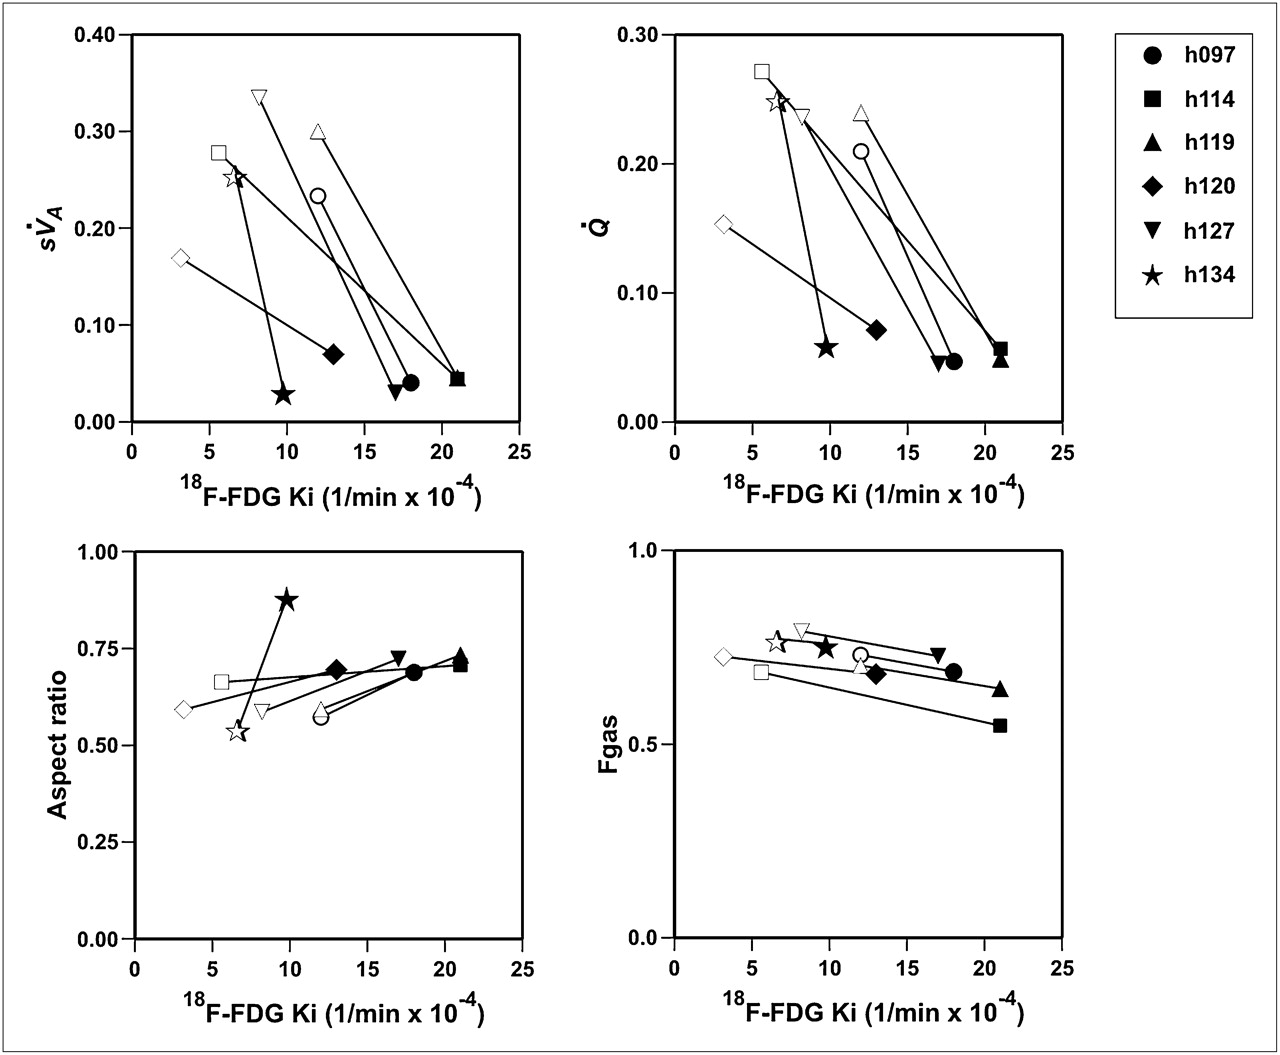
Functional variables vs. Ki. Clockwise from upper left: Embedded Image, Embedded Image, relative aspect ratio, and Fgas. Each symbol represents individual subject, with open symbols representing diluent and closed symbols allergen.

FIGURE 6.
  • Download figure
  • Open in new tab
  • Download powerpoint
FIGURE 6.

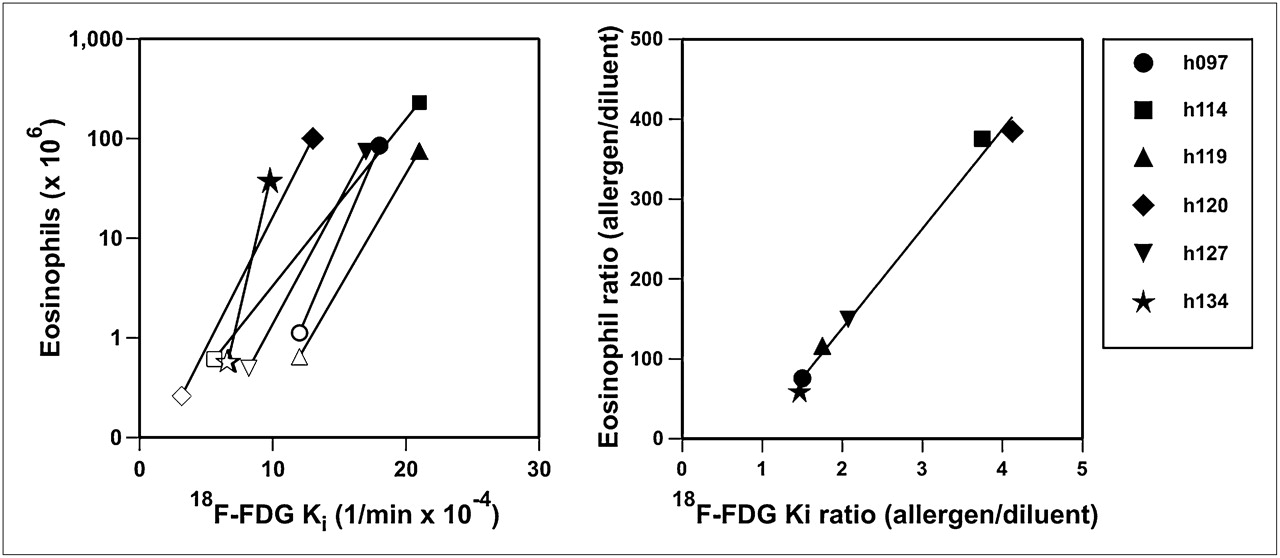
Eosinophil count vs. Ki and eosinophil count ratio (allergen to diluent) vs. Ki ratio. Each subject is represented by different symbol. All subjects had increase in Ki and eosinophil count in allergen-challenged region (dark symbols), compared with diluent region (open symbols). Eosinophil count ratio was highly correlated (R2 = 0.9917, P < 0.001) with Ki ratio. Equation of regression line is eosinophil count ratio = 124 × Ki ratio − 110.

View this table:
  • View inline
  • View popup
TABLE 2

Allergen Dose and Ki

DISCUSSION

This study demonstrated that segmental allergen challenge in atopic asthmatic subjects causes a localized inflammatory response that includes elevation of Ki, thickening or constriction of the challenged airway, and reductions of regional perfusion and ventilation of the subtended lobe. Furthermore, the results show a robust linear relation between the relative elevation in eosinophil BAL count from the allergen-challenged airway and the relative elevation in Ki. Thus, the Ki measured 10 h after allergen challenge appears to be a highly predictive marker of the resulting increase in eosinophil BAL count recovered 24 h later.

Before discussing these results, some limitations of the methods must be acknowledged. First, we chose the timing of the imaging session (10 h after challenge) and that of the BAL sampling (14 h after imaging) to enhance the likelihood of a correlation between the change in Ki and that of the cellular counts in the subsequent BAL. Although not directly studied by Taylor et al. (7) the Ki signal in 5 allergen-challenged atopic asthmatic patients measured from 1 to 32 h after challenge appeared to show no significant differences over that period. Most subjects were studied 6–7 h after challenge. Also, our own modeling work suggests that the 18F-FDG signal may come mostly from marginating cells relatively close to the vascular bed (17). Given that the vessel-to-alveolus transit of inflammatory cells takes time (18), we reasoned that in order for the cells recovered from the BAL to have been part of the marginating pool, the BAL sample should be taken several hours after the 18F-FDG scan.

Second, to limit the number of procedures and radiation exposure for the subjects, we did not obtain a set of images under control conditions in this study with which to compare the values of regional Q˙, sV˙A, and Fgas. For this reason, we chose to compare the regional values of Q˙ and sV˙A between the allergen and the diluent regions, both having diluent applied to them and controlled for the possible inflammatory effects of the bronchoscopy alone. However, it is known that Q˙, sV˙A, and Fgas change with lung height (19). In the supine position, the RML and RUL are at approximately the same height, thus reducing any differences in Q˙, sV˙A, and Fgas between the respective regions.

Dramatic alterations in Q˙ and sV˙A are caused by methacholine-induced bronchoconstriction (12), and this study suggests that the same may happen in allergen-induced asthma, at least with locally applied allergen. There have been few studies of Q˙ and sV˙A in allergen-challenged asthma subjects. In a study of regional Q˙ and sV˙A in 5 subjects using infused 99mTc-macroaggregated albumin and inhaled 18mKr, respectively (20), “variable changes” in ventilation and perfusion were found, but the alterations were not quantified. The authors noted that the changes in ventilation and perfusion appeared spatially matched. They also noted that this finding was different from other studies from their group using histamine (21) and exercise (22), in which only ventilation appeared to be altered. The changes in Q˙ seen in our study were remarkable; average Q˙ per voxel in the challenged lobe was 5.5% of the mean of the lung, whereas it was 23% in the lobe subject to just the diluent. Although the RUL Q˙ was 23% of the mean, the upper lobes are expected to have lower Q˙ than the mean and this was not unlike the perfusion of the unaffected left upper lobe. Notably, the reductions in regional ventilation matched closely the reductions in Q˙; sV˙A in the challenged lobe was 4.4% of the mean of the lung, versus 26% in the diluent-exposed lobe. This match is similar to that described by Munkner et al. (20) and to that found in methacholine-induced asthma (12).

The mechanism of reduced ventilation in allergic asthma is postulated to be due to airway constriction, airway wall edema, and mucus plugging. In this study, the increased airway wall aspect ratio in the allergen-challenged airway compared with other airways of similar luminal size suggests that the allergen-challenged airway either constricted or its wall thickened, or most likely both (Fig. 4). However, the increase in airway resistance caused by the degree of luminal narrowing in just that airway cannot be sufficient to account for the dramatic reduction in sV˙A of the allergen-challenged lobe. The reduction in regional ventilation through the allergen-challenged airway to its daughter airways in the RML may have promoted constriction in airways too small (<2 mm) to measure with HRCT, resulting in the reduction in ventilation. This behavior would be consistent with a theoretic model of airway constriction in asthma (23) that demonstrated the feed-forward and feedback mechanisms of regional tidal expansion on the development of patchy ventilation defects once a critical level of airway narrowing occurred. It is also possible that the allergen deposited in the segmental airway may have migrated distally to smaller airways and affected their caliber directly by activating local inflammation. It is also possible that mucus plugging occurred in small airways, but there was no evidence of mucus plugging in airways larger than 2 mm by visual inspection.

The reduction in regional Q˙ could be from active mechanisms (hypoxic pulmonary vasoconstriction) or from local hyperinflation of the parenchyma. However, local hyperinflation seems unlikely, because Fgas was actually lower in the RML than in the RUL, despite marked reductions in Q˙, in all subjects (Fig. 5). This finding is consistent with our previous findings in methacholine-induced asthma (12) and suggests that active mechanisms of Q˙ redistribution are also operating in allergen-induced bronchoconstriction.

18F-FDG is transported across cell membranes by the D-glucose transporter, where it is phosphorylated by hexokinase to a stable end product, fluoro-deoxyglucose-6-phosphate. Thus 18F-FDG accumulates in tissue in proportion to the number of cells times the level of hexokinase activity in each cell. Cells that are more dependent on anaerobic glycolysis of glucose (e.g., granulocytes) tend to accumulate considerably more 18F-FDG. For example, Ki (1/min) has been shown to correlate with granulocyte number and activity (24–26). In addition, 18F-FDG has been shown to be taken up by eosinophils (27,28).

There have been 2 previous studies using 18F-FDG PET in asthma (7,29). The first study used both segmental allergen challenge and whole-lung allergen challenge (7). Subjects were imaged 1–32 h after an allergen challenge to the posterior segment of the RUL. Uptake was increased 4-fold when compared with a control segment, but the variability of Ki between subjects was large (range, 0.00061–0.00267 min−1 in the challenged segment). These values are similar to ours (0.00098–0.00210 min−1), despite differences in methodology (timing and dosing). The investigators did not perform BAL analysis of the allergen-challenged segment, nor did they analyze structural or functional changes in the region of the challenge.

The fact that the ratio in Ki yielded such a high correlation with that in eosinophil BAL counts suggests that although the relative responses to the allergen challenge were quite variable among subjects (ratios of Ki ranging from 1.5 to 4.1), there was a predictable relationship between these ratios in Ki and that of the corresponding eosinophil BAL counts (Fig. 6). Of interest is that we were not able to detect a significant relationship between Ki and eosinophil count when the variables were regressed directly (Supplemental Fig. 3) and not as a ratio of allergen values to diluent values. This result could possibly be explained by a high degree of intersubject variability in the proportionality factor between eosinophil count and local Ki, or in the cellular metabolic profiles among subjects, which cancels out in the calculation of the ratios.

Noteworthy also is the finding that the regression line slope of the relationship was not unity but approximately 124. This means that there was amplification between the ratio of Ki and the cell counts from the BAL sampling. The reasons for the magnitude of this amplification are not clear. It could be that Ki does not reflect the number of eosinophils directly but that, rather, another cell is responsible for recruiting eosinophils to the site of allergen exposure. This possibility, however, is unlikely since we could not find a relationship between other relevant cell types (including neutrophils, total lymphocytes, CD4 lymphocytes, CD8 lymphocytes, or monocytes) and Ki. A more likely explanation is that Ki represents the number of active eosinophils in the process of margination at a given point in time, and this number could be substantially lower than the number of alveolar eosinophils sampled in the BAL 14 h later. Regardless, the experimental evidence shows that the relative difference in Ki measured 10 h after allergen challenge is a quantitative marker of allergen-specific eosinophil recruitment to the alveolus measured 14 h later.

CONCLUSION

Our study provides direct evidence that Ki, measured noninvasively with PET, can precisely predict the degree of eosinophilic inflammatory response in the lungs of asthmatic patients undergoing an allergen challenge. Furthermore, these results demonstrate spatial matching between the site of inflammatory stimulus and the ensuing increase in airway wall area relative to lumen and the decrease in Q˙, sV˙A, and lung aeration. These techniques thus allow detailed studies of the relationship between inflammation and airway hyperresponsiveness in asthma and may be used to efficiently test the physiologic and antiinflammatory effects of novel therapeutic agents. We believe that this powerful method has great potential for advancing asthma research and drug discovery.

DISCLOSURE STATEMENT

The costs of publication of this article were defrayed in part by the payment of page charges. Therefore, and solely to indicate this fact, this article is hereby marked “advertisement” in accordance with 18 USC section 1734.

Acknowledgments

We thank Mary Loveless and Melissa Bruen for technical assistance with image acquisition and processing; Carol Leary for help with the human studies protocol; Allegra Bruce, Peter Rice, and Ronald Callahan for radiation safety and quality assurance testing of the radioisotopes; and John Correia, William Bucelewicz, and David Lee for preparation of the radioisotopes. This work was supported by grants from the NIH: HL088297, HL07874, AI40618, HL-68011, AI095261, and HL-04501. No other potential conflict of interest relevant to this article was reported.

Footnotes

  • Published online Oct. 11, 2011.

  • © 2011 by Society of Nuclear Medicine

REFERENCES

  1. 1.↵
    1. Busse WW,
    2. Lemanske RF Jr.
    . Asthma. N Engl J Med. 2001;344:350–362.
    OpenUrlCrossRefPubMed
  2. 2.↵
    1. Craig TJ,
    2. King TS,
    3. Lemanske RF Jr.,
    4. et al
    . Aeroallergen sensitization correlates with PC(20) and exhaled nitric oxide in subjects with mild-to-moderate asthma. J Allergy Clin Immunol. 2008;121:671–677.
    OpenUrlCrossRefPubMed
  3. 3.↵
    1. Medoff BD,
    2. Thomas SY,
    3. Luster AD
    . T cell trafficking in allergic asthma: the ins and outs. Annu Rev Immunol. 2008;26:205–232.
    OpenUrlCrossRefPubMed
  4. 4.↵
    1. Haldar P,
    2. Brightling CE,
    3. Hargadon B,
    4. et al
    . Mepolizumab and exacerbations of refractory eosinophilic asthma. N Engl J Med. 2009;360:973–984.
    OpenUrlCrossRefPubMed
  5. 5.↵
    1. Nair P,
    2. Pizzichini MM,
    3. Kjarsgaard M,
    4. et al
    . Mepolizumab for prednisone-dependent asthma with sputum eosinophilia. N Engl J Med. 2009;360:985–993.
    OpenUrlCrossRefPubMed
  6. 6.↵
    1. Chen DL,
    2. Bedient TJ,
    3. Kozlowski J,
    4. et al
    . [18F]fluorodeoxyglucose positron emission tomography for lung antiinflammatory response evaluation. Am J Respir Crit Care Med. 2009;180:533–539.
    OpenUrlCrossRefPubMed
  7. 7.↵
    1. Taylor IK,
    2. Hill AA,
    3. Hayes M,
    4. et al
    . Imaging allergen-invoked airway inflammation in atopic asthma with [18F]-fluorodeoxyglucose and positron emission tomography. Lancet. 1996;347:937–940.
    OpenUrlCrossRefPubMed
  8. 8.↵
    Expert panel report 3 (EPR-3): Guidelines for the diagnosis and management of asthma—summary report 2007. J Allergy Clin Immunol. 2007;120(5, suppl)S94–S138.
    OpenUrlCrossRefPubMed
  9. 9.↵
    1. Thomas SY,
    2. Banerji A,
    3. Medoff BD,
    4. Lilly CM,
    5. Luster AD
    . Multiple chemokine receptors, including CCR6 and CXCR3, regulate antigen-induced T cell homing to the human asthmatic airway. J Immunol. 2007;179:1901–1912.
    OpenUrlAbstract/FREE Full Text
  10. 10.↵
    1. Lilly CM,
    2. Nakamura H,
    3. Belostotsky OI,
    4. et al
    . Eotaxin expression after segmental allergen challenge in subjects with atopic asthma. Am J Respir Crit Care Med. 2001;163:1669–1675.
    OpenUrlCrossRefPubMed
  11. 11.↵
    1. Harris RS,
    2. Winkler T,
    3. Musch G,
    4. et al
    . The prone position results in smaller ventilation defects during bronchoconstriction in asthma. J Appl Physiol. 2009;107:266–274.
    OpenUrlAbstract/FREE Full Text
  12. 12.↵
    1. Harris RS,
    2. Winkler T,
    3. Tgavalekos N,
    4. et al
    . Regional pulmonary perfusion, inflation, and ventilation defects in bronchoconstricted patients with asthma. Am J Respir Crit Care Med. 2006;174:245–253.
    OpenUrlCrossRefPubMed
  13. 13.↵
    1. Schroeder T,
    2. Vidal Melo MF,
    3. Musch G,
    4. Harris RS,
    5. Venegas JG,
    6. Winkler T
    . Image-derived input function for assessment of 18F-FDG uptake by the inflamed lung. J Nucl Med. 2007;48:1889–1896.
    OpenUrlAbstract/FREE Full Text
  14. 14.↵
    1. Patlak CS,
    2. Blasberg RG
    . Graphical evaluation of blood-to-brain transfer constants from multiple-time uptake data: generalizations. J Cereb Blood Flow Metab. 1985;5:584–590.
    OpenUrlCrossRefPubMed
  15. 15.↵
    1. Patlak CS,
    2. Blasberg RG,
    3. Fenstermacher JD
    . Graphical evaluation of blood-to-brain transfer constants from multiple-time uptake data. J Cereb Blood Flow Metab. 1983;3:1–7.
    OpenUrlCrossRefPubMed
  16. 16.↵
    1. Schroeder T,
    2. Vidal Melo MF,
    3. Musch G,
    4. Harris RS,
    5. Winkler T,
    6. Venegas JG
    . PET imaging of regional 18F-FDG uptake and lung function after cigarette smoke inhalation. J Nucl Med. 2007;48:413–419.
    OpenUrlAbstract/FREE Full Text
  17. 17.↵
    1. Schroeder T,
    2. Vidal Melo MF,
    3. Musch G,
    4. Harris RS,
    5. Venegas JG,
    6. Winkler T
    . Modeling pulmonary kinetics of 2-deoxy-2-[18F]fluoro-D-glucose during acute lung injury. Acad Radiol. 2008;15:763–775.
    OpenUrlCrossRefPubMed
  18. 18.↵
    1. Schneider T,
    2. van Velzen D,
    3. Moqbel R,
    4. Issekutz AC
    . Kinetics and quantitation of eosinophil and neutrophil recruitment to allergic lung inflammation in a brown Norway rat model. Am J Respir Cell Mol Biol. 1997;17:702–712.
    OpenUrlCrossRefPubMed
  19. 19.↵
    1. Hopkins SR,
    2. Henderson AC,
    3. Levin DL,
    4. et al
    . Vertical gradients in regional lung density and perfusion in the supine human lung: the Slinky effect. J Appl Physiol. 2007;103:240–248.
    OpenUrlAbstract/FREE Full Text
  20. 20.↵
    1. Munkner T,
    2. Bundgaard A
    . Regional V/Q changes in asthmatics after antigen inhalation. Eur J Respir Dis Suppl. 1986;143:44–47.
    OpenUrlPubMed
  21. 21.↵
    1. Munkner T,
    2. Bundgaard A
    . Regional V/Q changes in asthmatics after histamine inhalation. Eur J Respir Dis Suppl. 1986;143:22–27.
    OpenUrlPubMed
  22. 22.↵
    1. Munkner T,
    2. Bundgaard A
    . Regional V/Q changes in asthmatics after exercise. Eur J Respir Dis Suppl. 1986;143:62–66.
    OpenUrlPubMed
  23. 23.↵
    1. Venegas JG,
    2. Winkler T,
    3. Musch G,
    4. et al
    . Self-organized patchiness in asthma as a prelude to catastrophic shifts. Nature. 2005;434:777–782.
    OpenUrlCrossRefPubMed
  24. 24.
    1. Chen DL,
    2. Schuster DP
    . Positron emission tomography with [18F]fluorodeoxyglucose to evaluate neutrophil kinetics during acute lung injury. Am J Physiol Lung Cell Mol Physiol. 2004;286:L834–L840.
    OpenUrlAbstract/FREE Full Text
  25. 25.
    1. Jones HA,
    2. Cadwallader KA,
    3. White JF,
    4. Uddin M,
    5. Peters AM,
    6. Chilvers ER
    . Dissociation between respiratory burst activity and deoxyglucose uptake in human neutrophil granulocytes: implications for interpretation of 18F-FDG PET images. J Nucl Med. 2002;43:652–657.
    OpenUrlAbstract/FREE Full Text
  26. 26.
    1. Musch G,
    2. Venegas JG,
    3. Bellani G,
    4. et al
    . Regional gas exchange and cellular metabolic activity in ventilator-induced lung injury. Anesthesiology. 2007;106:723–735.
    OpenUrlCrossRefPubMed
  27. 27.↵
    1. Kim TJ,
    2. Lee KW,
    3. Kim HY,
    4. et al
    . Simple pulmonary eosinophilia evaluated by means of FDG PET: the findings of 14 cases. Korean J Radiol. 2005;6:208–213.
    OpenUrlCrossRefPubMed
  28. 28.↵
    1. Venge P,
    2. Moberg L,
    3. Bjornsson E,
    4. Bergstrom M,
    5. Langstrom B,
    6. Hakansson L
    . Mechanisms of basal and cytokine-induced uptake of glucose in normal human eosinophils: relation to apoptosis. Respir Med. 2003;97:1109–1119.
    OpenUrlCrossRefPubMed
  29. 29.↵
    1. Jones HA,
    2. Marino PS,
    3. Shakur BH,
    4. Morrell NW
    . In vivo assessment of lung inflammatory cell activity in patients with COPD and asthma. Eur Respir J. 2003;21:567–573.
    OpenUrlAbstract/FREE Full Text
  • Received for publication December 6, 2010.
  • Accepted for publication June 22, 2011.
PreviousNext
Back to top

In this issue

Journal of Nuclear Medicine: 52 (11)
Journal of Nuclear Medicine
Vol. 52, Issue 11
November 1, 2011
  • Table of Contents
  • Table of Contents (PDF)
  • About the Cover
  • Index by author
Print
Download PDF
Article Alerts
Sign In to Email Alerts with your Email Address
Email Article

Thank you for your interest in spreading the word on Journal of Nuclear Medicine.

NOTE: We only request your email address so that the person you are recommending the page to knows that you wanted them to see it, and that it is not junk mail. We do not capture any email address.

Enter multiple addresses on separate lines or separate them with commas.
18F-FDG Uptake Rate Is a Biomarker of Eosinophilic Inflammation and Airway Response in Asthma
(Your Name) has sent you a message from Journal of Nuclear Medicine
(Your Name) thought you would like to see the Journal of Nuclear Medicine web site.
Citation Tools
18F-FDG Uptake Rate Is a Biomarker of Eosinophilic Inflammation and Airway Response in Asthma
R. Scott Harris, José G. Venegas, Chanikarn Wongviriyawong, Tilo Winkler, Mamary Kone, Guido Musch, Marcos F. Vidal Melo, Nicolas de Prost, Daniel L. Hamilos, Roshi Afshar, Josalyn Cho, Andrew D. Luster, Benjamin D. Medoff
Journal of Nuclear Medicine Nov 2011, 52 (11) 1713-1720; DOI: 10.2967/jnumed.110.086355

Citation Manager Formats

  • BibTeX
  • Bookends
  • EasyBib
  • EndNote (tagged)
  • EndNote 8 (xml)
  • Medlars
  • Mendeley
  • Papers
  • RefWorks Tagged
  • Ref Manager
  • RIS
  • Zotero
Share
18F-FDG Uptake Rate Is a Biomarker of Eosinophilic Inflammation and Airway Response in Asthma
R. Scott Harris, José G. Venegas, Chanikarn Wongviriyawong, Tilo Winkler, Mamary Kone, Guido Musch, Marcos F. Vidal Melo, Nicolas de Prost, Daniel L. Hamilos, Roshi Afshar, Josalyn Cho, Andrew D. Luster, Benjamin D. Medoff
Journal of Nuclear Medicine Nov 2011, 52 (11) 1713-1720; DOI: 10.2967/jnumed.110.086355
Twitter logo Facebook logo LinkedIn logo Mendeley logo
  • Tweet Widget
  • Facebook Like
  • Google Plus One
Bookmark this article

Jump to section

  • Article
    • Abstract
    • MATERIALS AND METHODS
    • RESULTS
    • DISCUSSION
    • CONCLUSION
    • DISCLOSURE STATEMENT
    • Acknowledgments
    • Footnotes
    • REFERENCES
  • Figures & Data
  • Supplemental
  • Info & Metrics
  • PDF

Related Articles

  • This Month in JNM
  • Erratum
  • PubMed
  • Google Scholar

Cited By...

  • Consensus Recommendations on the Use of 18F-FDG PET/CT in Lung Disease
  • Measuring lung function in airways diseases: current and emerging techniques
  • Quantification of Lung PET Images: Challenges and Opportunities
  • Imaging Pulmonary Inflammation
  • Molecular Imaging of Inflammation: Current Status
  • 18F-FDG Uptake to Assess Eosinophilic Inflammation in Asthma: Would SUV at Late Imaging Be Relevant?
  • Reply: 18F-FDG Uptake to Assess Eosinophilic Inflammation in Asthma: Would SUV at Late Imaging Be Relevant?
  • Google Scholar

More in this TOC Section

  • Feasibility of Ultra-Low-Activity 18F-FDG PET/CT Imaging Using a Long–Axial-Field-of-View PET/CT System
  • Cardiac Presynaptic Sympathetic Nervous Function Evaluated by Cardiac PET in Patients with Chronotropic Incompetence Without Heart Failure
  • Validation and Evaluation of a Vendor-Provided Head Motion Correction Algorithm on the uMI Panorama PET/CT System
Show more Clinical Investigations

Similar Articles

SNMMI

© 2025 SNMMI

Powered by HighWire