


Article Figures & Data
Figures
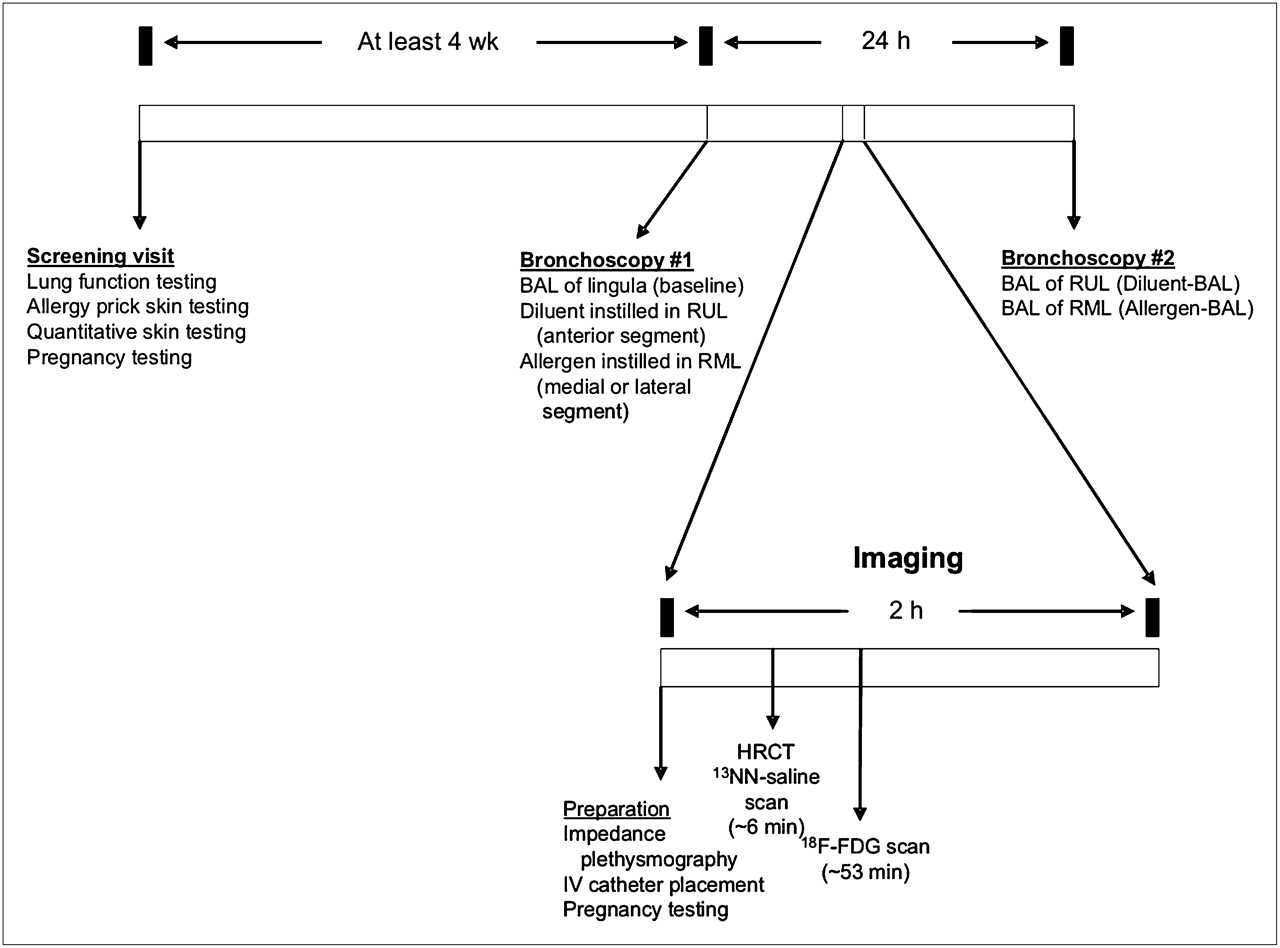
- FIGURE 1.
Protocol schema. Screening visit identifies subjects with mild asthma who are atopic. During first bronchoscopy, BAL is performed in lingula (baseline), diluent is applied in RUL, and allergen is applied in RML. After approximately 10 h, subject undergoes HRCT scan and 2 PET scans: 13NN-saline and 18F-FDG emission. Next morning, subject undergoes second bronchoscopy, during which BAL is performed in RUL and RML. BAL fluid is sent for cellular analysis from lingula and from RUL and RML.
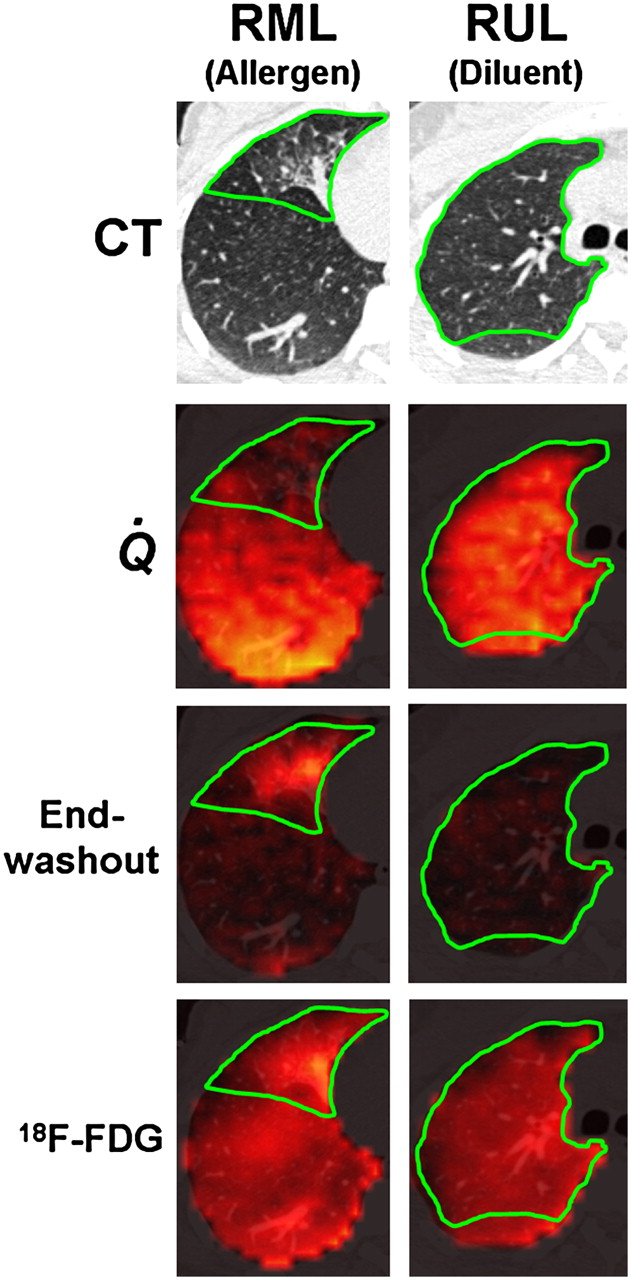
- FIGURE 2.
Example images. First row: Axial CT slice through RML and RUL, where allergen and diluent, respectively, were administered. Green border shows approximate location of RML and RUL. Second row: Fused perfusion images from 13NN-saline PET scan during breath-hold and CT. Perfusion is reduced in allergen region but normal in diluent region. Third row: Fused end-washout image from 13NN ventilation scan and CT. Ventilation-defective area in region of allergen challenge manifests as tracer retention at end of washout. In contrast, no residual tracer was present in diluent region by end of washout. Fourth row: 18F-FDG scan showing increased uptake in allergen region, compared with diluent region.
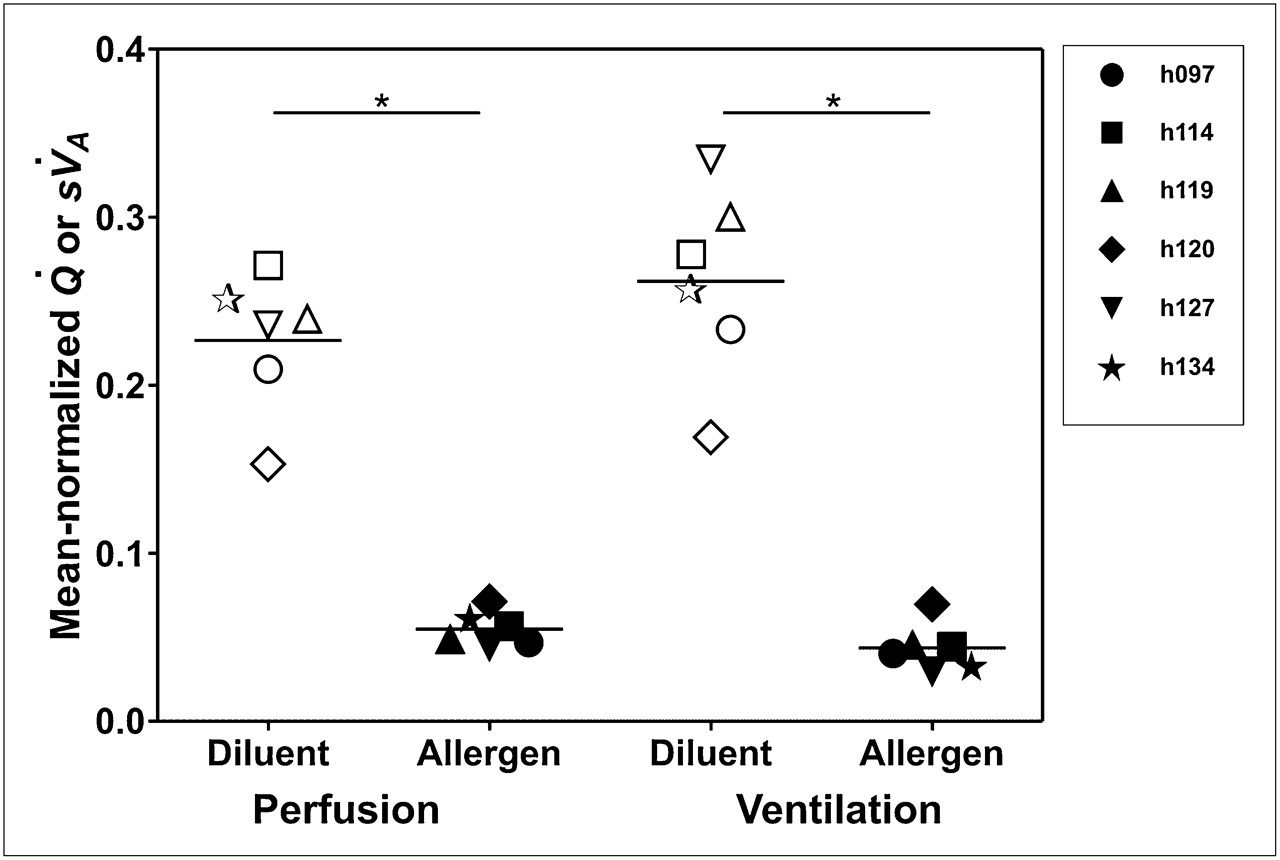
- FIGURE 3.
Perfusion and ventilation. Mean-normalized perfusion and ventilation are substantially lower in allergen-challenged region than in diluent region (*P < 0.001 for each comparison).
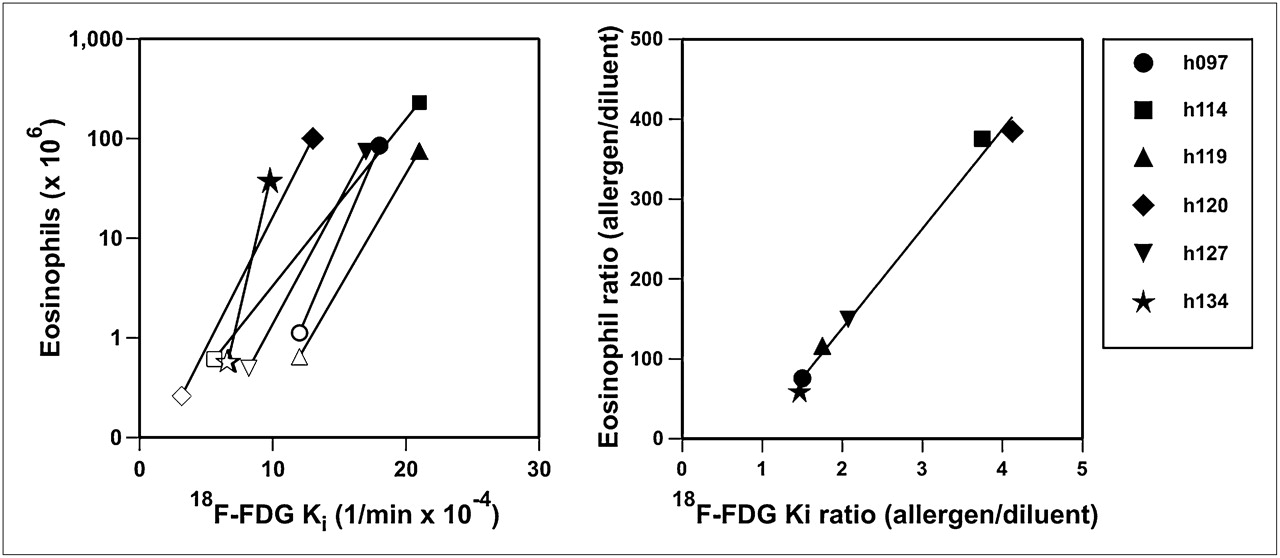
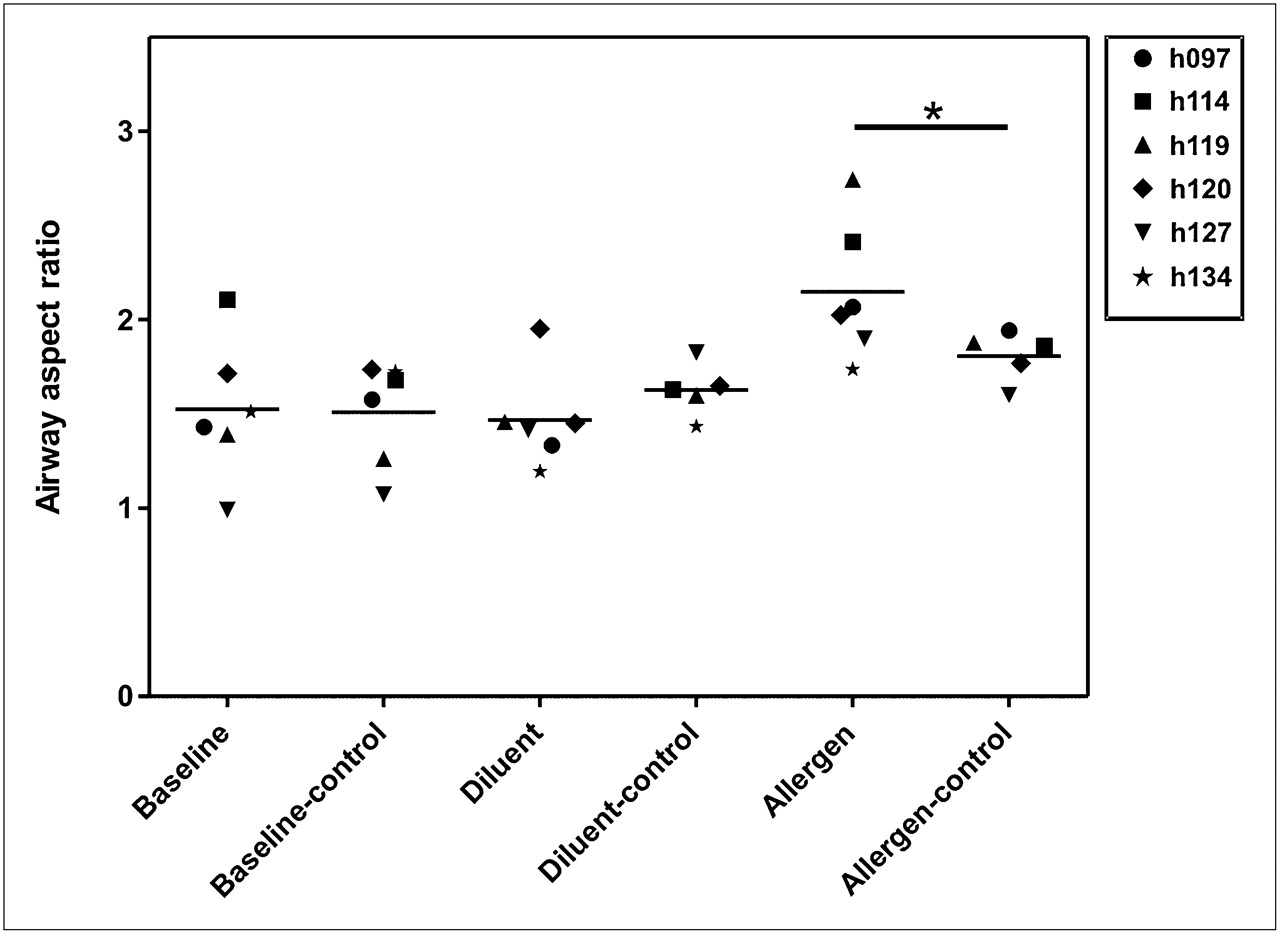
- FIGURE 4.
Airway response. Aspect ratio was calculated as average airway wall area divided by average total airway area. Because we had no baseline CT scan for comparison, we chose other airways of similar size (within 25%) and calculated their aspect ratio. These were used as control airways for comparison. Baseline (lingula) and diluent airways are similar in aspect ratio to other airways of similar size (baseline-control and diluent-control, respectively). Allergen-challenged airway has larger aspect ratio (meaning either thicker wall or smaller inner lumen or both) than other airways of similar size (allergen compared with allergen-control, P < 0.05).
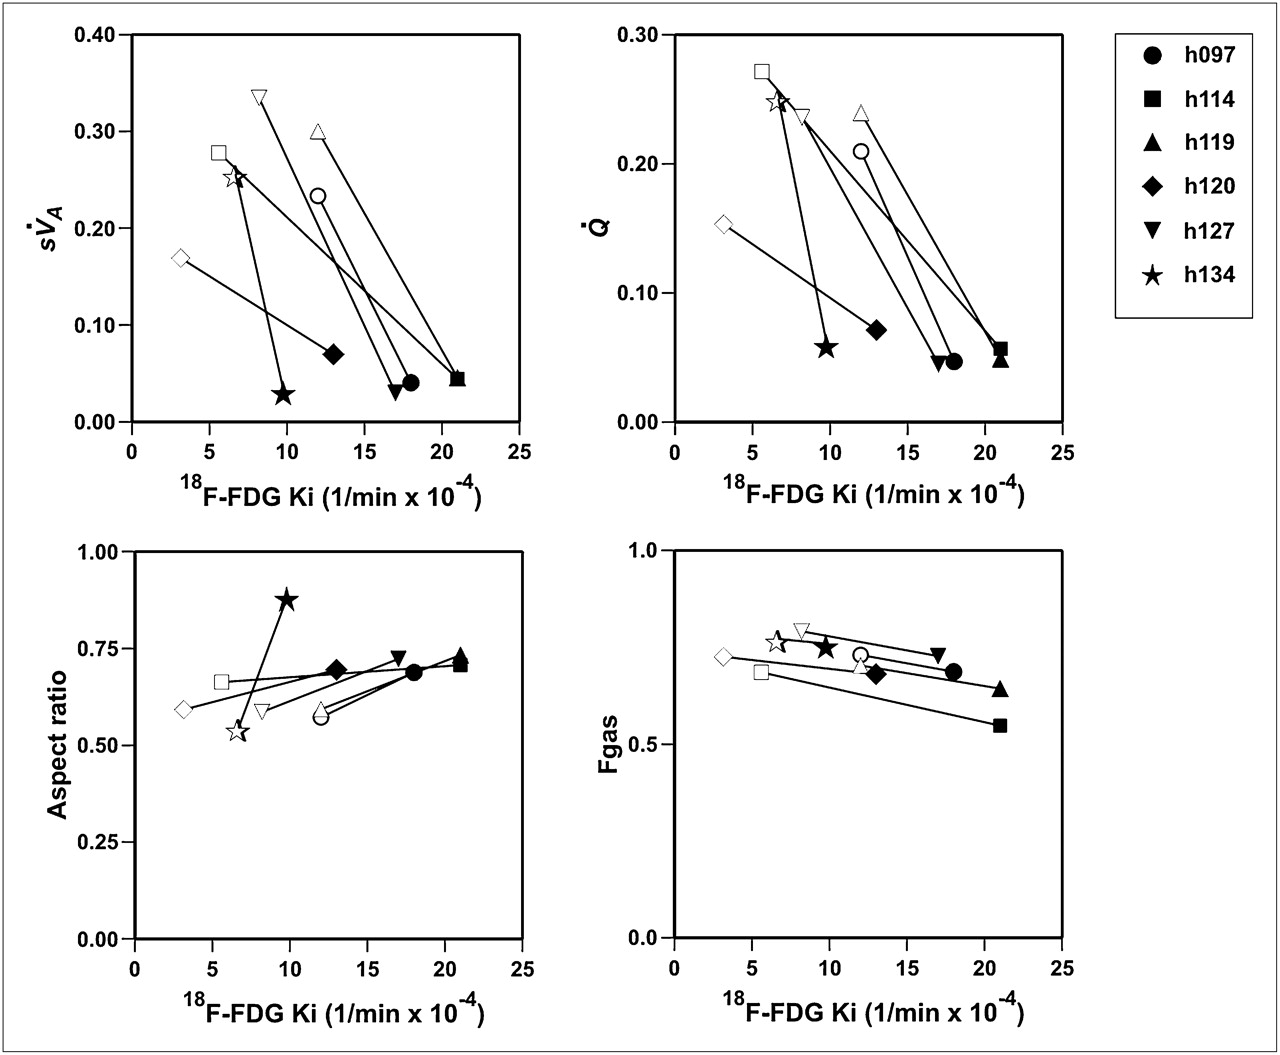
- FIGURE 5.
Functional variables vs. Ki. Clockwise from upper left:
 , , relative aspect ratio, and Fgas. Each symbol represents individual subject, with open symbols representing diluent and closed symbols allergen.
 - FIGURE 6.
Eosinophil count vs. Ki and eosinophil count ratio (allergen to diluent) vs. Ki ratio. Each subject is represented by different symbol. All subjects had increase in Ki and eosinophil count in allergen-challenged region (dark symbols), compared with diluent region (open symbols). Eosinophil count ratio was highly correlated (R2 = 0.9917, P < 0.001) with Ki ratio. Equation of regression line is eosinophil count ratio = 124 × Ki ratio − 110.


Tables
Subject Sex Age (y) BMI (kg/m2) FEV1 (L) FEV1 (%) FVC (L) FVC (%) FEV1/FVC h097 F 33 20.1 2.86 84 3.55 88 0.81 h114 F 29 35.0 2.02 72 3.15 74 0.64 h119 F 22 19.9 3.47 90 4.39 97 0.79 h120 F 20 23.3 3.74 98 4.41 99 0.85 h127 M 41 23.7 3.38 83 4.34 87 0.78 h134 F 29 23.3 2.90 87 3.63 93 0.80 Mean 29 24.2 3.06 86 3.91 90 0.78 SD 7.6 5.56 0.61 8.5 0.54 9.1 0.07 BMI = body mass index; FEV1 = forced expired volume in 1 s; FVC forced vital capacity
Ki (min−1 × 10⁻⁴) Subject Allergen Dose (BAU) Diluent Allergen h097 DP 500 12.00 18.00 h114 DP 41 5.60 21.00 h119 DF 13.7 12.00 21.00 h120 Cat 123 3.15 13.00 h127 DF 500 8.20 17.00 h134 DP 500 6.68 9.79 Mean 7.94 16.63* SD 3.55 4.48 BAU = bioequivalent allergy units; DP = Dermatophagoides pteronyssinus; DF = Dermatophagoides farinae.
↵* P < 0.05 compared with diluent.
Supplemental Data
Files in this Data Supplement:


Jump to section
Related Articles
Cited By...
- Consensus Recommendations on the Use of 18F-FDG PET/CT in Lung Disease
- Measuring lung function in airways diseases: current and emerging techniques
- Quantification of Lung PET Images: Challenges and Opportunities
- Imaging Pulmonary Inflammation
- Molecular Imaging of Inflammation: Current Status
- 18F-FDG Uptake to Assess Eosinophilic Inflammation in Asthma: Would SUV at Late Imaging Be Relevant?
- Reply: 18F-FDG Uptake to Assess Eosinophilic Inflammation in Asthma: Would SUV at Late Imaging Be Relevant?