


In the article “18F-FDG Uptake Rate Is a Biomarker of Eosinophilic Inflammation and Airway Response in Asthma,” by Harris et al. (J Nucl Med. 2011;52:1713–1720), Figures 3, 4, and 5 (top panels only) contain incorrectly computed data. The absolute values of mean-normalized ventilation and perfusion presented in Figures 3 and 5 were incorrect; however, the statistical findings are unchanged. In addition, the airway aspect ratio data in Figure 4 was not calculated as stated in the “Materials and Methods” section but as airway wall area/airway lumen area. The corrected airway aspect ratios were no longer significantly different between the allergen and allergen-control airways. It follows that the sentence on page 1716 should read, “The ω of the allergen-challenged bronchus was elevated by about 6%, compared with that measured in airways of similar size from other regions in the lung (Fig. 4).”
Despite these errors, the main conclusions have not changed. In the discussion on page 1718 we stated, “In this study, the increased airway wall aspect ratio in the allergen-challenged airway compared with other airways of similar luminal size suggests that the allergen-challenged airway either constricted or its wall thickened, or most likely both (Fig. 4). However, the increase in airway resistance caused by the degree of luminal narrowing in just that airway cannot be sufficient to account for the dramatic reduction in  of the allergen-challenged lobe.” In the original paper, ω of the allergen-challenged bronchus was elevated by about 8% (statistically significant), whereas the new calculation brings it to 6% (not statistically significant). Although the statistics changed, the conclusions have not.
Corrected versions of Figure 3, 4 (with updated figure legend), and 5 appear below; the authors sincerely regret these errors.
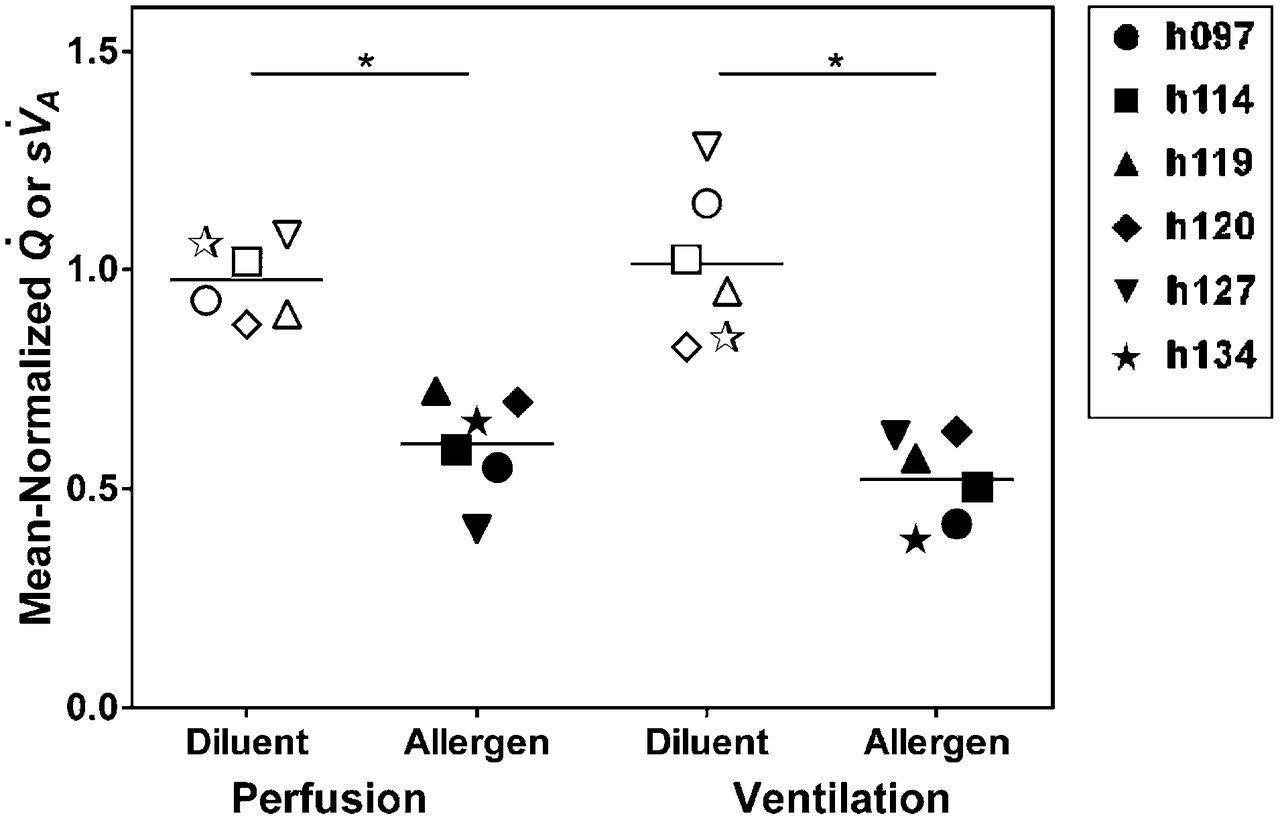
Perfusion and ventilation. Mean-normalized perfusion and ventilation are substantially lower in allergen-challenged region than in diluent region (*P < 0.001 for each comparison).
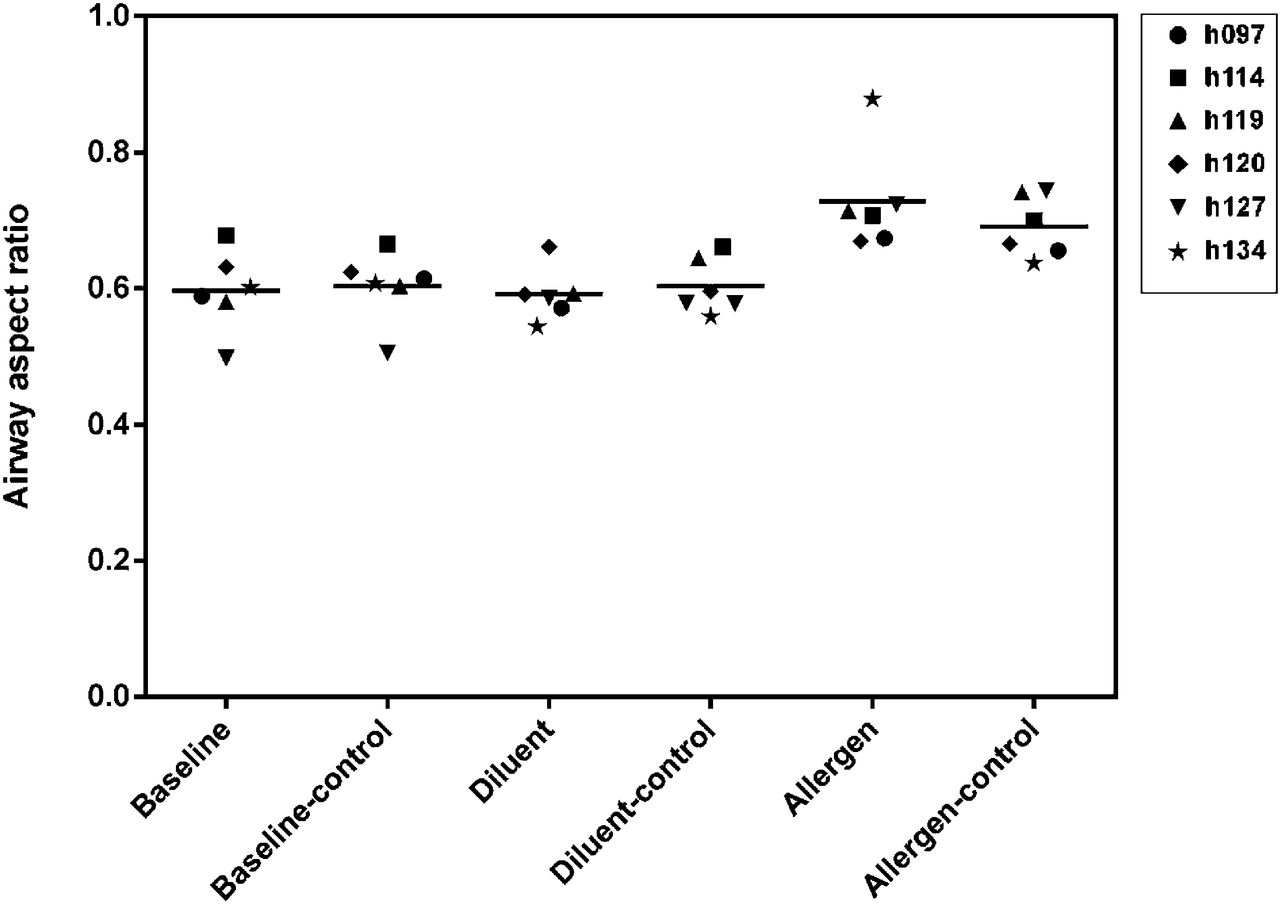
Airway response. Aspect ratio was calculated as average airway wall area divided by average total airway area. Because we had no baseline CT scan for comparison, we chose other airways of similar size (within 25%) and calculated their aspect ratio. These were used as control airways for comparison. Baseline (lingula) and diluent airways are similar in aspect ratio to other airways of similar size (baseline-control and diluent-control, respectively). Overall, allergen-challenged airways tended to have a larger aspect ratio (meaning either thicker wall or smaller inner lumen or both) than other airways of similar size (allergen compared with allergen-control).
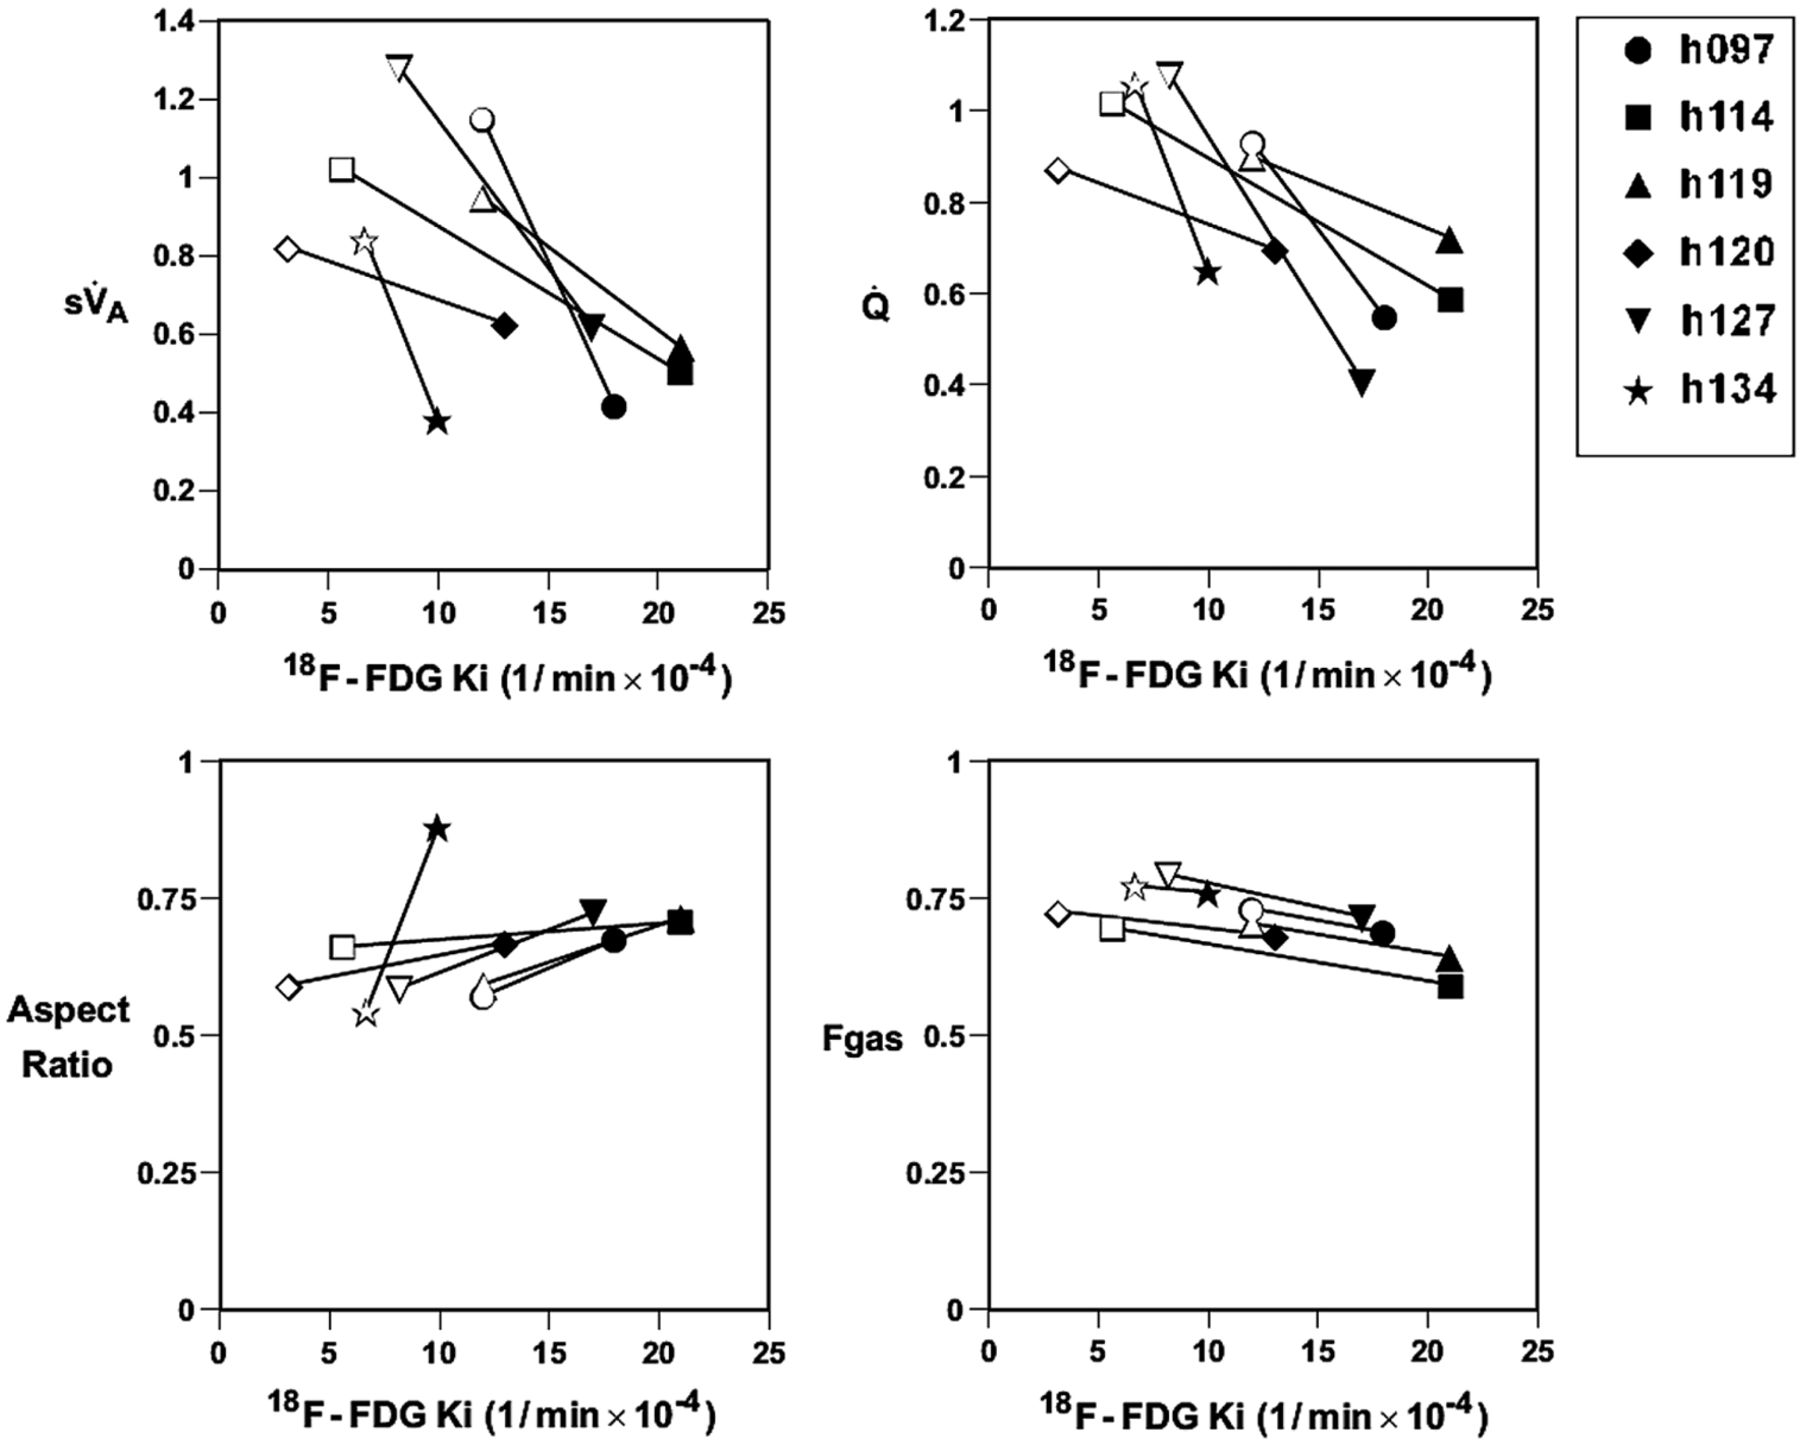
Functional variables vs. Ki. Clockwise from upper left: mean-normalized  and
and  , Fgas, and relative aspect ratio. Each symbol represents individual subject, with open symbols representing diluent and closed symbols representing allergen.
- © 2014 by the Society of Nuclear Medicine and Molecular Imaging, Inc.


