


Abstract
The grade of histologic differentiation is one of the most important prognostic factors in patients with endometrial carcinoma and postoperative staging. The aim of this study was to investigate whether 16α-18F-fluoro-17β-estradiol (18F-FES) and 18F-FDG PET reflect clinicopathologic features in patients with endometrial tumors. Methods: A total of 22 patients with endometrial adenocarcinoma and 9 with endometrial hyperplasia (mean age, 56.0 ± 15.3 y) underwent 18F-FES PET for estrogen receptor imaging and 18F-FDG PET. Regional values of tracer uptake were evaluated using standardized uptake value (SUV) and the SUV ratio of 18F-FDG to 18F-FES. The accuracy for predicting tumor aggressiveness defined as high-risk carcinoma (International Federation of Gynecology and Obstetrics [FIGO] stage ≥ Ic or histologic grade ≥ 2), low-risk carcinoma (FIGO stage ≤ Ib and grade 1), and hyperplasia was compared for each PET parameter using receiver-operating-characteristic (ROC) analysis. The diagnostic accuracy of MRI findings for clinical staging was also compared. Results: Although the SUV for 18F-FDG was significantly lower in endometrial hyperplasia than in carcinoma, a significant difference between high-risk and low-risk carcinoma was observed only in SUV for 18F-FES. High-risk carcinoma showed a significantly greater 18F-FDG–to–18F-FES ratio (3.6 ± 2.1) than did low-risk carcinoma (1.3 ± 0.5, P < 0.01) and hyperplasia (0.3 ± 0.1, P < 0.005). Low-risk carcinoma showed a significantly higher 18F-FDG–to–18F-FES ratio than hyperplasia (P < 0.0001). In ROC analysis, the most accurate diagnostic PET parameter for predicting high-risk and low-risk carcinoma was the 18F-FDG–to–18F-FES ratio. The optimal 18F-FDG/18F-FES cutoff value of 2.0, determined by ROC analysis, revealed 73% sensitivity, 100% specificity, and 86% accuracy, which was better than the 77% accuracy for MRI. The 18F-FDG–to–18F-FES ratio of 0.5 yielded a correct diagnosis for carcinoma from hyperplasia with 100% accuracy. Conclusion: Endometrial carcinoma reduces estrogen dependency with accelerated glucose metabolism as it progresses to a higher stage or grade. 18F-FES and 18F-FDG PET studies provide a new index of the 18F-FDG–to–18F-FES ratio, which is considered the most informative index reflecting tumor aggressiveness. This index will be useful for making noninvasive diagnoses and deciding the appropriate therapeutic strategy for patients with endometrial carcinoma.
Endometrial carcinoma is a highly prevalent gynecologic malignancy and one of the most common female malignant tumors in Western countries, including the United States, and in Japan (1,2). Early-stage endometrial carcinoma shows a good prognosis, and the 5-y survival rate is reported to be more than 90% in patients with stage Ia or Ib determined by the International Federation of Gynecology and Obstetrics (FIGO) classifications (3–5). On the other hand, patients with advanced disease have a significantly worse survival. Up to 20% of those with endometrial carcinoma relapse and eventually die of their disease. Previous studies suggested that the most important prognostic factors in endometrial carcinoma were the surgical FIGO stage, myometrial invasion, histologic type, and differentiation grade (6–10). A noninvasive diagnostic method to evaluate tumor aggressiveness and pathologic features would be useful for deciding the therapeutic strategy and predicting prognosis in patients with endometrial carcinoma.
We previously reported that estrogen receptor (ER) expression coupled with glucose metabolism using 16α-18F-fluoro-17β-estradiol (FES) and 18F-FDG PET is useful for the differential diagnosis of benign and malignant uterine tumors (11). ER expression and glucose metabolism of uterine tumors showed opposite tendencies (i.e., high glucose metabolism and low ER expression in malignant tumors and low glucose metabolism and high ER expression in benign tumors). The purpose of the present study was to investigate whether regional accumulation of 18F-FES and 18F-FDG and the uptake ratio of 18F-FDG to 18F-FES correlate with the aggressiveness of endometrial tumors in terms of stage and pathologic findings.
MATERIALS AND METHODS
Patients
Thirty-one patients (mean age, 56.0 ± 15.3 y) with endometrial thickening or suspected malignant tumors at cytologic analysis, ultrasonography, or MRI participated in this study. None of the patients received any biopsy or treatment before PET and MRI studies. Definitive diagnosis was determined by postoperative histopathologic analysis (n = 25) or whole-endometrium curettage (n = 6). Final diagnoses were endometrial adenocarcinoma (n = 22) and hyperplasia (n = 9) (Table 1). All 6 cases determined by whole-endometrium curettage were endometrial hyperplasia. In surgically staged patients, the final stage and grade were decided by findings at hysterectomy. The staging, histology, and grading criteria were based on the 1988 FIGO staging classification (3). The results for 9 patients with endometrial carcinoma and 4 patients with hyperplasia were previously reported in our recent study (11). This study was approved by the institutional review board of the University of Fukui Hospital. Written informed consent was obtained from all patients studied.
Patient Characteristics
PET Procedures
All patients underwent preoperative PET scans with 18F-FES and 18F-FDG to compare differences in tracer accumulation. Two scans were obtained on 2 separate days within 1 wk in random sequence. We used a whole-body tomograph (Advance; GE Healthcare) that permits the simultaneous acquisition of 35 image slices in a 2-dimensional acquisition mode, with interslice spacing of 4.25 mm. Performance tests showed the intrinsic resolution of the scanner to be 4.0–5.3 mm in the axial direction and 4.6–5.7 mm in the transaxial direction.
18F-FES was synthesized using a method reported elsewhere (12,13). The specific activity was 100–200 GBq/μmol, and radiochemical purity was greater than 99%. For each 18F-FES and 18F-FDG PET study, approximately 185 MBq of tracer were administered via the antecubital vein. Before the tracer administration of each study, patients fasted at least 4 h to avoid elevation of blood sugar levels in 18F-FDG PET and to reduce tracer excretion to the intestines in 18F-FES PET. Fifty minutes after the tracer injection, the patient was positioned supine in the PET scanner, and a 16-min emission scan was started, with 3-min scans at the pelvic region (2 bed positions) and 2-min scans in each remaining region (5 bed positions) to completely cover the head to inguinal regions. Postinjection transmission scans of 2 min at the pelvis and 1 min in other areas were obtained after the emission scans using a 68Ge/68Ga rod source for attenuation correction. The PET data were reconstructed by the iterative method, with selection of 14 subsets and 2 iterations. The reconstructed images were then converted to a semiquantitative image corrected by the injection dose and the patient's body weight (standardized uptake value [SUV]) for data analysis.
MRI Scans and SUV Measurements
All patients underwent MRI during the time between the 2 PET examinations, or within 1 wk from them, for diagnosis and to obtain anatomic information about the pelvic organs. T1- and T2-weighted images in the axial, sagittal, and coronal planes were acquired with a 1.5-T superconducting MRI system (Signa; GE Healthcare). The repetition and echo times for T1- and T2-weighted images were 533 and 8 ms and 4,700 and 90 ms, respectively. Contrast-enhanced MRI was performed with or without fat saturation in the axial and sagittal planes after the injection of gadolinium diethylenetriamine pentaacetic acid (0.1 mmol/kg). Staging of the tumors based on MRI findings was performed by board-certified radiologists as follows: intact junctional zone on T2-weighted MR images and superficial myometrial invasion (no more than half) on T2- and contrast T1-weighted images were regarded as early stages and deep myometrial invasion (more than half), cervical involvement, and pelvic lymphadenopathy as advanced stages.
Circular regions of interest (ROIs) with a fixed size of 8 mm in diameter were drawn on the lesions to obtain the local SUV. Individual MR images were referenced for placement of ROIs in the appropriate region after PET and MR images were coregistered (Body Guide; Advance Biologic Co.). ROIs were placed on the resliced MRI sections after coregistration of 3 images in each patient and the same ROIs were applied to the 18F-FES and 18F-FDG PET images. Sagittal or coronal planes (2 or 3) of 6-mm thickness were used to obtain SUV at the center of the lesion. A single section at the center of the lesion was used when the lesion was small and substantial partial-volume effects on the mean SUV were expected. SUVs for each patient were averaged in 18F-FDG and 18F-FES PET images. The mean SUV ratio of 18F-FDG to 18F-FES for each lesion was also calculated.
Data Analysis
All patients were divided into 3 groups. The first group was high-risk endometrial carcinoma with FIGO stage higher than Ib or histologic grade higher than grade 1. The second group was low-risk carcinoma with FIGO stage Ib or Ia and histologic grade 1. The third group was endometrial hyperplasia. SUVs for 18F-FDG and 18F-FES and the 18F-FDG–to–18F-FES ratio were compared among the 3 groups by 1-way ANOVA with a post hoc Games–Howell test, which has robustness for analysis even in unequal variance. Differences in tracer accumulation were also compared between the 2 tracers using a paired t test. Statistical analysis was performed using a software package (SPSS for Microsoft Windows, version 11.5.1 J; SPSS Inc.).
Receiver-operating-characteristic (ROC) analysis was performed to determine diagnostic accuracy and the optimal cutoff value to differentiate high- versus low-risk groups and low-risk versus hyperplasia groups using MedCalc (version 7.6.0.0; MedCalc Software). The area under the ROC curve (AUC) provided a measure for the accuracy of a diagnostic test by PET parameters. The diagnostic accuracy of MRI, compared with postoperative definitive diagnosis, was evaluated by an ability to distinguish carcinoma in advanced stages (FIGO stage ≥ Ic) from early stages (FIGO stage ≤ Ib) irrespective of histologic grade. The accuracy of MRI findings and PET parameters was also compared using the McNemar test. A probability value of less than 0.05 was considered to indicate a significant difference.
RESULTS
SUVs and Ratio
Table 1 summarizes patient characteristics including tumor stage and lesion size. Thirteen patients were premenopausal and 18 were postmenopausal. The mean SUVs and 18F-FDG–to–18F-FES ratios for each group are given in Table 2. Patients with high-risk endometrial carcinoma showed a significantly higher accumulation of 18F-FDG than 18F-FES (P < 0.0001, paired t test), whereas patients with low-risk carcinoma did not show a significant difference between 18F-FDG and 18F-FES uptake. In contrast, endometrial hyperplasia showed a significantly higher uptake for 18F-FES than 18F-FDG (P < 0.005) in the primary tumors. Figure 1 shows the tendencies toward an increase in 18F-FDG uptake and a decrease in 18F-FES as disease progressed to a higher stage or histologic grade. 18F-FDG accumulation was not significantly different between high-risk and low-risk endometrial carcinoma, although hyperplasia showed significantly lower 18F-FDG accumulation than did high-risk (P < 0.0001) and low-risk (P < 0.005) carcinoma. 18F-FES PET showed a significant difference between these 2 groups of carcinoma (P < 0.05). In Figure 2, high-risk carcinoma showed a significantly greater 18F-FDG–to–18F-FES ratio than did low-risk carcinoma (P < 0.01) and endometrial hyperplasia (P < 0.005). Low-risk carcinoma also showed a significantly higher 18F-FDG–to–18F-FES ratio than hyperplasia (P < 0.0001).

Box-and-whisker plots of uptake of each tracer among 3 groups. Horizontal bars inside boxes indicate median values. Error bars indicate farthest points that are not outliers. Significant differences in 18F-FDG accumulation were observed between hyperplasia and high-risk (P < 0.0001) or low-risk (P < 0.005) endometrial carcinoma. 18F-FDG accumulation was not significantly different between high-risk and low-risk carcinoma, although 18F-FES PET showed significant difference between these 2 groups (P < 0.05). High-R = high-risk carcinoma; low-R = low-risk carcinoma; NS = not significant.
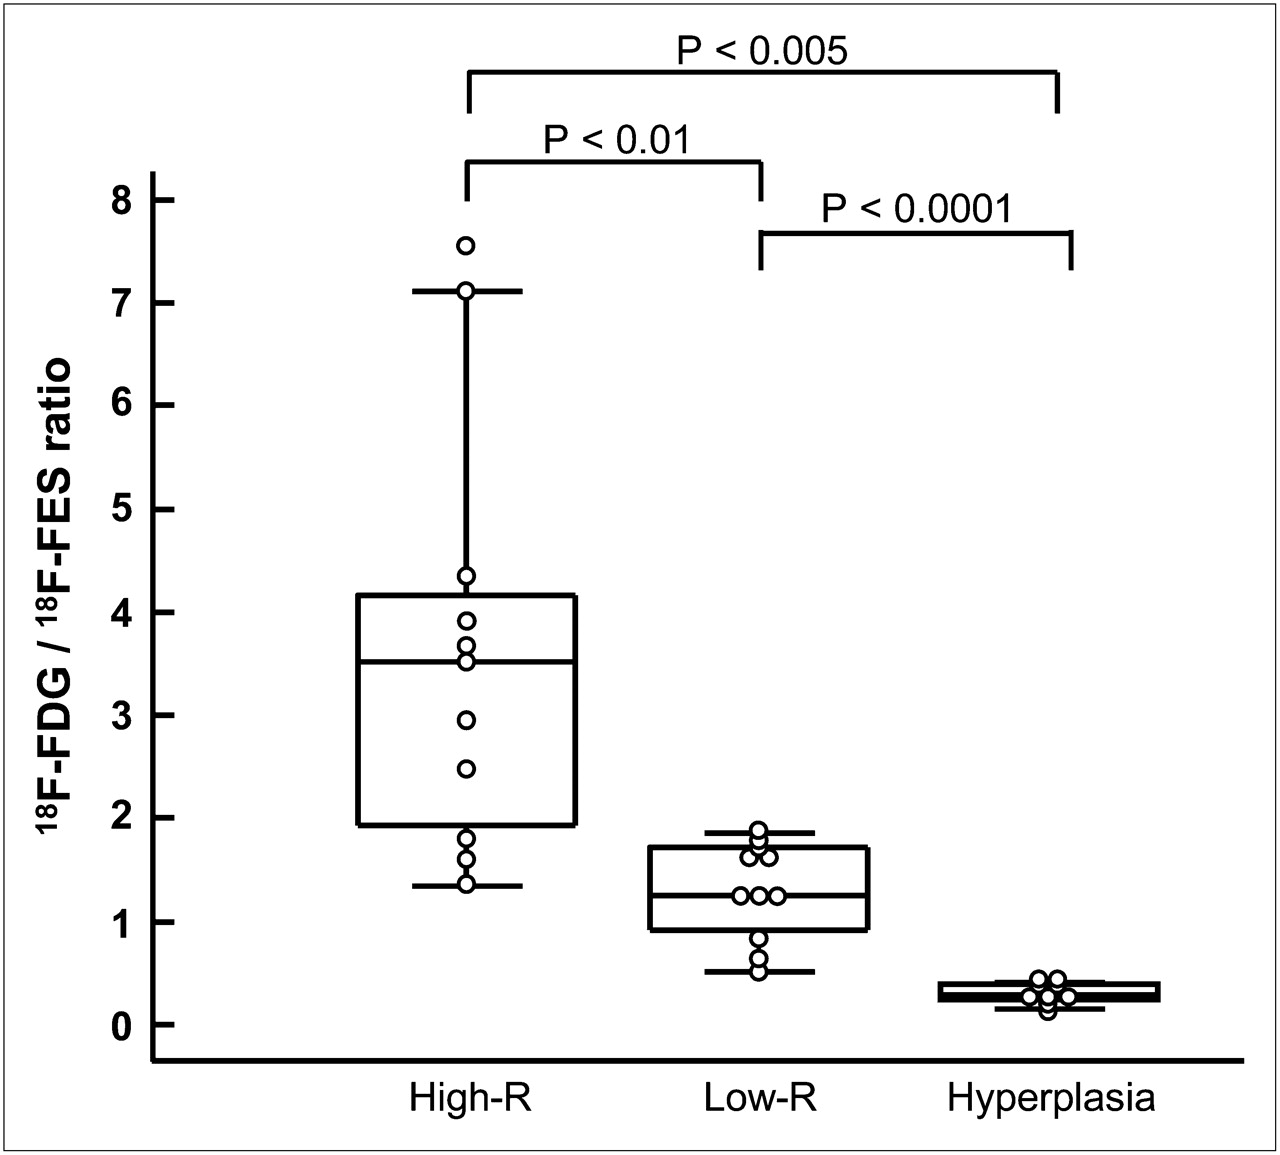
Box-and-whisker plots of 18F-FDG–to–18F-FES SUV ratio among 3 groups. Significant differences were observed between high-risk and low-risk carcinoma (P < 0.01), between high-risk carcinoma and hyperplasia (P < 0.005), and between low-risk carcinoma and hyperplasia (P < 0.0001). High-R = high-risk carcinoma; low-R = low-risk carcinoma.
Regional SUVs and 18F-FDG–to–18F-FES SUV Ratio
ROC Analysis and Comparison with MRI
AUCs obtained from ROC analysis for distinction of high- and low-risk carcinoma were 0.90, 0.81, and 0.72 for the 18F-FDG–to–18F-FES ratio, 18F-FES SUV, and 18F-FDG SUV, respectively, indicating that the 18F-FDG–to–18F-FES ratio is the most informative index for differentiating aggressiveness of carcinoma although no significant difference was observed in AUCs by the z test. Table 3 shows the diagnostic accuracy for the 3 PET parameters and MRI findings for distinction of high-risk from low-risk carcinoma. ROC analysis determined the optimal cutoff value for each PET parameter to distinguish high- and low-risk carcinoma. The optimal 18F-FDG–to–18F-FES cutoff ratio of 2.0 provided 73% sensitivity and 100% specificity, which yielded the greatest accuracy of 86% among all PET parameters and MRI. Because all lesions of endometrial hyperplasia showed a low 18F-FDG–to–18F-FES ratio of less than 0.5, a cutoff ratio of 0.5 could distinguish all cases of low-risk carcinoma from hyperplasia correctly, yielding no false-positive findings and 100% accuracy. A cutoff 18F-FDG SUV of 2.0 also differentiated malignant tumors from benign lesions (Fig. 1). The accuracies of PET parameters and MRI findings were statistically compared, and a significant difference was observed between the 18F-FDG–to–18F-FES ratio and 18F-FDG SUV (P < 0.005, McNemar test).
Diagnostic Accuracy in Differentiating High- and Low-Risk Carcinoma
Representative Cases
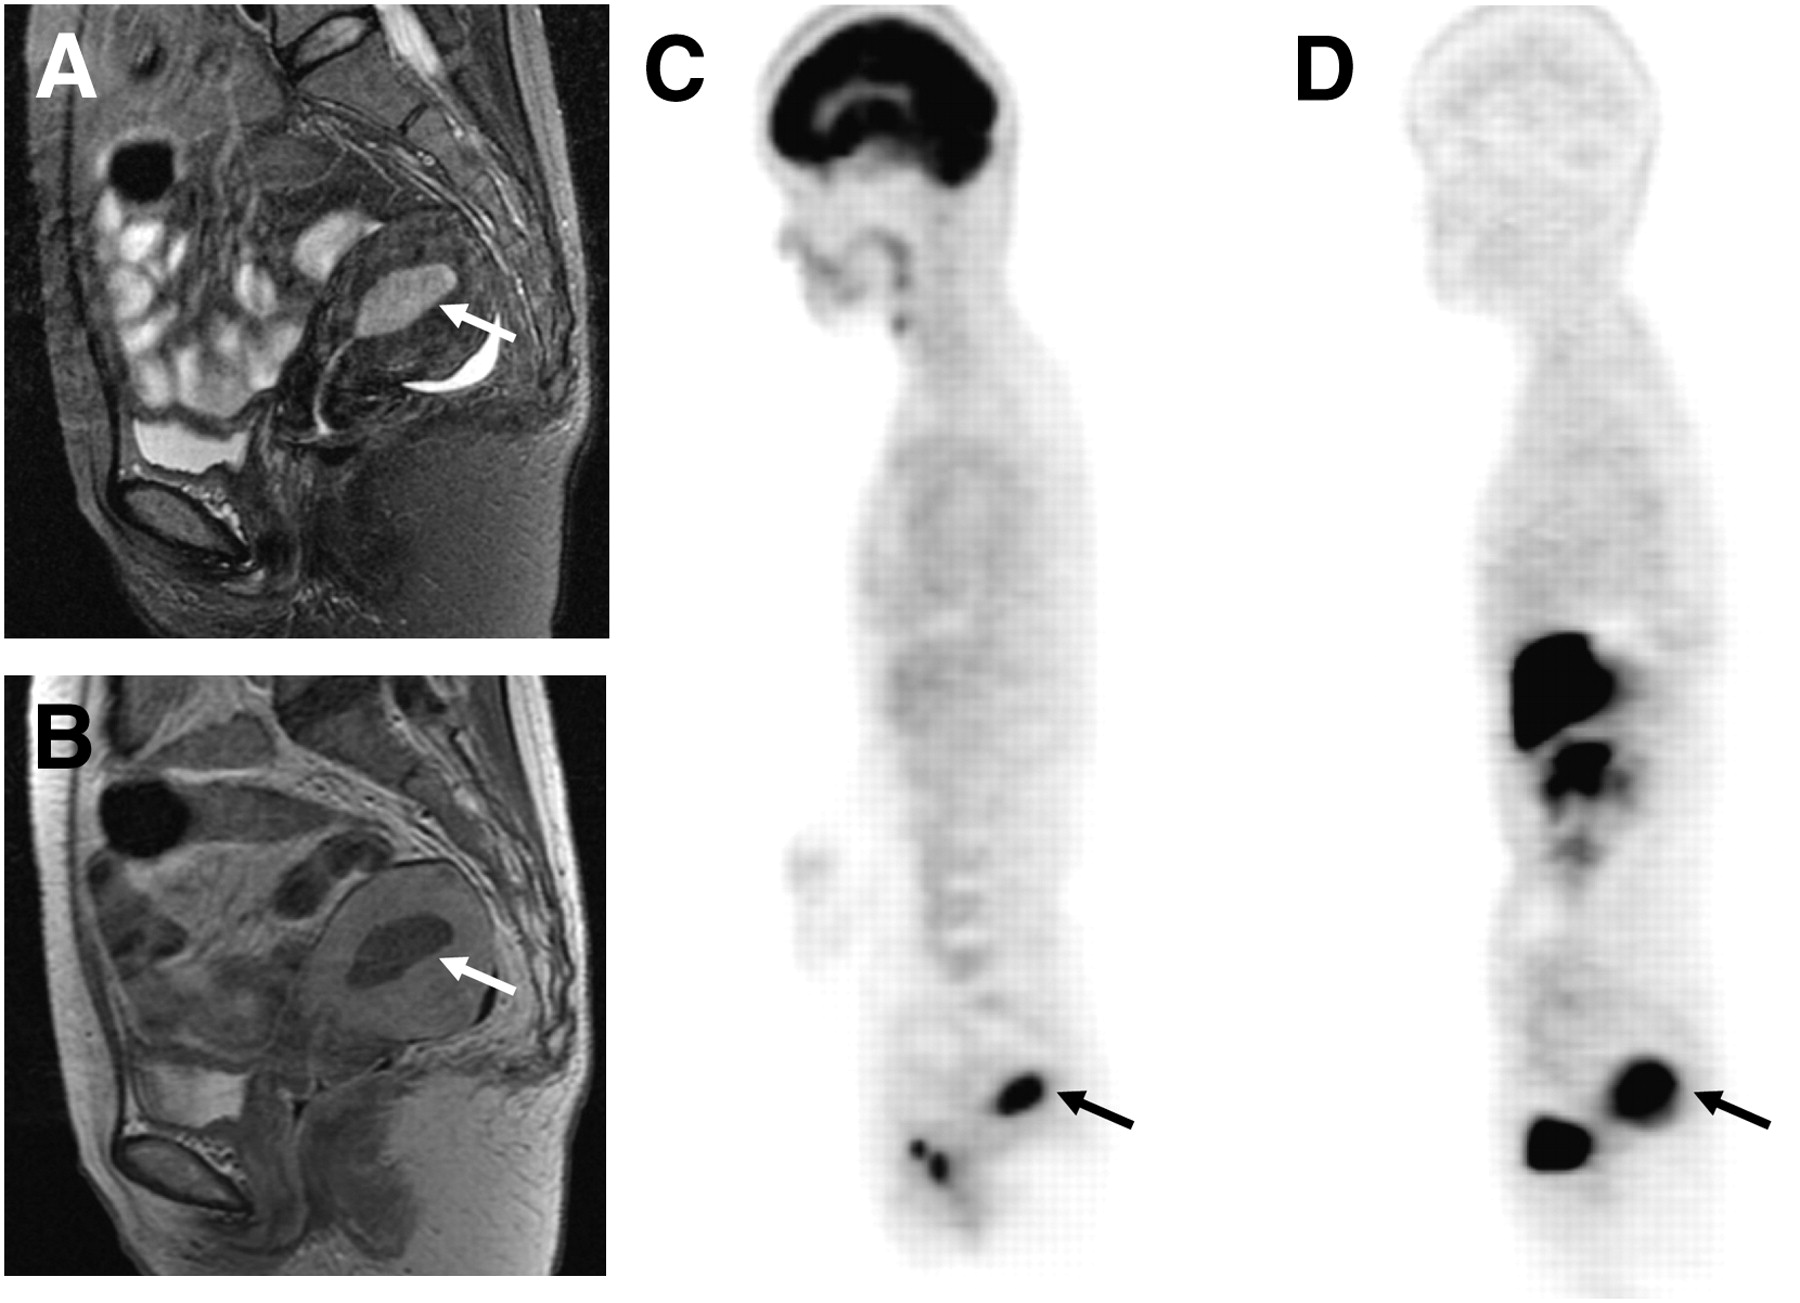
Representative images of each group are given in Figures 3–5⇓⇓. Figure 3 shows high-risk endometrial carcinoma (FIGO stage Ic, histologic grade 2). MRI findings suggested no myometrial invasion (stage Ia), and PET images showed high 18F-FDG and moderate 18F-FES accumulation in the primary tumor, with an 18F-FDG–to–18F-FES ratio of 2.5, indicating high-risk carcinoma. Figure 4 is a case of low-risk endometrial carcinoma (FIGO stage Ib, histologic grade 1) showing high 18F-FDG and 18F-FES uptake with an 18F-FDG–to–18F-FES ratio of 1.3. MRI also indicated early-stage endometrial carcinoma with superficial myometrial invasion (Ib). Endometrial hyperplasia had a high level of 18F-FES accumulation corresponding to the thickening of endometrium on MRI (Fig. 5). The 18F-FDG–to–18F-FES ratio of this patient was 0.2.
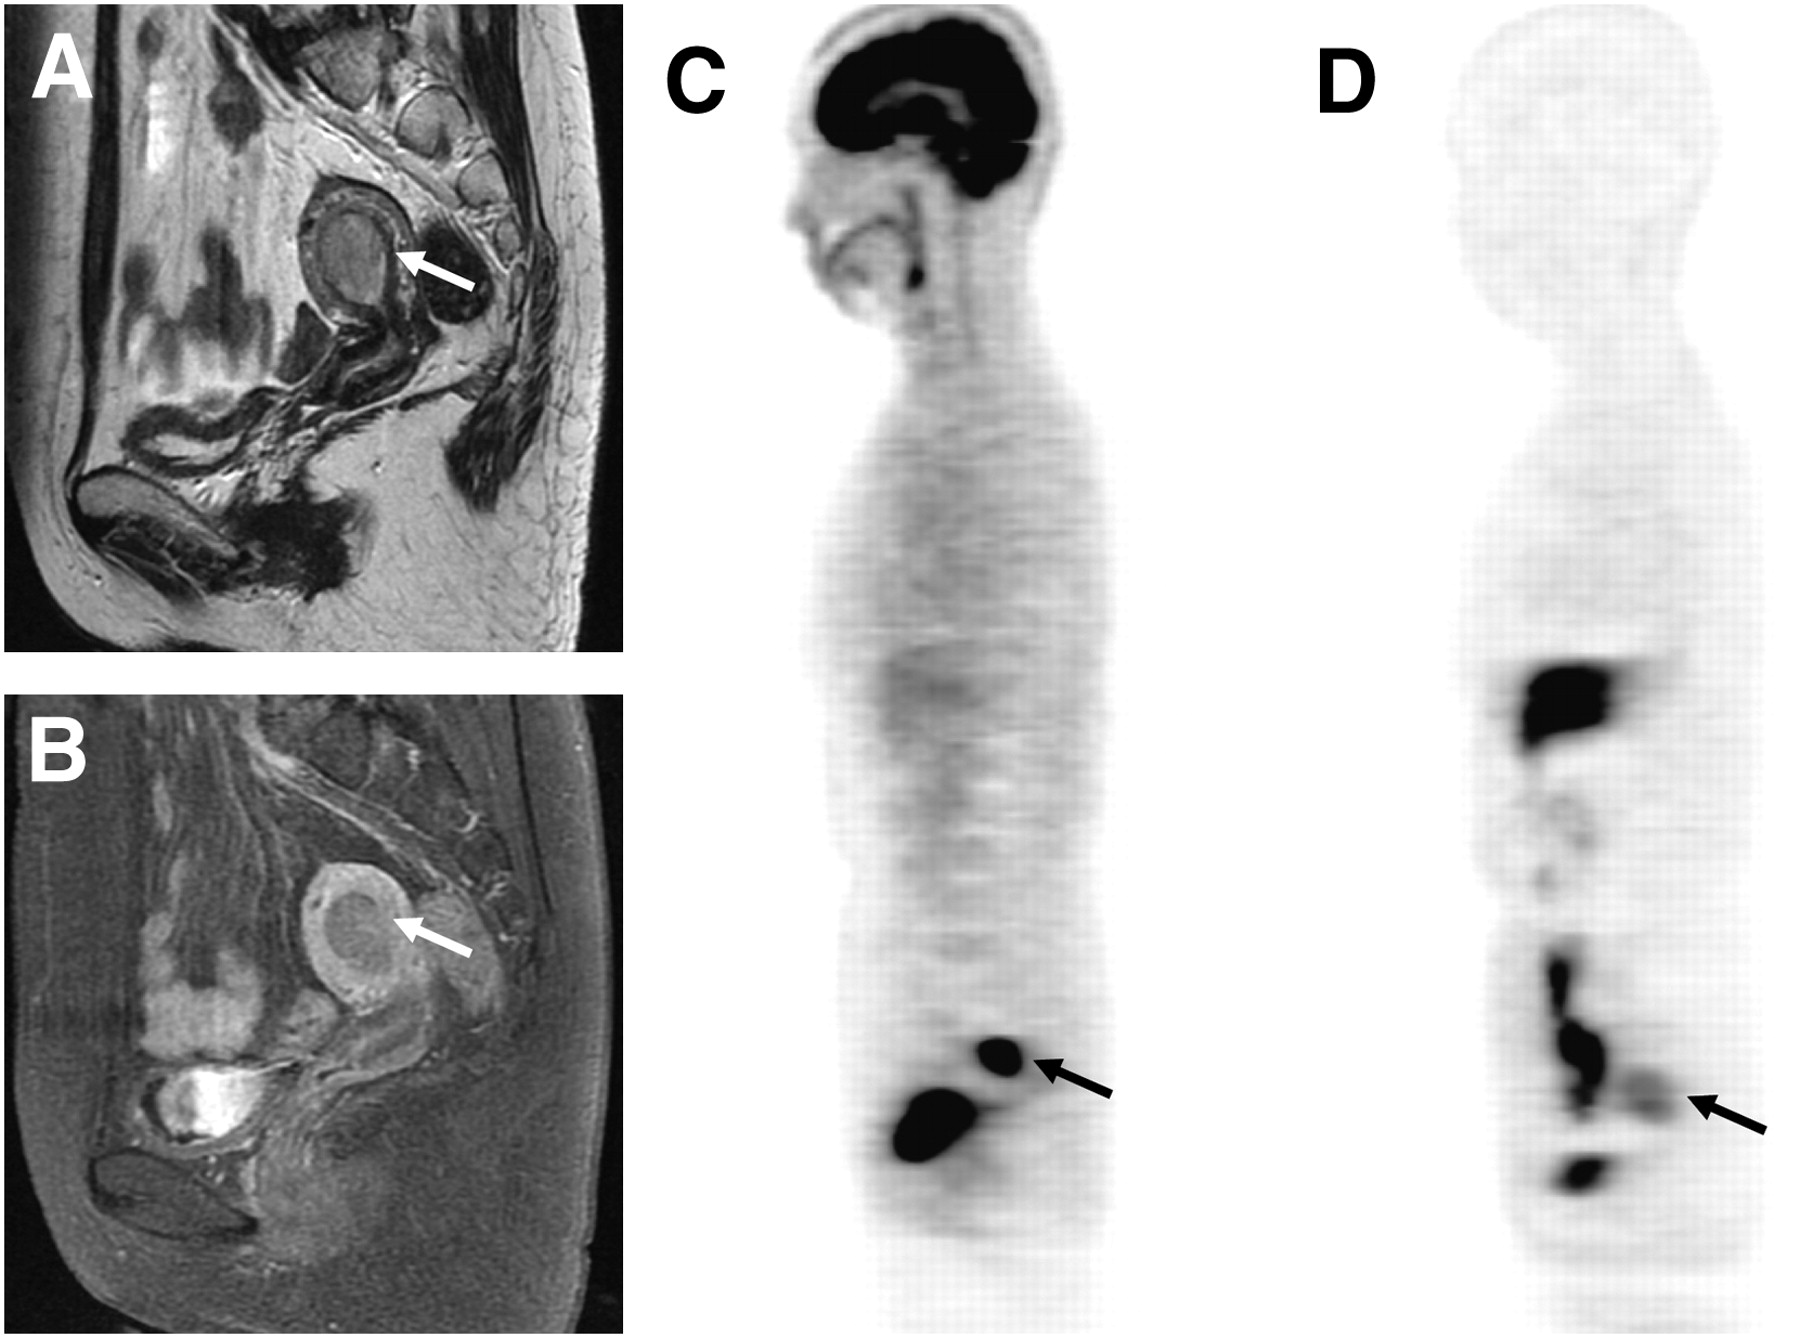
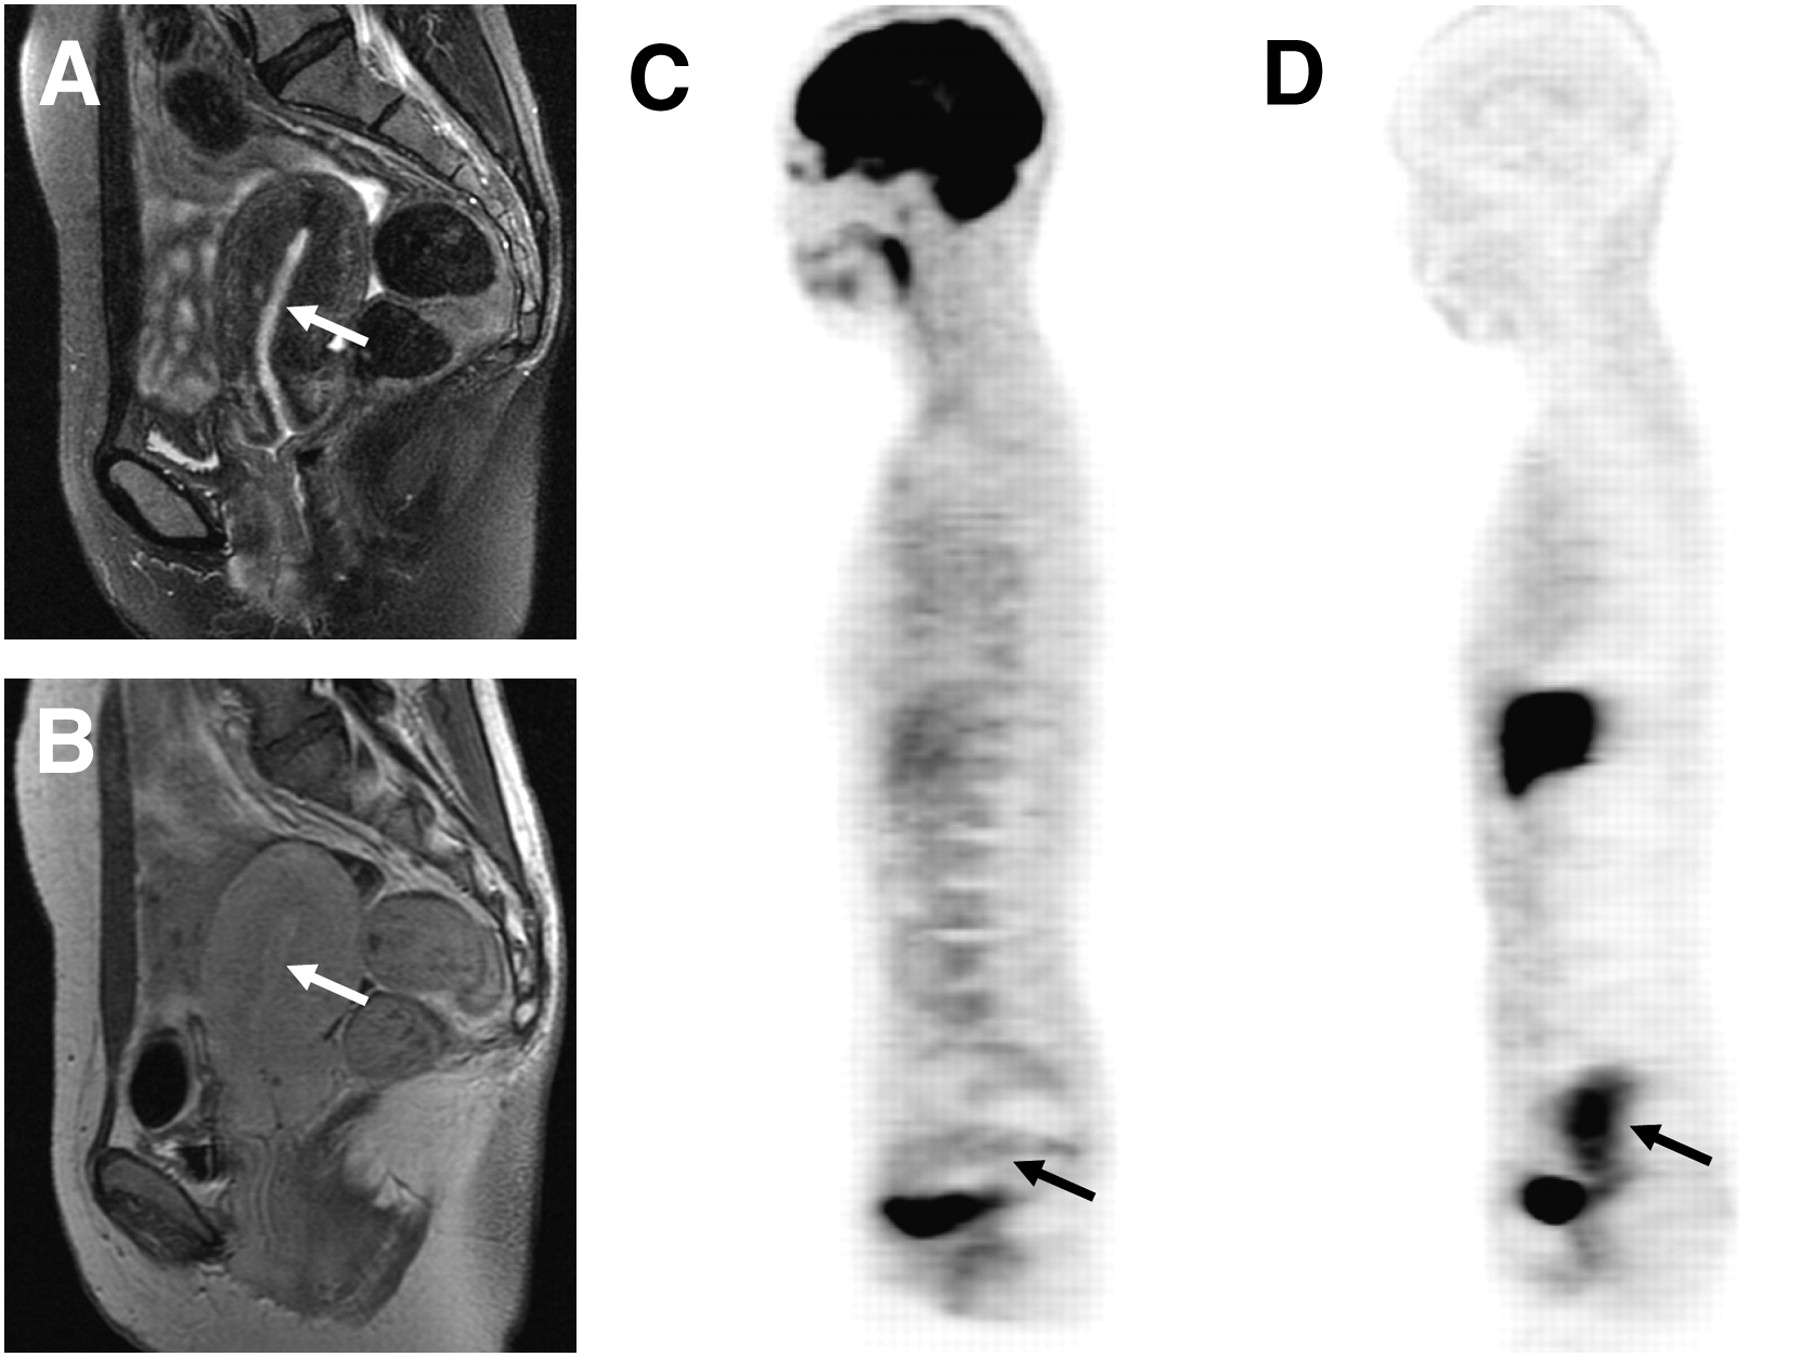
T2-weighted (A), contrast-enhanced T1-weighted MR (B), 18F-FDG (C), and 18F-FES PET (D) images of 60-y-old woman with endometrial carcinoma (arrows). PET images showed intense 18F-FDG uptake (SUV, 11.6) and moderate 18F-FES uptake (SUV, 4.7) in tumor. Preoperative staging by MRI suggested no myometrial invasion, whereas PET findings with an 18F-FDG–to–18F-FES ratio of 2.5 indicated high-risk carcinoma. Postoperative histopathologic result was high-risk carcinoma with FIGO stage Ic and histologic grade 2.

Sagittal T2-weighted (A), contrast-enhanced T1-weighted MR (B), 18F-FDG (C), and 18F-FES PET (D) images of 50-y-old woman with low-risk endometrial carcinoma (FIGO stage Ib and histologic grade 1, arrows). PET images showed intense accumulation for both tracers in endometrial lesion. Region of 18F-FES uptake (SUV, 8.1) appeared larger than that of 18F-FDG (SUV, 10.2) because of 18F-FES avidity in myometrial inner layer. 18F-FDG–to–18F-FES ratio was 1.3.

A 39-y-old woman who had endometrial hyperplasia with relatively low intensity on sagittal T2-weighted (A) and contrast-enhanced T1-weighted (B) MR images (arrows). PET images showed low 18F-FDG (SUV, 1.4) (C) and high 18F-FES (SUV, 5.9) (D) accumulation in endometrial lesion of uterus. 18F-FDG–to–18F-FES ratio was 0.2.
DISCUSSION
Our recent PET study using 18F-FES and 18F-FDG revealed that uterine tumors had opposite tendencies in terms of 18F-FES and 18F-FDG accumulation, which represents ER expression and glucose metabolism, between benign and malignant lesions (11). Thus, PET studies with the 2 tracers were useful to provide pathophysiologic information for the differential diagnosis of uterine tumors. In the present study with a larger sample size of endometrial tumors, 2 PET images could distinguish endometrial carcinoma from benign lesions with PET parameters of 18F-FDG SUV and 18F-FDG–to–18F-FES ratio. Furthermore, the regional 18F-FDG–to–18F-FES ratio and the 18F-FES SUV could distinguish high-risk carcinoma (FIGO stage ≥ Ic or histologic grade ≥ 2) from low-risk carcinoma (FIGO stage ≤ Ib and histologic grade 1). This index provided the information that endometrial carcinoma with an advanced stage or a higher grade reduces estrogen dependency with an increase in glucose metabolism. In contrast, endometrial hyperplasia showed a significantly low 18F-FDG–to–18F-FES ratio of less than 0.5, indicating its preserved ER expression without an increase in glucose consumption. Low-risk carcinoma with moderate-to-intense 18F-FDG and 18F-FES accumulation is considered between high-risk carcinoma and hyperplasia in terms of aggressiveness.
Several reports indicated that 18F-FDG PET is useful for managing pre- and postoperative patients with endometrial carcinoma mainly by detecting lymph node metastasis (14–17). The classification of tumor characteristics determined by 18F-FDG uptake and the 18F-FDG–to–18F-FES ratio could play an important role in the differential diagnosis of endometrial lesions and in deciding the therapeutic strategy. The cutoff 18F-FDG–to–18F-FES ratio of 0.5 and the 18F-FDG SUV of 2.0 could differentiate low-risk carcinoma from hyperplasia, and all malignancies were correctly distinguished from benign lesions, with no false-positive findings and 100% accuracy. Some characteristic MRI findings of benign endometrial lesions such as endometrial hyperplasia and polyps were reported previously (18,19). Those specific findings are occasionally detected in the case of relatively large tumor volume, whereas it is difficult to differentiate small-sized endometrial hyperplasia from stage Ia carcinoma. PET, which characterizes tumor biofunction, would be more reliable than MRI findings for the preoperative diagnosis. Uterine tumors with estrogen-dependent function such as endometrial carcinoma may lose their estrogen-dependent function, reduce ER expression, and increase glucose metabolism because of aberrant glycolysis with dedifferentiation. This functional transformation could have shown opposite tendencies of high glucose metabolism and low 18F-FES accumulation in malignant tumors, especially in high-risk carcinoma. This noninvasive method could avoid unnecessary operations or invasive whole-endometrium curettage, which is important for preserving women's reproductive potential.
Functional PET is considered a promising method for deciding on personalized treatment. Although it would be difficult to determine the histologic grade of endometrial lesions by pelvic MRI, PET scans with 18F-FES and 18F-FDG can reflect tumor aggressiveness (invasiveness and grade) using the index of 18F-FDG–to–18F-FES ratio. As shown in the present study, the diagnostic accuracy of the 18F-FDG–to–18F-FES ratio was better than that of MRI in distinguishing high-risk from low-risk carcinoma. Surgical pathologic staging is now the standard of care for endometrial carcinoma (3). However, the role of comprehensive surgical staging, especially pelvic and paraaortic lymphadenectomy for all patients, remains controversial. Several reports asserted that patients with low-risk endometrial carcinoma can be treated with hysterectomy only (20,21). Avoiding lymphadenectomy decreases complications after surgery. Patients with low-risk endometrial carcinoma determined by an 18F-FDG–to–18F-FES ratio of less than 2.0 may be able to avoid pelvic or paraaortic lymphadenectomy, although the cutoff values for PET parameters should be validated prospectively using an independent patient group in further study because the cutoffs were optimized from this particular dataset. To decrease unnecessary lymphadenectomy and establish a noninvasive evaluation method for risk management in patients with endometrial carcinoma, further PET studies with a larger patient sample and a long-term follow-up would be needed.
The present study included 2 patients with paraaortic and pelvic lymph node metastases (stage IIIc) among 11 patients high-risk carcinomas. All metastatic lymph nodes were detected correctly by 18F-FDG PET, whereas the lymph nodes could not be identified with MRI in one of the patients. Although MRI findings are superior to 18F-FDG PET parameters in terms of the regional discrimination of carcinoma in stage Ia or Ib from stage Ic (or higher), 18F-FDG PET is considered to show a higher detection rate than MRI for distant metastasis. In addition, histopathologic results of the cases with lymph node metastases were grades 2 and 3, in which the primary sites showed far higher 18F-FDG–to–18F-FES ratios (4.3 and 7.1, respectively) than the cutoff value. These results indicate that PET studies with 18F-FDG and 18F-FES will reflect tumor aggressiveness, which is useful information for the treatment of patients with endometrial lesions.
Although simple stage differentiation with PET parameters was also evaluated by ROC analysis, this method could not differentiate early stages from advanced stages because stage Ia or Ib carcinoma with grades 2 or 3 showed a tracer uptake tendency similar to that of the high-risk group. Thus, we did not use this simple classification in the present study. The differentiation of high- and low-risk tumors as determined here would be more appropriate for the evaluation of tumor aggressiveness.
CONCLUSION
Endometrial carcinoma reduces estrogen dependency with increased glucose metabolism as it progresses to a higher stage or grade. The 18F-FDG–to–18F-FES ratio calculated from 18F-FES and 18F-FDG PET is the most informative index reflecting tumor aggressiveness. This index will be useful for noninvasive diagnosis and for deciding on the appropriate therapeutic strategy for patients with endometrial carcinoma.
Acknowledgments
We thank the doctors of the Departments of Radiology and Gynecology, Faculty of Medical Sciences, and the staff of the Biological Imaging Research Center, University of Fukui, for clinical and technical support. This study was partly funded by the Research and Development Project Aimed at Economic Revitalization (Leading Project) from MEXT Japan and a Grant-in-Aid for Scientific Research (20790887) and the 21st Century COE Program (Medical Science) from the Japan Society for the Promotion of Science.
Footnotes
-
COPYRIGHT © 2009 by the Society of Nuclear Medicine, Inc.
References
- Received for publication November 14, 2008.
- Accepted for publication January 16, 2009.


Jump to section
Related Articles
Cited By...
- ER Imaging for Estrogen-Related Tumors Is Bothersome but Useful
- Prognostic Value of 16{alpha}-18F-Fluoro-17{beta}-Estradiol PET as a Predictor of Disease Outcome in Endometrial Cancer: A Prospective Study
- Improved Estrogen Receptor Assessment by PET Using the Novel Radiotracer 18F-4FMFES in Estrogen Receptor-Positive Breast Cancer Patients: An Ongoing Phase II Clinical Trial
- 18F-Fluoroestradiol PET: Current Status and Potential Future Clinical Applications
- Evaluation of Gynecologic Cancer with MR Imaging, 18F-FDG PET/CT, and PET/MR Imaging
- Molecular Imaging Biomarkers for Oncology Clinical Trials
- Application of FDG-PET in Cervical Cancer and Endometrial Cancer: Utility and Future Prospects
- 18F-FES and 18F-FDG PET for Differential Diagnosis and Quantitative Evaluation of Mesenchymal Uterine Tumors: Correlation with Immunohistochemical Analysis
- Oestrogen-related tumour phenotype: positron emission tomography characterisation with 18F-FDG and 18F-FES
- Imaging Tumor Phenotype: 1 Plus 1 Is More Than 2