


Abstract
Reliable, repeatable, and time-efficient noninvasive measurement of infarct size in mice with PET would benefit studies aimed at the exploration of biochemical and functional changes associated with acute myocardial infarction (MI). PET with the radioactively labeled glucose derivative 18F-FDG is used in humans to distinguish between viable but dysfunctional and nonviable myocardium. In this study, the feasibility, accuracy, and time efficiency of 18F-FDG PET for quantification of infarct size in mice using a high-resolution animal PET device was evaluated in comparison with histomorphometry. Methods: Mice were subjected to surgery with permanent ligation of the left anterior descending artery. PET was performed before and 7 d after surgery. The infarct size was determined from the PET studies using both manual and automated delineation. The second PET scan was followed by histomorphometric analysis. Results: An excellent correlation between PET and histomorphometry was found for both manual (R = 0.98) and automated (R = 0.98) delineation, with linear regression curves close to unity (manual: y = 1.10x − 0.01; automated: y = 1.12x − 0.02). Automated analysis required <1 min per study. Conclusion: The measurement of infarct size in mice with 18F-FDG PET is feasible and highly accurate. This noninvasive methodology permits unique longitudinal studies of biochemical parameters in mice and facilitates studies that aim to assess the effect of surgical and pharmacologic intervention after acute MI.
Acute myocardial infarction (MI) is a critical event that is associated with numerous biochemical and functional changes in the infarcted tissue, in the area at risk, and in the remote myocardium. Regional changes in perfusion, metabolism, apoptosis, and gene expression may be uniquely examined noninvasively on a molecular level with PET (1–4). PET can also be used to measure changes in anatomic and functional parameters, such as left ventricular (LV) shape, end-diastolic and end-systolic volumes, stroke volume, cardiac output, ejection fraction, and regional contractility. Recently, these biochemical and functional parameters of myocardial pathophysiology have been increasingly studied with PET in small animals and, especially, in mice with a defined genetic background using dedicated high-resolution imaging systems (5–8).
A noninvasive method for the accurate quantification of infarct size is a prerequisite to assess the extent of MI, to examine the associated biochemical and functional changes, and to evaluate the impact of surgical and pharmacologic interventions with PET. Besides using infarct size as a surrogate endpoint in animal studies, it might be important for interventional studies to also assess infarct size early after ligation to compose groups of animals that match with respect to infarct size. This is important because coronary ligatures result in varying infarct sizes and localizations, most probably due to variations in coronary anatomy. This task can be achieved only by using a noninvasive imaging tool that allows repeated measurement of myocardial scarring. PET with the radioactively labeled glucose derivative 18F-FDG is an established method to distinguish dysfunctional but viable myocardium from nonviable myocardium in humans (9,10). Several methods for the quantification of infarct size with 18F-FDG PET in humans have been successfully applied in recent years (11,12).
Although the quantification of infarct size has been established in humans with PET, such quantification is more challenging in small animals because of their much smaller size. Imaging equipment capable of obtaining high-resolution images in these animals is obligatory. Good results have been achieved with PET for rats (13) and with SPECT for rats and mice (14,15); however, studies for the quantification of infarct size with PET in mice are largely missing.
In this study, we assess and validate the quantification of infarct size with high-resolution 18F-FDG PET in mice using histomorphometry as the reference method. Both user-dependent manual delineation of infarct size on 18F-FDG PET images and a time-efficient, largely user-independent, automated analysis methodology were tested for accuracy and efficiency.
MATERIALS AND METHODS
Animals and Protocol
All animal studies were approved by the federal animal rights committee and were performed in accordance with institutional guidelines for the health and care of experimental animals. Twenty-five outbred wild-type mice (75% Swiss, 25% SV129; 11 female, 14 male)—8- to 14-wk old, with a body weight of 18.5–29.0 g—were used. MI was induced as described elsewhere (16,17). Briefly, animals were anesthetized by intraperitoneal injection of sodium pentobarbital (10 mg/kg), intubated, and ventilated with isoflurane (0.5%–1.0%) in oxygen (0.5 L/min). Through a limited left thoracotomy in the fourth intercostal space, the left anterior descending artery (LAD) was permanently occluded using 7-0 Prolene (Ethicon GmbH). Myocardial ischemia was confirmed by regional loss of contractility and perfusion. The position of the ligature was altered between mice with respect to its location to produce a wider range of infarct sizes. Finally, the wound was closed after evacuation of the pleural space.
PET was performed under isoflurane anesthesia before surgery as well as on day 7 after MI. Figure 1 shows an example of cardiac PET studies on a mouse before and after MI.
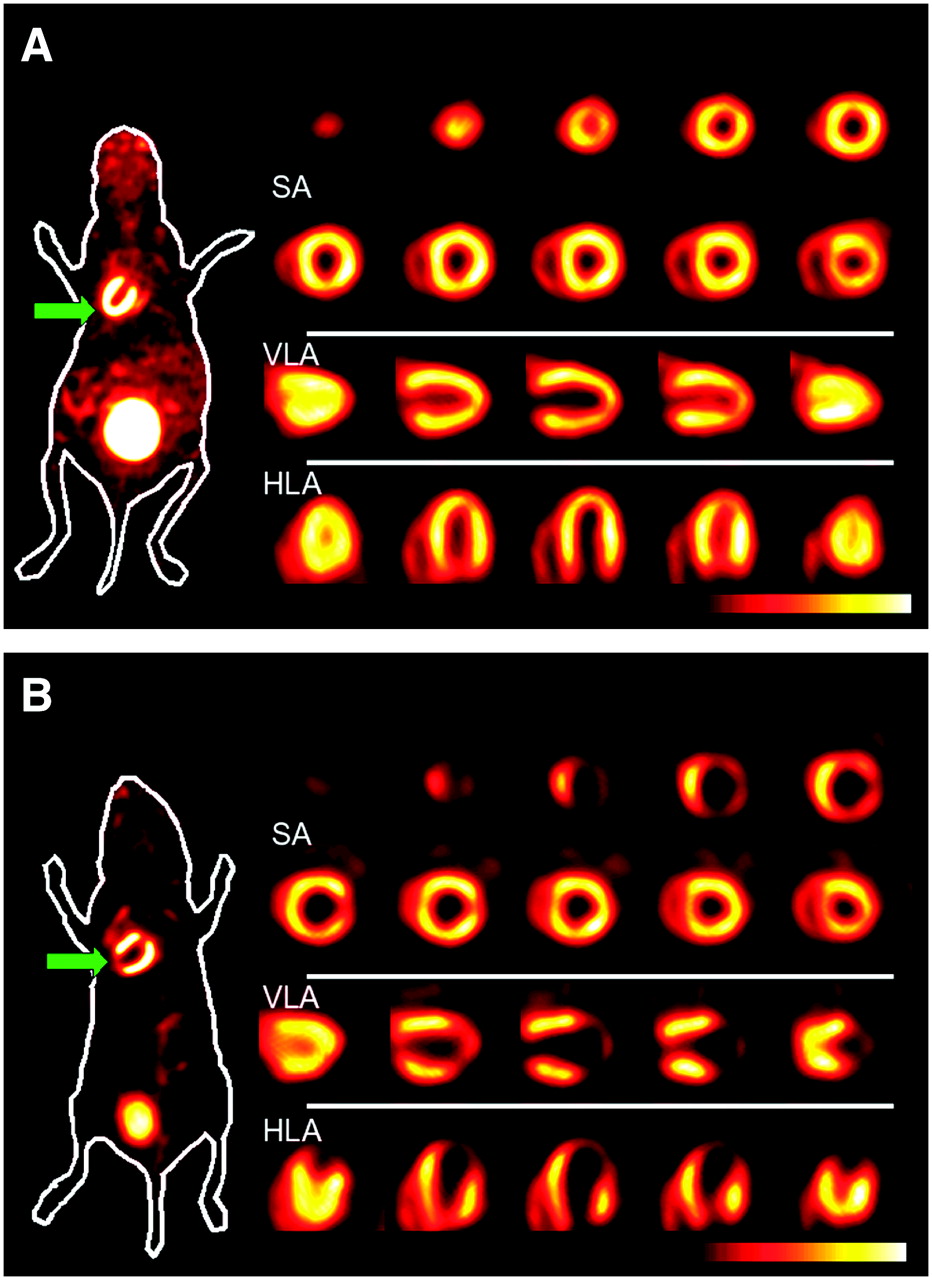
PET of mouse heart at baseline (A) and 7 d after MI (B). For each study, a coronal whole-body slice at the level of LV and bladder with superimposed body contour is shown on left-hand side. Arrow indicates apex of LV (site of infarcted tissue after MI). On right-hand side, short-axis (SA) slices from apex to base, vertical long-axis (VLA) slices from septum to lateral wall, and horizontal long-axis (HLA) slices from anterior to inferior wall show superb “human-like” image quality in mice.
Histomorphometry
Histomorphometry was chosen as the reference method over 3-dimensional (3D) imaging modalities such as MRI because it offers unambiguous differentiation between viable tissue and scar tissue and is unaffected by resolution and motion inaccuracies inherent in all noninvasive imaging methodologies. In this study, infarct size was not defined as the relative volume of infarcted tissue, as this definition would underrepresent infarcted regions with a thin wall in relation to viable regions with a wall of normal thickness. Instead, infarct size was defined as the relative amount of infarcted midmyocardial contour area (MCA), where MCA is the area of the myocardial wall enclosing the LV cavity measured in the middle between the endocardium and epicardium (Appendix). The calculation of MCA differs slightly between the stacked slices' analysis of histomorphometry and the manual delineation on PET, denoted by MCAslices, and the 3D automated PET analysis, denoted by MCA3D.
Mice were sacrificed immediately after the second PET scan on day 7 after MI. The hearts were retrogradely perfused via the abdominal aorta (0.9% saline/4% paraformaldehyde [PFA] solution for fixation; perfusion pressure, 9.8 kPa). Hearts were excised and the right ventricle and both atria were removed. Tissues were fixed by 12-h immersion in 4% PFA before paraffin embedding. Complete hearts were sectioned into 10- to 12-μm-thick slices, resulting in sagittally orientated long-axis slices. All slices were stained with sirius red, which stains viable muscle yellow and fibrotic tissue red.
Every fifth slice, yielding a total of 80–110 slices, was photographed and analyzed morphometrically (Figs. 2A and 2B). Calibrated and magnified digital photographs were transferred to a personal computer and analyzed planimetrically using an image analysis software program (ImageJ; National Institute of Mental Health, Bethesda, MD). The midmyocardial contour of the viable LV wall and the extent of scarred myocardium were traced on each image (Fig. 2B). The MCAslices of viable and scarred LV myocardium were calculated as the sum of all perimeters multiplied by the effective slice thickness of 50–60 μm. Infarct size was expressed as the ratio of infarcted and total MCAslices.
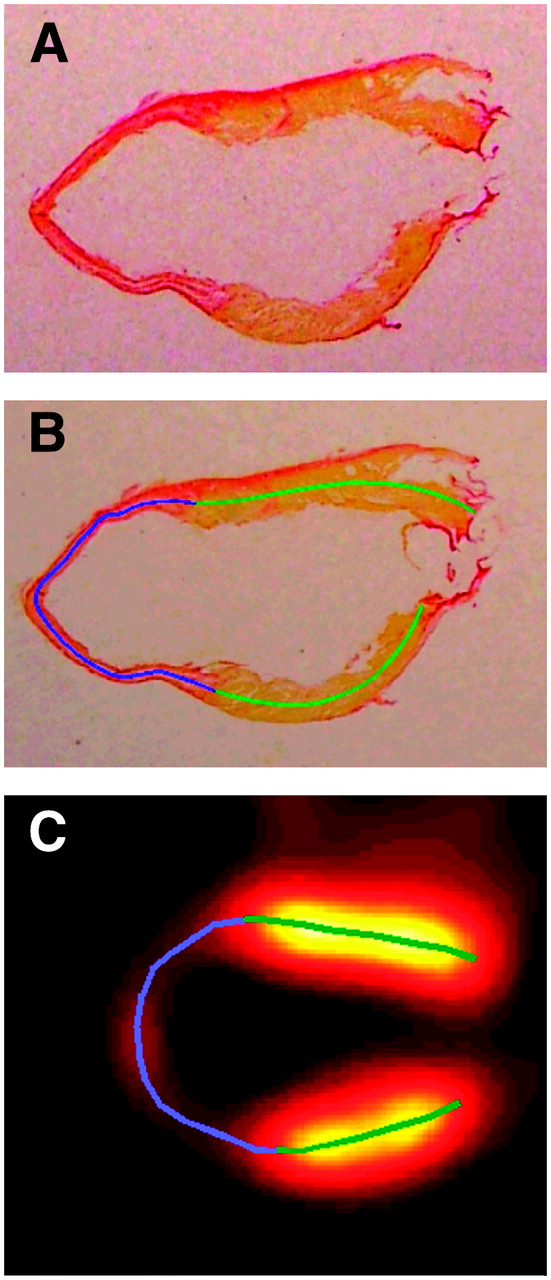
Manual infarct delineation on histologic slices as well as on vertical long-axis PET images. (A and B) Photographs of stained slice of paraffin-embedded LV myocardium without (A) and with (B) superimposed manually drawn midmyocardial contours depicting viable (green) and infarcted (blue) areas. (C) Vertical long-axis PET image with superimposed manually drawn midmyocardial contours depicting viable (green) and infarcted (blue) areas.
PET
Imaging was performed on a 32-module quadHIDAC scanner (Oxford Positron Systems) dedicated to small-animal imaging. The scanner has an intrinsic resolution of 1.08 mm (full width at half maximum [FWHM]) in the transaxial direction and 1.03 mm (FWHM) in the axial direction for 18F-based radiotracers (filtered backprojection, ramp filter, cutoff set to Nyquist frequency) (18) and an effective resolution of 0.7 mm (FWHM) in the transaxial and axial directions when using an iterative resolution recovery reconstruction algorithm (19).
The animals had unrestricted access to water and their normal food before scanning. 18F-FDG (15 MBq) in 100 μL 0.9% saline was injected intravenously 1 h before each scan. During data acquisition the mouse was placed on a heating pad to maintain a body temperature within the normal range. List-mode data were acquired for 15 min and subsequently reconstructed into a single image volume of 110 × 60 × 60 mm3, voxel size of 0.4 × 0.4 × 0.4 mm3.
PET Data Processing
Manual Delineation.
For manual analysis, a stack of vertical long-axis (VLA) images (slice thickness, 0.2 mm) was generated from the original image data; the necessary reorientation was performed interactively. The midmyocardial contours for myocardial regions with normal 18F-FDG uptake and, in the case of the post-MI scans, for regions with markedly reduced 18F-FDG uptake implying nonviability were interactively traced (Fig. 2C). To account for partial-volume effects, the border from scar to viable myocardium was defined to be the locus where the 18F-FDG uptake reached 50% of the myocardial maximum. The MCAslices of the infarcted regions as well as the MCAslices of the total LV wall were calculated as the length of the respective traced contours multiplied by the slice thickness. The relative infarct size was calculated as the ratio of infarcted and total MCAslices.
Automated Delineation.
The automated, largely user-independent, quantification of infarct size was based on an automated contour detection algorithm implementing a physical model of an elastic surface in a field of force, described in detail elsewhere (20,21). Briefly, the MCA3D is represented mathematically in 3 dimensions as an elastic surface whose shape is governed by the distribution of tracer activity within the PET image data. Myocardial tracer activity is the origin of a field of force that regionally attracts the MCA3D toward the center of the myocardium. Gaps in tracer distribution are bridged by means of model-inherent constraints. Regional myocardial thickness is calculated similarly; the attractive field of force emanates from the activity gradient in relation to the already determined MCA3D. Endo- and epicardial borders are calculated from MCA3D and the regional myocardial thickness, where endo- and epicardial borders are assumed to be equidistant to MCA3D.
Regional MCA3D and endo- or epicardial borders of the LV wall were determined for 384 area elements (24 angular steps in the azimuth direction; 16 steps from base to apex) (Fig. 3). For each of these area elements, the LV wall was classified as viable or nonviable depending on whether the maximal 18F-FDG uptake in the myocardium was above or below a set threshold. Finally, infarct size was calculated as the MCA3D of nonviable regions divided by the MCA3D of the total LV wall. Because the calculation of MCA3D differs slightly from that for MCAslices used for histomorphometry (the rationale behind using MCA3D for PET and MCAslices for histomorphometry is described in detail in the Appendix), a systematic error could potentially be introduced into the validation study when comparing results derived by PET using MCA3D with those derived by histomorphometry using MCAslices. Therefore, PET quantitation was repeated using MCAslices to assess this effect.

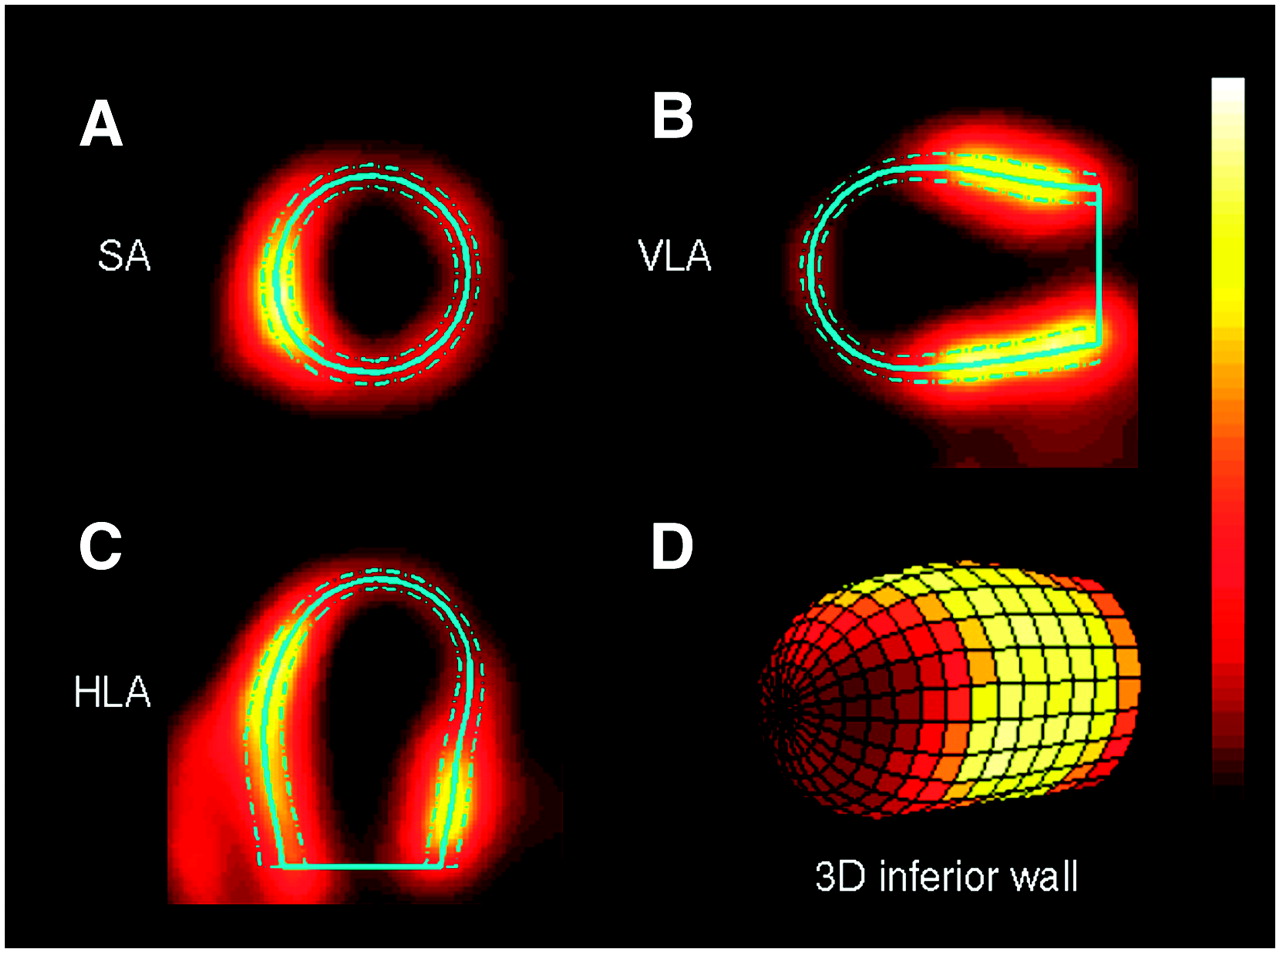
Automated contour detection with PET: midmyocardial (solid line), endo- and epicardial (dashed lines) contours superimposed on short-axis (SA; A), VLA (B), and horizontal long-axis (HLA; C) PET images. (D) 3D surface representation of midmyocardial contour of LV; color corresponds to regional 18F-FDG uptake, with infarcted area dark and high 18F-FDG uptake bright. Area of midmyocardial contour is denoted as MCA (MCA3D).
Unlike for the manual user-dependent analysis, where the operator can use prior knowledge to distinguish between scar tissue and small localized perfusion inhomogeneities, the simple classification scheme in the automated analysis as described may misclassify such small perfusion inhomogeneities as scar. To determine the best threshold, measurements were repeated for threshold values ranging from 10% to 90% of the myocardial maximum in steps of 10% and from 35% to 65% in steps of 5%. The myocardial maximum was chosen to be the median value from the 10% of segments with the highest 18F-FDG activity, so that possible artifacts within single segments are ignored.
The membranous part of the septum without significant radiotracer uptake would be misclassified as scar using the automated analysis method. Compared with human studies, this effect seems much less pronounced in mice judging from visual inspection. To assess whether the acquisition of a pre-MI scan in addition to the post-MI scan is necessary to correct for the membranous part of the septum, infarct sizes calculated with and without subtraction of areas with low 18F-FDG uptake preoperatively were compared.
A standard set of parameters for PET analysis was defined from these data so that the correlation coefficient, the slope, and the y-intercept of the regression line, as well as the amount of tissue misclassified as scar in the pre-MI scans, were optimized. The accuracy of the automated PET methodology using these standard parameters was evaluated in comparison with histomorphometry.
Statistical Analysis
Statistical analysis was performed using standard statistical software (JMP 5.1; SAS Institute Inc.). Group results were expressed as mean ± SD. Paired data were tested by means of the Student t test with Bonferoni correction for multiple analyses applied to the level of significance. Linear regression was used to compare PET results with histomorphometry. The ratios of the mean difference of paired measurements over their averages were calculated to test the agreement between the 2 measurements according to Bland and Altman (22); limits of agreement were defined as mean ± 2 SD.
RESULTS
Five of 25 mice died during cardiac surgery or in the early postoperative phase and 1 animal died of myocardial rupture on day 5 after surgery; thus, complete data from 19 animals were available for analysis. A transmural infarction occurred in 15 animals. In the remaining 4 animals, either a nontransmural infarction that did not reach the midmyocardial contour or a local subepicardial fibrotic reaction near the suture was observed. Transmural infarctions comprised 0%–51% (MCAslices, 28% ± 22% [mean ± SD]) of the LV myocardium (0%–29% of the LV myocardial volume) as assessed on sirius red staining.
PET: Manual Analysis
Comparison with Histomorphometry.
Infarcted areas were clearly visible and easily discriminated from viable tissue. The exact locus of the infarcted wall was sometimes difficult to determine as only faint 18F-FDG uptake was visible within infarcted areas (Fig. 1B). Infarct sizes ranged from 0% to 65% (30% ± 24% [mean ± SD]); the mean was not significantly different (P = 0.17) from histomorphometry. The correlation coefficient was R = 0.98, the slope of the regression curve was 1.10, and the y-intercept was −1% (Fig. 4). The infarct size of large infarcts is overestimated when compared with histomorphometry, with −9% and 12% limits of agreement.

PET-based infarct sizing using manual delineation. Infarct size is defined as the proportion of MCA (MCAslices) of infarcted myocardium, derived by PET and manual delineation, in relation to histomorphometry. (A) Linear regression analysis. (B) Bland–Altman analysis. Solid line in Bland–Altman plot depicts mean difference; dashed lines depict limits of agreement (mean ± 2 SD).
Time Efficiency.
Manual delineation of viable and nonviable regions was performed in 15–20 min per study.
PET: Automated Analysis
Optimal Threshold of 18F-FDG Uptake for Delineation of Scars in Mice.
The influence of the chosen 18F-FDG threshold value is depicted in Figure 5. The correlation coefficient was R > 0.97 for the relevant threshold values in the middle of the tested spectrum, with only marginal differences for thresholds between 40% and 70%; the slope of the regression curve was slightly higher than unity, and the y-intercept was close to 0 with an optimum at 60%. The amount of tissue misclassified as scar before MI was very low for threshold values up to 55% (mean, <2%). The slope of the regression curves was slightly higher for MCAslices compared with MCA3D.

PET-based infarct sizing using automated delineation with varying threshold values. Infarct size is defined as the proportion of MCA of infarcted myocardium, derived by PET and automated delineation, in relation to histomorphometry. Dependency of correlation coefficient (A), slope (B), and y-intercept (C) of linear regression line, as well as mean of wrongly assumed infarct proportion preoperatively (D), on choice of threshold in PET analysis. All data are given for 3D contour calculation (MCA3D, open bars) as well as for stacked slices' calculation adapted to histomorphometry (MCAslices, solid bars).
Standard Parameters.
For further calculations, standard parameters for PET analysis were defined as threshold of 50%, 3D area calculation (MCA3D), post-MI scan only. Infarct sizes ranged from 0% to 65% (29% ± 25% [mean ± SD]); the mean was not significantly different (P = 0.52) from histomorphometry. The correlation coefficient was R = 0.98, the slope of the regression curve was 1.12, and the y-intercept was −2% (Fig. 6A). The infarct size of large infarcts was overestimated in comparison with histomorphometry, with −1% and 12% limits of agreement (Fig. 6B). The mean amount of misclassified tissue before MI was 1% of the total MCA3D (SD, 1%).
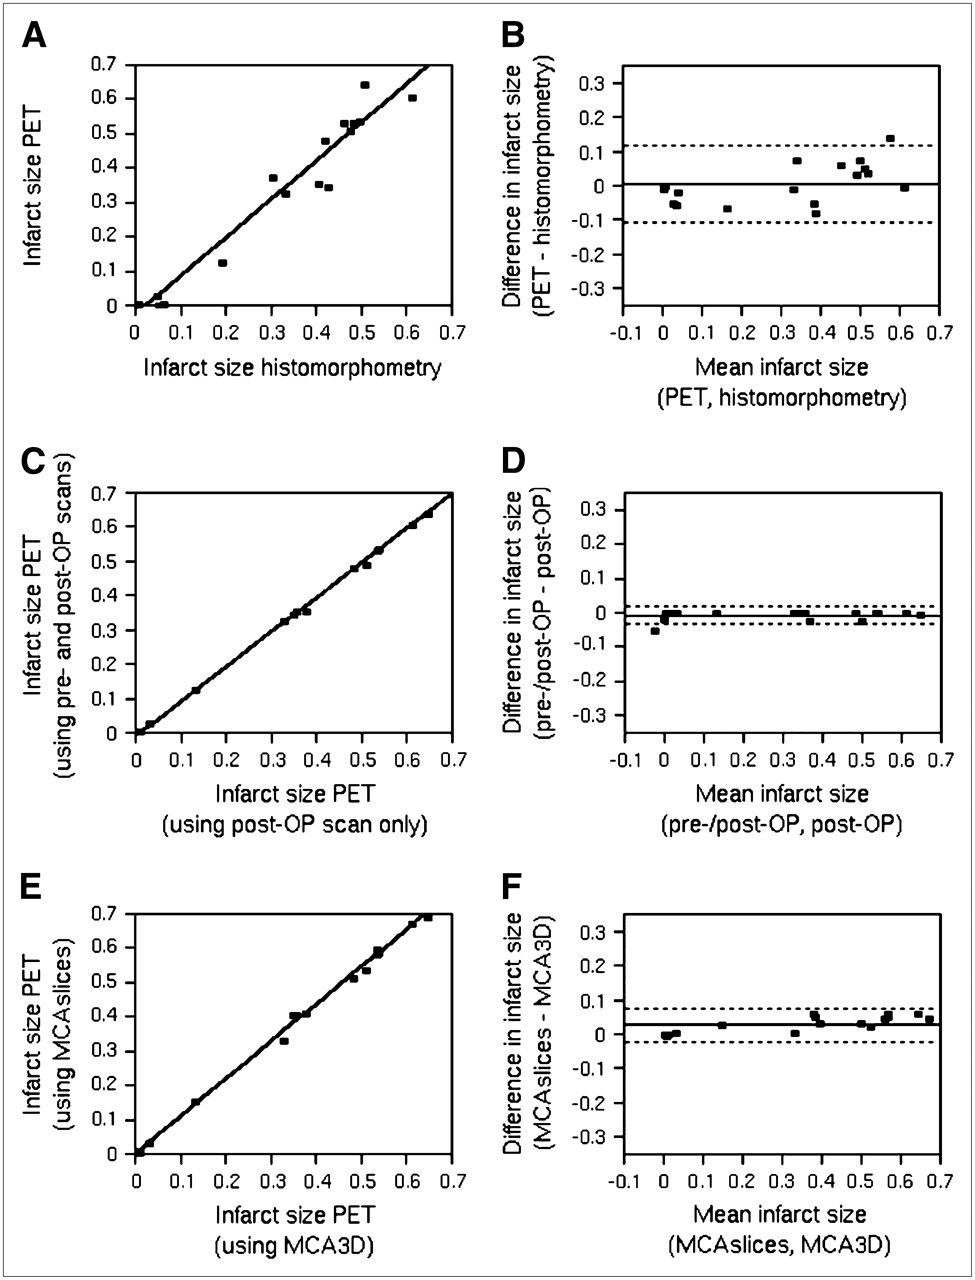
PET-based infarct sizing using automated delineation. Depicted are linear regression (A) and Bland–Altman analysis (B) of infarct size defined as the proportion of MCA3D of infarcted myocardium as derived by PET and automated segmentation with standard parameters (50% threshold, postoperative (post-OP) scan only, MCA3D) in comparison with histomorphometry. Additionally, nonstandard PET analysis with inclusion of both pre- and post-OP scans for calculation of infarct size (C and D) and nonstandard PET analysis using MCAslices instead of MCA3D (E and F) were compared with PET analysis with standard parameters (50% threshold, postoperative scan only, MCA3D). In both cases, linear regression (C and E) and Bland–Altman analyses (D and F) are shown. Solid line in Bland–Altman plots depicts mean difference; dashed lines depict limits of agreement (mean ± 2 SD).
Error Assessment.
Infarct size determined from both pre- and post-MI imaging differed little from assessment of post-MI only (mean error, 1%; R ≫ 0.99; slope, 1.01; y-intercept, −1%; limits of agreement, −3% and 2%) (Figs. 6C and 6D).
The mean infarct size was slightly higher when using the histomorphometry-adapted MCAslices instead of MCA3D (32% ± 27% vs. 29% ± 25%; P < 0.001), the correlation coefficient was R ≫ 0.99, the slope of the regression line was 1.09, and the y-intercept was 0 (Figs. 6E and 6F). This effect was pronounced for larger infarct sizes (limits of agreement, −2% and 8%).
Time Efficiency.
User-dependent preprocessing was performed in <1 min per study; subsequent automatic calculations were performed within a fraction of a second.
DISCUSSION
The measurement of transmural infarct size in mice with high-resolution dedicated 18F-FDG PET is highly accurate and may be valuable for noninvasive serial imaging of mouse hearts in experimental studies. Only minor differences were observed between manual and automated delineation. The correlation coefficient between PET and histomorphometry was very high in each case, the regression line was reasonably close to unity, and the limits of agreement were tight.
Though being equally accurate, automated delineation has several advantages over manual delineation: the high time efficiency allows for serial assessment even of a large number of scans; and inter- and intraobserver variability is likely reduced, especially for less-experienced observers.
A threshold of 50% with respect to the maximal myocardial uptake yielded excellent separation from viable and nonviable tissue. Furthermore, reasonable deviations from 50% were not critical; all correlative parameters remained within an acceptable range for threshold levels ranging from 35% to 65%. Although not encountered in this study, a myocardial region with uncharacteristically high tracer uptake—for example, due to spillover of outside activity—may be an inadequate reference region for threshold definition and should be excluded. Therefore, visual inspection of the reconstructed images should be mandatory as a quality control measure. It was noted that infarct size was overestimated by PET compared with histomorphometry. One main reason is likely to be found in the different physiologic conditions of in vivo PET and ex vivo histomorphometry. Unlike dysfunctional nonviable myocardium, the MCA of well-contracting viable regions is reduced during systolic movement. Therefore, infarct size is overestimated for PET acquisition without electrocardiographic (ECG) gating. ECG gating (23) with data acquired in diastole alone would be likely to diminish the difference. The quantification using the MCA instead of the myocardial volume was chosen to avoid underrepresentation of thin infarcted myocardial regions in comparison with viable regions with normal wall thickness. Additionally, threshold-based volumetric analysis would require accurate determination of regional myocardial volume as well as a threshold to separate viable tissue from nonviable tissue equally well in the subepicardial or subendocardial layers. Partial-volume effects and motion effects in PET would lead to inaccuracies (24,25). For the same reason, the 18F-FDG threshold to separate viable tissue from nonviable tissue was applied to the regional maximum instead of the mean.
A favorable result from the study is the fact that the membranous septum is less problematic for the automated analysis of mouse PET studies compared with human studies. Because only a small error was introduced when just the post-MI scan was used for the calculation of infarct size, the acquisition of a baseline pre-MI scan is dismissible for most studies.
The potential error introduced into the validation study by the fact that the automated delineation methodology for PET operates in 3 dimensions—whereas histomorphometry was performed on stacked histologic slices—was also low, as the results from the additional PET analysis using the histomorphometry-adapted MCAslices instead of MCA3D have shown. It is important to note that the effect is not a limitation of the PET-based approach but, rather, a limitation of the reference method. The 3D analysis using MCA3D is actually more accurate for the assessment of a curved 3D object, such as the LV. Therefore, MCAslices should be used only instead of MCA3D when comparison with a non-3D modality, such as histomorphometry, is intended.
As with many SPECT- and PET-based approaches used for humans and larger animals, such as pigs (26,27), we used a relative threshold to differentiate between viable and nonviable tissue. With 18F-FDG PET, it is in principle possible to perform absolute quantification of the metabolic rate of glucose use (MRG) under defined metabolic conditions using the hyperinsulinemic euglycemic clamp technique (28). Although this is feasible in humans and larger animals and has been shown to improve calculation of volumetric infarct size (12), it would complicate analysis in mice considerably. Given the high accuracy of the threshold-based approach in this study, quantification of MRG seems unnecessary.
Given the limited resolution of the PET modality, we have restricted analysis to transmural infarctions. For the assessment of small nontransmural infarctions, an imaging modality with higher resolution—such as echocardiography, CT, or MRI—could be preferable, although clearly much more time-consuming or user dependent.
LV remodeling with changes in ventricular size and shape is common after MI and has also been observed in this study. Visual inspection of the PET images revealed considerable dilatation of ventricles with large infarcts. Even though the assessment of infarct size with PET was highly accurate in this study, it is unclear whether changes in the shape of the ventricle, such as aneurysms that may occur later after MI, interfere with the PET-based assessment. A future longitudinal comparative study with 18F-FDG PET and MRI may give the answer to this question.
When compared with alternative approaches for the assessment of infarct size, 18F-FDG PET offers several important advantages. Compared with myocardial perfusion scintigraphy, the differentiation between scar tissue and dysfunctional and hypoperfused but viable tissue, especially shortly after MI, is facilitated by 18F-FDG PET (9,10). Compared with other PET tracers, such as 11C-palmitate (29) and 82Rb (27), that are used to deduce infarct size from changes in lipid metabolism and cell integrity, respectively, 18F-FDG is more readily available in most PET centers than 11C-based radiotracers and it allows for better-resolution images in comparison with 82Rb because of the lower kinetic energy of the produced positrons. Conventional echocardiography (30) is not a tomographic imaging modality and is highly user dependent with negative impact on reproducibility and time efficiency. The further development and evaluation of tomographic echocardiography may alleviate this problem. Compared with CT and MRI (31,32), 18F-FDG PET delivers parameters of a different kind (viable myocytes by glucose uptake vs. scar by reduced contrast media density in CT or delayed gadolinium washout in MRI), and all modalities could render mutually complementary information. The most important benefit of using PET over CT and MRI lies in the fact that not only infarct size and functional parameters can be measured using 18F-FDG but also a vast array of biochemical parameters can be measured using appropriate radiotracers, such as perfusion, metabolism, inflammation, apoptosis and gene expression in infarcted areas, areas at risk, and remote myocardium after MI. This is an advantage not only in infarct models with a permanent ligature but also in ischemia–reperfusion models.
CONCLUSION
Measurement of infarct size in mice with 18F-FDG PET—to our knowledge, for the first time—is a breakthrough in noninvasive imaging of mouse hearts. In combination with an automated fully 3D segmentation algorithm, this method is highly accurate and time efficient. The noninvasive nature of the 18F-FDG PET methodology allows longitudinal studies with assessment of infarct size along with many other biochemical and functional parameters in the same animals and, uniquely, facilitates interventional studies. The favorable results of this study may benefit many working in the field of basic research of cardiovascular pathophysiology and cardiac PET in mice. The PET methodology used in this study can easily be adapted to local requirements, the simple manual analysis can be used everywhere, and automated contour detection methods are widely available.
APPENDIX: MCA3D AND MCASLICES
The LV is a 3D object. The midmyocardial contour, whose area is named MCA3D, is consequently a curved 2-dimensional (2D) object in 3D space, reflected in the subscript. In Figure 7 it is depicted as the black line halfway between the endocardial and epicardial borders. The automated contour detection algorithm used in this study works in 3 dimensions and can be used to calculate MCA3D. For histomorphometry, the 3D object is transformed into a stack of 2D slices. Although the outline of the myocardial wall and the extent of infarcted regions can easily be measured within each slice (in plane), this is not possible in the direction perpendicular to the slices (through plane), as the exact spatial relationship of the myocardial wall in the through-plane direction is not maintained in the process of embedding and microtome sectioning—for example, there may be a relative shift of the tissue section on the object slide from one section to the next. A reasonable approximation for MCA3D is to measure the midmyocardial contour in the in-plane direction and multiply this value by the slice thickness before summing the values for every section, a value named MCAslices. However, this approach does not honor the curvature in the through-plane direction and is only approximate. The relationship between slice thickness d and the real extension of the midmyocardial contour in the through-plane direction, approximated by L in Figure 7, depends on the angle α enclosed by the through-plane curvature and the sectioned slice. For automated PET analysis, it is possible to calculate MCAslices in addition to MCA3D, as the values for L and α are known for each calculated area element.
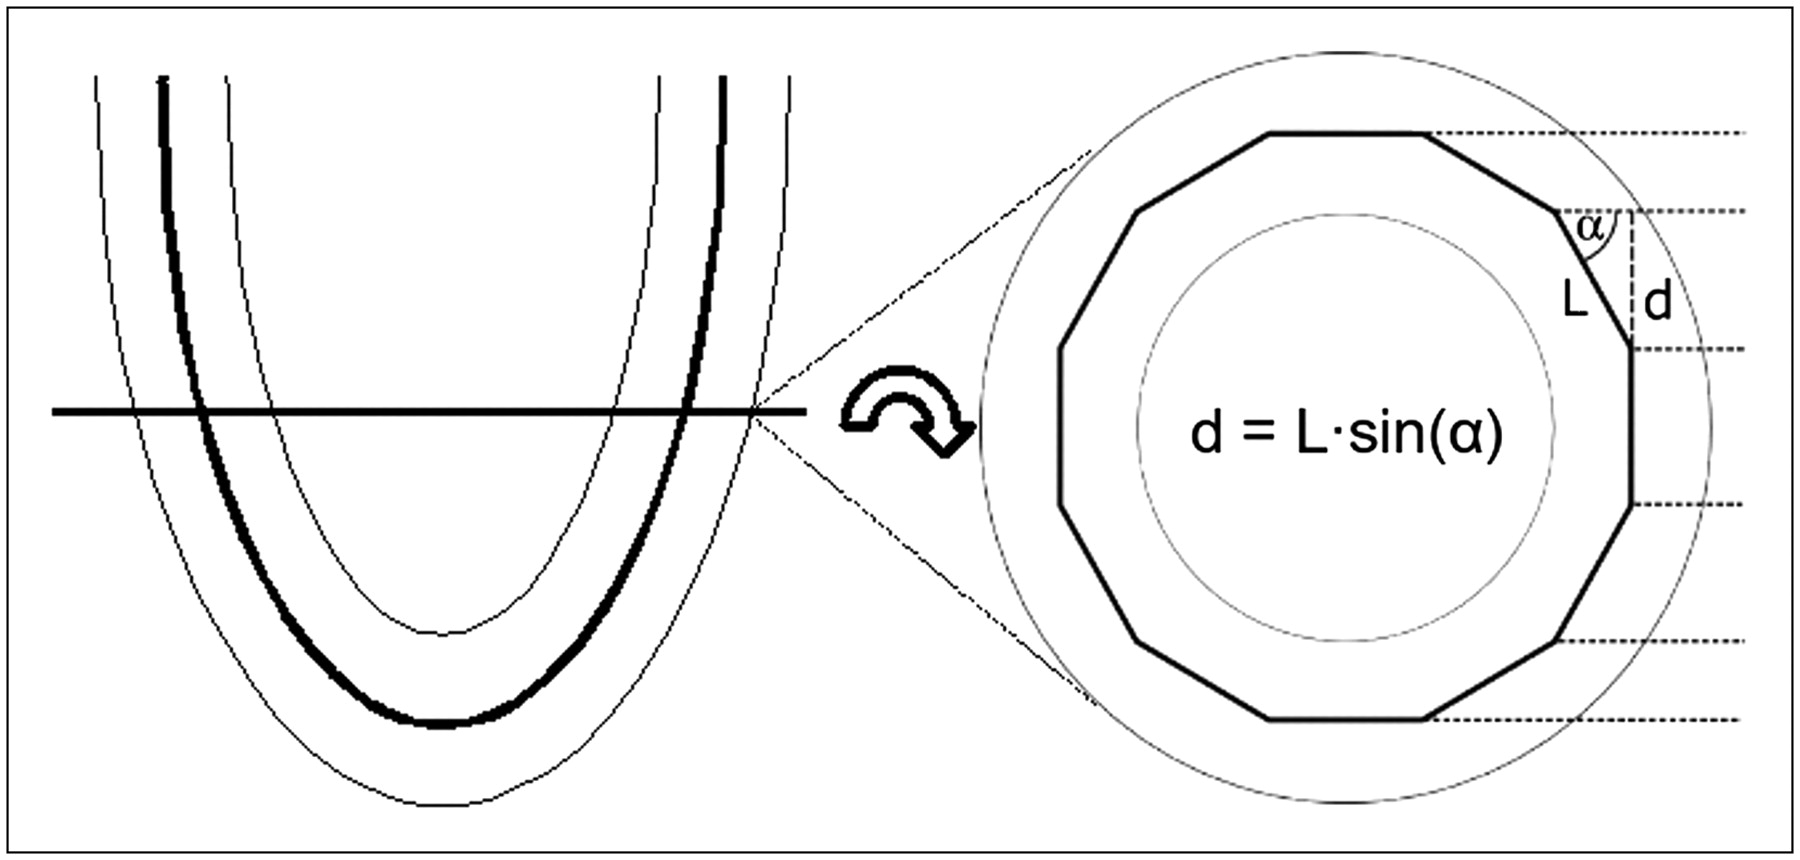
Illustration of difference between stacked slices and true 3D calculation of MCA. In stacked slices' analysis, the MCA (MCAslices) is calculated as the length of the midmyocardial contour on 2D images, as illustrated on left-hand side, multiplied by slice thickness (d). As illustrated on right-hand side, 3D calculation of MCA (MCA3D) of LV locally differs from MCAslices depending on myocardial curvature perpendicular to slice orientation. The relationship between d and the real extension of the midmyocardial contour in the through-plane direction (L) depends on the angle (α) enclosed by the through-plane curvature and the sectioned slice. Midventricular contour is approximated by a piecewise linear line to demonstrate this effect.
Acknowledgments
We thank Christine Bätza for help with image analysis, Stefan Lütke-Enking and Gisela Gaede for help with surgical procedures and histomorphometry, Marilyn Law for proofreading of the manuscript, and the staff of the cyclotron and radiochemistry facilities for radiotracer preparation. This work was supported in part by the Deutsche Forschungsgemeinschaft, SFB 656 Münster, projects A1, B3, Z2, and PM3; the Interdisciplinary Center of Clinical Research Münster, grants ZPG 4b and The1/68/04; and the European Commission, FP6-project DiMI, LSHB-CT-2005-512146.
Footnotes
-
↵* Contributed equally to this work.
References
- Received for publication May 5, 2006.
- Accepted for publication July 26, 2006.


Jump to section
Related Articles
Cited By...
- Wideband High-Frequency Echocardiography to Evaluate Myocardial Infarct Size
- Evaluation of a Novel 18F-Labeled Positron-Emission Tomography Perfusion Tracer for the Assessment of Myocardial Infarct Size in Rats
- Quantification of Left Ventricular Volumes and Ejection Fraction in Mice Using PET, Compared with MRI
- Effective Methods to Correct Contrast Agent-Induced Errors in PET Quantification in Cardiac PET/CT