
Main menu

  • Home
  • Content
    • Current
    • Ahead of print
    • Past Issues
    • JNM Supplement
    • SNMMI Annual Meeting Abstracts
    • Continuing Education
    • JNM Podcasts
  • Subscriptions
    • Subscribers
    • Institutional and Non-member
    • Rates
    • Journal Claims
    • Corporate & Special Sales
  • Authors
    • Submit to JNM
    • Information for Authors
    • Assignment of Copyright
    • AQARA requirements
  • Info
    • Reviewers
    • Permissions
    • Advertisers
  • About
    • About Us
    • Editorial Board
    • Contact Information
  • More
    • Alerts
    • Feedback
    • Help
    • SNMMI Journals
  • SNMMI
    • JNM
    • JNMT
    • SNMMI Journals
    • SNMMI

User menu

  • Subscribe
  • My alerts
  • Log in
  • My Cart

Search

  • Advanced search
Journal of Nuclear Medicine
  • SNMMI
    • JNM
    • JNMT
    • SNMMI Journals
    • SNMMI
  • Subscribe
  • My alerts
  • Log in
  • My Cart
Journal of Nuclear Medicine

Advanced Search

  • Home
  • Content
    • Current
    • Ahead of print
    • Past Issues
    • JNM Supplement
    • SNMMI Annual Meeting Abstracts
    • Continuing Education
    • JNM Podcasts
  • Subscriptions
    • Subscribers
    • Institutional and Non-member
    • Rates
    • Journal Claims
    • Corporate & Special Sales
  • Authors
    • Submit to JNM
    • Information for Authors
    • Assignment of Copyright
    • AQARA requirements
  • Info
    • Reviewers
    • Permissions
    • Advertisers
  • About
    • About Us
    • Editorial Board
    • Contact Information
  • More
    • Alerts
    • Feedback
    • Help
    • SNMMI Journals
  • View or Listen to JNM Podcast
  • Visit JNM on Facebook
  • Join JNM on LinkedIn
  • Follow JNM on Twitter
  • Subscribe to our RSS feeds
Research ArticleBasic Science Investigation

Toward a Patient-Specific Traceable Quantification of SPECT/CT-Based Radiopharmaceutical Distributions

Anna-Lena Theisen, Michael Lassmann and Johannes Tran-Gia
Journal of Nuclear Medicine July 2022, 63 (7) 1108-1116; DOI: https://doi.org/10.2967/jnumed.121.262925
Anna-Lena Theisen
Department of Nuclear Medicine, University of Würzburg, Würzburg, Germany
  • Find this author on Google Scholar
  • Find this author on PubMed
  • Search for this author on this site
Michael Lassmann
Department of Nuclear Medicine, University of Würzburg, Würzburg, Germany
  • Find this author on Google Scholar
  • Find this author on PubMed
  • Search for this author on this site
Johannes Tran-Gia
Department of Nuclear Medicine, University of Würzburg, Würzburg, Germany
  • Find this author on Google Scholar
  • Find this author on PubMed
  • Search for this author on this site
  • Article
  • Figures & Data
  • Info & Metrics
  • PDF
Loading

Article Figures & Data

Figures

  • Tables
  • Figure
    • Download figure
    • Open in new tab
    • Download powerpoint
  • FIGURE 1.
    • Download figure
    • Open in new tab
    • Download powerpoint
    FIGURE 1.

    Gyroid structures used in this work. (Top) Gyroid cubes (edge length, 2a) for a period of a = 12.56 mm and different wall thicknesses (G1, 0.40 mm; G2, 1.29 mm; G3, 2.65 mm). (Bottom) Corresponding cross-sections (only a single period is depicted) to illustrate the gyroid features (period, wall thickness) and the spatial volume filled by gyroid.

  • FIGURE 2.
    • Download figure
    • Open in new tab
    • Download powerpoint
    FIGURE 2.

    Cuboid phantom. (A) Model components (3 gyroid cubes of different volume fraction ratios and shell consisting of 2 parts). (B) Cross-section through CAD model. (C) Cross-section through CT (gray scale) superimposed by CAD model (different colors). (D) Cross-section of SPECT reconstruction (48 iterations, 1 subset, and 10-mm postprocessing filter).

  • FIGURE 3.
    • Download figure
    • Open in new tab
    • Download powerpoint
    FIGURE 3.

    Design of patient-specific 2-compartment kidney phantom. (A) Boolean operations necessary to generate kidney CAD model out of patient-specific kidney VOIs, different gyroid and filling structures (example: G1 and G3 for cortex and medulla, respectively), attachment and filling ports, and patient-specific kidney shell. (B) 3D printed 1:7.5 kidney phantom. ∧ = Boolean “and”; ∨ = Boolean “or.”

  • FIGURE 4.
    • Download figure
    • Open in new tab
    • Download powerpoint
    FIGURE 4.

    Quantitative analysis of cuboid. Depicted is the mean activity concentration in square regions of interest plotted in axial direction for different reconstruction parameters (number of iterations and postfilters). Positioning of axial regions of interest is illustrated at the top right by red boxes in the SPECT reconstruction. Solid black vertical lines represent borders between different gyroid cubes. Dashed black rectangles indicate axial position of 2 × 2 × 2 cm3 cubes used for the quantitative analysis (height of each box = HPGe-based activity concentration).

  • FIGURE 5.
    • Download figure
    • Open in new tab
    • Download powerpoint
    FIGURE 5.

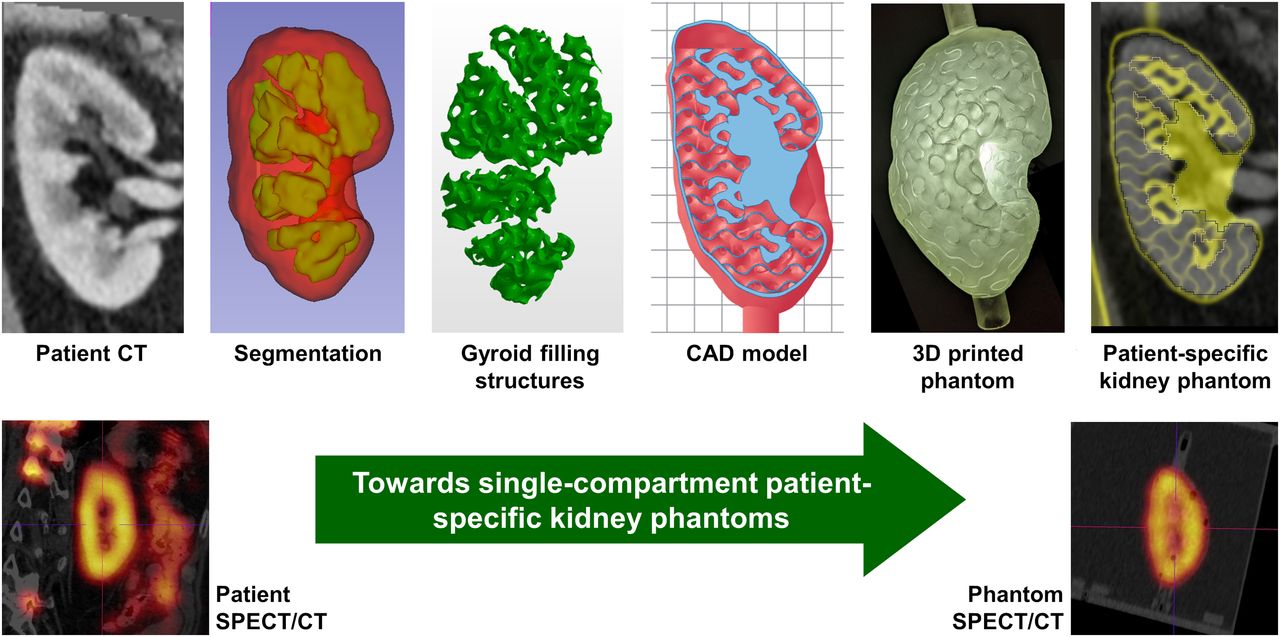
    Design and validation of patient-specific kidney phantoms. (Top, left to right) Coronal contrast-enhanced CT slice of patient kidney; segmented cortex (red) and medulla (green); and 3D model of segmentation. (Center) Cross-sections through CAD models (green arrows: top sections without internal structure) for all 3 phantom designs (grid dimension, 1 cm). (Bottom) Contrast-enhanced patient CT (grayscale) overlaid with CT of phantom kidney (yellow) for all 3 phantom designs. CE = contrast-enhanced.

  • FIGURE 6.
    • Download figure
    • Open in new tab
    • Download powerpoint
    FIGURE 6.

    SPECT/CT fusions of patient acquisition and 3 phantoms (resin fraction ratios of 1:1, 1:3.5, and 1:7.5) for different postfilters (left to right: 0, 10, and 20 mm). Green arrows indicate overestimation of activity concentration in medulla for resin fraction ratio 1:1. Blue arrows indicate surface tension–related air bubbles.

  • FIGURE 7.
    • Download figure
    • Open in new tab
    • Download powerpoint
    FIGURE 7.

    Activity concentration–voxel histograms for patient (black) and 3 phantoms (red, 1:7.5; blue, 1:3.5; green, 1:1) for 48 iterations, 1 subset, and gaussian postfilters of 0 mm (A), 10 mm (B), and 20 mm (C) in full width at half maximum. While solid curves depict number of voxels containing certain activity concentration, vertical dashed lines indicate HPGe-based activity concentrations in medulla and cortex (values are presented in Table 2).

Tables

  • Figures
    • View popup
    TABLE 1

    Calculation of Resin Fraction and Fillable Fraction for 3 Cuboid Structures, and Resin Fraction Ratio of G2 and G3 with Respect to G1

    GyroidWall thickness (mm)Resin fractionFillable fractionResin fraction ratio
    G10.400.0780.9221:1
    G21.290.2770.7231:3.55
    G32.650.5800.4201:7.44
    • View popup
    TABLE 2

    Activities and Activity Concentrations Measured with Regard to Patient-Specific Kidney Phantom Measurements

    HPGe-basedSPECT-based
    RatioV (mL)Target, c (MBq/mL)c (MBq/mL)A (MBq)cMedulla (MBq/mL)cCortex (MBq/mL)A0 mm (MBq)A10 mm (MBq)A20 mm (MBq)
    1:1149.80.630.6597.40.600.60103.8103.7103.6
    1:3.5140.20.670.6388.30.460.5893.693.593.5
    1:7.5131.50.720.6889.40.290.6387.887.787.7
    • Shown are filling volume (V) as well as target, HPGe-based, and SPECT-based activity concentrations (c) and total kidney activities (A). Medulla and cortex concentrations were calculated on basis of the fillable fractions (Table 1). The SPECT-based target total activity for the patient kidney was 94.9 MBq.

    • View popup
    TABLE 3

    Quantitative Evaluation of Different Gyroid Structures Inside Cuboid Phantom

    IterationsNo postprocessing filter10-mm gaussian20-mm gaussian
    Activity concentration G1 (1:1) gyroid (HPGe-based): 0.64
     120.810.740.58
     240.790.740.58
     480.760.710.57
    Activity concentration G2 (1:3.5) gyroid (HPGe-based): 0.50
     120.590.550.46
     240.570.550.46
     480.540.520.45
    Activity concentration G3 (1:7.5) gyroid (HPGe-based): 0.29
     120.330.310.26
     240.320.310.26
     480.290.290.25
    • Vertically are shown different numbers of iterations; horizontally are shown postfilters of different full widths at half maximum. All activity concentrations are given in MBq/mL.

PreviousNext
Back to top

In this issue

Journal of Nuclear Medicine: 63 (7)
Journal of Nuclear Medicine
Vol. 63, Issue 7
July 1, 2022
  • Table of Contents
  • Table of Contents (PDF)
  • About the Cover
  • Index by author
  • Complete Issue (PDF)
Print
Download PDF
Article Alerts
Sign In to Email Alerts with your Email Address
Email Article

Thank you for your interest in spreading the word on Journal of Nuclear Medicine.

NOTE: We only request your email address so that the person you are recommending the page to knows that you wanted them to see it, and that it is not junk mail. We do not capture any email address.

Enter multiple addresses on separate lines or separate them with commas.
Toward a Patient-Specific Traceable Quantification of SPECT/CT-Based Radiopharmaceutical Distributions
(Your Name) has sent you a message from Journal of Nuclear Medicine
(Your Name) thought you would like to see the Journal of Nuclear Medicine web site.
Citation Tools
Toward a Patient-Specific Traceable Quantification of SPECT/CT-Based Radiopharmaceutical Distributions
Anna-Lena Theisen, Michael Lassmann, Johannes Tran-Gia
Journal of Nuclear Medicine Jul 2022, 63 (7) 1108-1116; DOI: 10.2967/jnumed.121.262925

Citation Manager Formats

  • BibTeX
  • Bookends
  • EasyBib
  • EndNote (tagged)
  • EndNote 8 (xml)
  • Medlars
  • Mendeley
  • Papers
  • RefWorks Tagged
  • Ref Manager
  • RIS
  • Zotero
Share
Toward a Patient-Specific Traceable Quantification of SPECT/CT-Based Radiopharmaceutical Distributions
Anna-Lena Theisen, Michael Lassmann, Johannes Tran-Gia
Journal of Nuclear Medicine Jul 2022, 63 (7) 1108-1116; DOI: 10.2967/jnumed.121.262925
Twitter logo Facebook logo LinkedIn logo Mendeley logo
  • Tweet Widget
  • Facebook Like
  • Google Plus One
Bookmark this article

Jump to section

  • Article
    • Visual Abstract
    • Abstract
    • MATERIALS AND METHODS
    • RESULTS
    • DISCUSSION
    • CONCLUSION
    • DISCLOSURE
    • Footnotes
    • REFERENCES
  • Figures & Data
  • Info & Metrics
  • PDF

Related Articles

  • No related articles found.
  • PubMed
  • Google Scholar

Cited By...

  • Enhancing PET/CT Assessment with Porous 3D-Printed Grids - A Pilot Study
  • Google Scholar

More in this TOC Section

  • [11C]ZTP-1: An Effective Short-Lived Radioligand for PET of Rat and Monkey Brain Phosphodiesterase Type 4 Subtype B
  • Reduced Renal Uptake of Various Radiopharmaceuticals with Sodium Paraaminohippurate Coadministration in a Rat Model
  • In Vivo Visualization and Quantification of Brain Heat Shock Protein 90 with [11C]HSP990 in Healthy Aging and Neurodegeneration
Show more Basic Science Investigation

Similar Articles

Keywords

  • methods
  • SPECT/CT
  • 3D printing
  • activity distribution
  • kidney phantom
  • quantitative SPECT/CT
SNMMI

© 2025 SNMMI

Powered by HighWire