


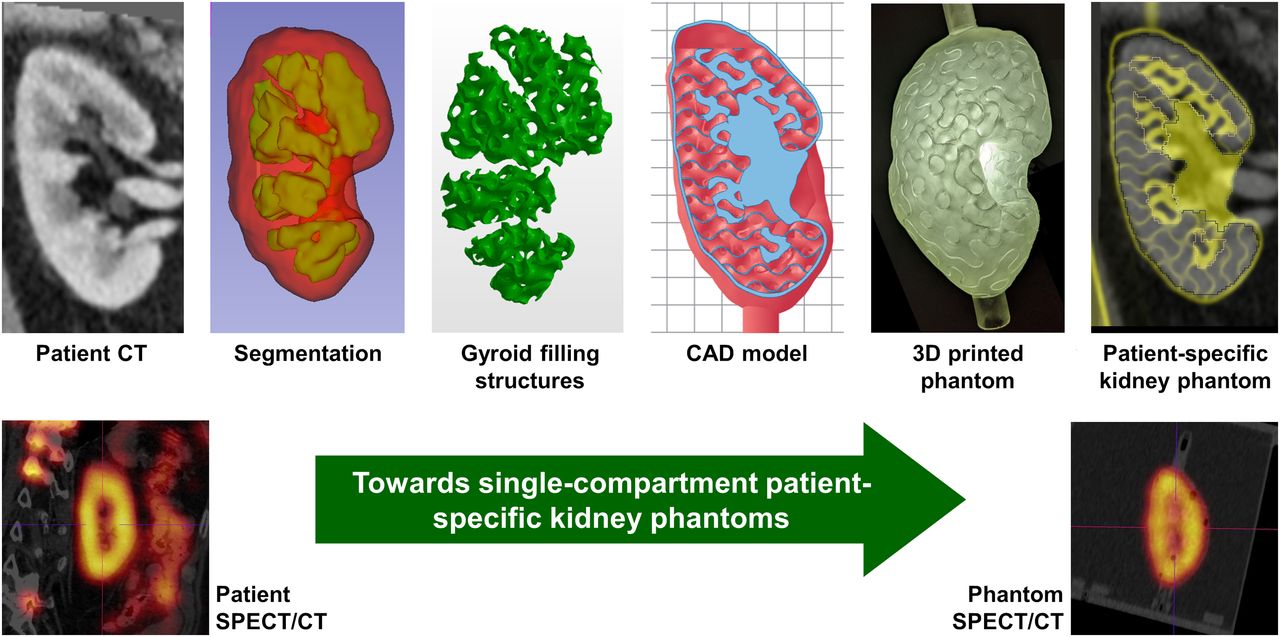
Visual Abstract

Abstract
Quantitative SPECT/CT imaging is currently the state of the art for peritherapeutic monitoring of radiopharmaceutical distributions. Because of poor resolution, however, the verification of SPECT/CT-based activity distributions is of particular importance. Because of the lack of a ground truth in patient measurements, phantoms are commonly used as a substitute for clinical validation of quantitative SPECT/CT. Because of the time-consuming and erroneous preparation of multicompartment phantoms, such as for the kidney, the usually very complex internal activity distributions are typically replaced by 1- or 2-compartment models. To provide a simplified solution for generating inhomogeneous activity distributions, this work presents a methodology for designing single-compartment phantoms that mimic inhomogeneous spatial activity distributions by using internal filling structures of different volume fractions. Methods: A series of phantoms with different filling structures was designed, 3-dimensionally printed, and measured. After assessing the feasibility of the presented approach in a simple geometry, a set of three patient-specific kidney phantoms was designed on the basis of the contrast-enhanced CT scan of a patient with metastatic castration-resistant prostate cancer. Internal gyroid structures of different wall thicknesses were used in the renal medulla and cortex to reproduce the inhomogeneous activity distribution observed in a peritherapeutic SPECT/CT acquisition 24 h after injection of 177Lu-labeled prostate-specific membrane antigen (apparent activity concentration ratios of 1:1, 1:3.5, and 1:7.5). After 3-dimensional printing, SPECT/CT experiments were performed and the results were compared with the patient data for different reconstruction settings (iterations, subsets, and postfiltering). Results: Good agreement was found between phantom designs and fabricated phantoms (based on high-resolution CT). No internal filling structures were visible in any of the SPECT images, indicating a sufficiently small feature size. Although good visual and quantitative agreement was achieved for certain combinations of filling structure and reconstruction, a histogram analysis indicated an even more complex activity distribution in the patient than represented by the two compartments assumed in our model. Conclusion: The proposed methodology provides patient-specific phantoms mimicking inhomogeneous activity distributions while using a single stock solution, thus simplifying the filling process and reducing uncertainties in the activity determination. This method enables an unprecedented possibility for patient-specific evaluation of radiopharmaceutical uptake, reducing uncertainties in internal dosimetry and individualized treatments.
A fundamental problem in the clinical validation of new imaging technology such as quantitative imaging of radiopharmaceutical distributions is the lack of a ground truth in patient measurements. Since nuclear medicine imaging procedures are typically noninvasive, direct validation of the measured radiopharmaceutical distribution on the basis of tissue samples is possible in only the rarest of cases. As an example, de Jong et al. revealed the radioactivity distribution in the normal human kidney after intravenous injection of 111In-diethylenetriaminepentaacetic acid octreotide using SPECT scanning before and ex vivo autoradiography of the kidney after nephrectomy in three men with single primary renal tumors (1). In most cases for which such information is not available, however, imaging methodologies can be validated only on a non–patient-specific basis using anthropomorphic phantom measurements.
Industrially produced phantoms, which are widely used for commissioning and quality control in nuclear medicine imaging, typically consist of one or more fillable compartments of simple geometries (e.g., spheres or cylinders). Inhomogeneous activity distributions are typically achieved by assembling a set of single-compartment phantom inserts separately filled with radioactive stock solutions of different activity concentrations. This method, however, increases the complexity and thus the error susceptibility of the phantom preparation, as each separately filled compartment adds to the total uncertainty of the measurement (e.g., because of errors in the activity and filling volume of each stock solution). On the way toward more patient-specific phantoms, increasingly complex 3-dimensionally (3D) printed phantoms have recently been proposed for quality assessment of SPECT/CT quantification (2–5). The combination of low costs yet very flexible design options makes the technology an ideal supplement for, or even an alternative to, industrially produced phantoms. Although in the first implementations of 3D printing technology for nuclear medicine phantom production, simple geometries with a single fillable compartment were implemented (3), these designs were quickly replaced by more complex structures consisting of multiple (mostly two) separately fillable compartments (4,5). Despite many advancements in the field of 3D printing for nuclear medicine phantom production, inhomogeneous activity distributions within a single compartment have not yet been achieved, leaving unresolved the issue of patient-specific assessment of SPECT/CT imaging.
In this work, we present a way of achieving spatially inhomogeneous activity distributions in a single fillable compartment by using internal filling structures of different volume fractions. This method, while keeping phantom filling as simple as possible, leads to apparently inhomogeneous activity distributions in SPECT/CT imaging if the structure size is smaller than the SPECT resolution. The methodology was first developed and tested in a simple cuboid geometry for validation and was then applied to create a patient-specific multicompartment kidney of a patient with metastatic castration-resistant prostate cancer who had previously undergone 177Lu-labeled prostate-specific membrane antigen (PSMA) therapy at our institution.
MATERIALS AND METHODS
SPECT/CT Imaging
All SPECT/CT data in this work (phantom as well as patient data) were acquired with a Siemens Intevo Bold SPECT/CT system with a 9.5-mm crystal thickness, a medium-energy low-penetration collimator, a 180° configuration, automatic contouring, continuous mode, 60 views, 10 s per view, a 256 × 256 matrix, and 3 energy windows (20% around the main photopeak of 208 keV and 2 adjacent 10% windows). Subsequent to the SPECT acquisition, low-dose CT imaging was performed for attenuation correction (130 kVp, 512 × 512 pixels, 1.0 × 1.0 × 3.0 mm resolution). Reconstructions were performed using xSPECT Quant (Siemens), automatically converting counts to activity concentration based on a National Institute of Standards and Technology–traceable cross-calibration (the calibration of this quantitative reconstruction is performed regularly as recommended by the manufacturer) using 1 subset with different combinations of iterations (12, 24, and 48) and postfilters (0, 10, and 20 mm). All activities were decay-corrected to the starting time of the SPECT/CT acquisition.
The patient whose data were used for this study signed an informed consent form, and the local ethics committee expressed no objections to the retrospective evaluation and publication of the data in accordance with data protection regulations (reference number 20200915 01).
Gyroid Structure
The basic idea is to achieve an apparently inhomogeneous signal distribution in SPECT phantoms using a phantom filled with a radioactive solution of homogeneous activity concentration in combination with a filling structure of spatially varying volume fraction (fraction of volume occupied by the structure). As the structure fills space and thereby displaces radioactive solution to varying extents in different areas of the phantom, the apparent activity distribution (e.g., for SPECT voxels, which are typically in the range of 2–5 mm in edge length) can be varied by changing the volume fraction of the filling structure. The mass density of the hardened photopolymer resin is 1.22 ± 0.01 g/cm3, obtained by dividing the caliper-based volume of a 3D printed solid resin cube with a side length of 20.00 ± 0.05 mm (measurement of all 4 edges of a single 3D printed cube) by the weight measured with an ED224S analytic balance (Sartorius AG; average of 3 measurements). This value lies in the range of water and soft tissue, ensuring only minor differences in attenuation between the resin and water.
The filling structure needs to be periodic to ensure that any excess resin can leave the phantom during the printing process and that radioactive solution can permeate the structure during phantom preparation and emptying. In addition, the range of possible volume fractions should be as large as possible to represent even highly heterogeneous activity distributions. After testing different combinations of cylinders and spheres of different sizes, the gyroid structure (6) was selected, as it combines all required properties.
A gyroid (Fig. 1) is an infinitely connected triply periodic minimal surface structure without self-intersections. The surface is described by the following equation, where a equals the period and t affects the thickness of the structure: (Eq. 1)

Gyroid structures used in this work. (Top) Gyroid cubes (edge length, 2a) for a period of a = 12.56 mm and different wall thicknesses (G1, 0.40 mm; G2, 1.29 mm; G3, 2.65 mm). (Bottom) Corresponding cross-sections (only a single period is depicted) to illustrate the gyroid features (period, wall thickness) and the spatial volume filled by gyroid.
Three gyroid representations form the basis for all phantom designs in this work (a fixed period of a = 4π⋅mm was used): Gyroid 1 (G1) had a wall thickness of 0.40 mm, which represents the minimum wall thickness supported by our 3D printer (Form 2, Formlabs). In addition, gyroids with a wall thickness of 1.29 mm (G2) and 2.65 mm (G3) were used to achieve volume fraction ratios of about 1:3.5 and 1:7.5, respectively, with regard to G1. These volume fractions were chosen because they cover the range of realistic volume fraction ratios (between 1:1 and 1:8 depending on patient, time after injection, and subregion of cortex or medulla), which we had previously determined in a retrospective evaluation (7) of autoradiography data published by de Jong et al. (1).
Cuboid Phantom
To validate our assumptions, a phantom was designed by concatenating 3 cubic structures with dimensions of 4 × 4 × 4 cm3, each consisting of 1 of the 3 gyroids (G1, G2, and G3) (Fig. 2A). After creation in MATLAB R2021a (MathWorks), each of these gyroids was transferred to Netfabb Premium 2021 (Autodesk). In Netfabb, each structure was smoothed (triangle reduction with a maximum average deformation of 0.05 mm) to enable high-quality 3D printing. On the basis of these models, the volume fraction ratios between G1, G2, and G3 were determined as follows (intermediate values of the calculation can be found in Table 1): first, the volume fraction filled with resin (resin fraction) was calculated as the quotient of the gyroid structure’s volume inside a cube (obtained by Netfabb) and the analytic cube volume. In addition, the fraction of each gyroid volume that was fillable with radioactive stock solution (fillable fraction) was calculated as a complement of the resin fraction. Lastly, the ratio of these resin fractions with respect to G1 was calculated (resin fraction G2 or G3 divided by resin fraction G1), which will be referred to as the resin fraction ratio. These values are crucial when designing multicompartment phantoms from 2 different gyroid representations (e.g., a kidney consisting of cortex and medulla).

Cuboid phantom. (A) Model components (3 gyroid cubes of different volume fraction ratios and shell consisting of 2 parts). (B) Cross-section through CAD model. (C) Cross-section through CT (gray scale) superimposed by CAD model (different colors). (D) Cross-section of SPECT reconstruction (48 iterations, 1 subset, and 10-mm postprocessing filter).
Calculation of Resin Fraction and Fillable Fraction for 3 Cuboid Structures, and Resin Fraction Ratio of G2 and G3 with Respect to G1
To combine the 3 cubic gyroid structures in a single phantom, a cuboid shell 4 × 4 × 12 cm3 in inner dimensions and with a 2-mm wall thickness was designed to enclose the 3 wall-less gyroid cubes (a top and a bottom part to be agglutinated after placing the gyroids inside; Fig. 2A). This shell included a funnel-shaped filling port. Finally, all parts were combined, and the model was exported in the stereolithography format.
All preparations for the 3D printing procedure (positioning, slicing, and addition of support structures) were performed in PreForm 3.8.0 (Formlabs), and printing was performed using a Form 2 printer with a layer thickness of 100 μm and the Clear V4 resin (both Formlabs).
Patient-Specific Kidney Phantom
To validate the methodology and demonstrate its potential to assess SPECT-based activity distributions obtained from patients undergoing 177Lu-based radionuclide therapies, we designed a set of patient-specific kidney phantoms, performed 177Lu SPECT/CT acquisitions with these phantoms, and compared the results with a clinical 177Lu SPECT/CT dataset of the same patient (acquired with the same setup and system). The kidney was chosen because it represents one of the most common organs at risk in radionuclide therapies (8–10).
The clinical validation was based on a peritherapeutic SPECT/CT dataset of a patient with metastatic castration-resistant prostate cancer who had undergone 177Lu-PSMA therapy at our institution (acquisition time, 24 h after injection). For design of a 2-compartment model with different activity concentrations in the cortex and medulla, high-resolution and high-contrast morphologic data were additionally needed. As the low-dose CT acquired along SPECT/CT scanning is not sufficient to reliably distinguish cortex and medulla, a temporally close contrast-enhanced CT acquisition (Siemens Biograph mCT 64; CT parameters, 0.78 × 0.78 × 1.00 mm3 resolution, 150 mAs, 100 kVp, pitch factor of 0.8, 512 × 512 × 866 slices) of the same patient was used. After anonymization (syngo.via; Siemens), the DICOM images were loaded into 3D Slicer 4.10.1 (11) for segmentation. First, the contrast-enhanced CT, which provided the anatomic information on the cortex and medulla, was registered to the low-dose CT scan of the peritherapeutic SPECT/CT acquisition using an affine registration. Then, slice-by-slice segmentations of the cortex and medulla of the left kidney were performed on the registered contrast-enhanced CT scan. These segmentations were exported in the stereolithography format for further processing (left column of Fig. 3A).

Design of patient-specific 2-compartment kidney phantom. (A) Boolean operations necessary to generate kidney CAD model out of patient-specific kidney VOIs, different gyroid and filling structures (example: G1 and G3 for cortex and medulla, respectively), attachment and filling ports, and patient-specific kidney shell. (B) 3D printed 1:7.5 kidney phantom. ∧ = Boolean “and”; ∨ = Boolean “or.”
To cover a range of different internal activity distributions, a set of 3 kidney phantoms with different combinations of internal gyroid structures was designed. Because the highest uptake is typically expected in the renal cortex, the cortex of all phantoms was filled with G1, that is, with the highest fillable fraction available. In contrast, the medulla was filled with a different gyroid representation (G1, G2, and G3) for each phantom, resulting in different resin fraction ratios (1:1, 1:3.55, and 1:7.44, respectively).
All gyroid compartments were constructed in Netfabb by Boolean operations between the segmentations and the gyroid structures (Fig. 3A). Subsequently, the 2 gyroid-filled compartments were combined with a kidney shell (wall thickness, 1 mm), as well as filling and attachment ports (Fig. 3A, center). Finally, the model was exported in the stereolithography format and 3D printed in one piece as described in the previous section (Fig. 3B).
Refinement of 3D Printed Phantoms and Quality Assurance
After printing, all phantoms were refined as follows: to remove excess resin, the phantoms were washed in 99.9% concentrated 2-propanol (IPA) for 180 min, followed by 60 min of ultraviolet curing at 60°C to reach the highest possible strength. Afterward, the support structures were manually removed. Finally, a polyamide M6 plastic thread and a filling funnel (to avoid air bubbles during filling) were glued on with a medium-viscosity 2-component epoxy adhesive.
For quality assurance, the finished phantoms underwent several quality tests. To check the agreement between the computer-aided design (CAD) model and the printed phantom, a high-resolution CT scan of the phantom was performed using the CT system integrated in our SPECT/CT system (Siemens Intevo Bold; CT parameters, 0.29 × 0.29 × 0.70 mm3 resolution, 150 mAs, 130 kVp, pitch factor of 0.5, 512 × 512 × 241 slices) and the CT images were compared with the CAD models.
As waterproofness is one of the most important prerequisites for nuclear medicine phantoms, the finished phantoms finally underwent leakage testing. In the same process, the filling volume of each phantom was determined by weighing the phantom before and after filling with a PCB 3500-2 precision mass scale (Kern and Sohn GmbH).
Activity Quantification of the Patient’s Kidney
To establish similar measurement conditions between the phantom measurements and the patient measurement, the total activities of the kidney phantom measurements were chosen to be as similar as possible to the patient kidney. For this purpose, the SPECT/CT-based activity in the left patient kidney 24 h after injection was determined by a volume-of-interest (VOI) analysis in the xSPECT Quant reconstructions (i.e., the mean of the activity concentration in a CT-based kidney VOI [Bq/mL], which had been enlarged by 6 mm to account for spill-out, multiplied by the VOI volume [mL] (12)). Activity concentrations for the stock solutions to be used in the 3 kidney phantoms were then calculated by dividing this total activity by the filling volume of each of the kidney phantoms (target activities and activity concentrations, along with the actually measured values, can be found in Table 2).
Activities and Activity Concentrations Measured with Regard to Patient-Specific Kidney Phantom Measurements
Quantitative SPECT/CT Imaging of the Phantoms
To ensure homogeneous solutions and prevent sticking (or plating) of activity to the walls of vessels being used, all stock solutions consisted of 177Lu-chloride dissolved in 0.1 M HCl with 100 ppm of stable lutetium (13). A VDC-405 radionuclide calibrator with a VIK-202 ionization chamber (Comecer SpA) was used for estimating the activity concentration during the phantom filling process. Subsequently, accurate activity concentrations were obtained by measuring 1-mL aliquots of all stock solutions (3 per stock solution) in a high-purity germanium (HPGe) detector (model GR4020 [Canberra] with GENIE 2000 spectroscopy software) whose energy-dependent efficiency had previously been calibrated with several National Institute of Standards and Technology–traceable and National Physical Laboratory–traceable standards over the energy range considered. The activity concentrations of the stock solutions were determined by weighing (full minus empty stock solution container) with a PCB 3500-2 precision balance (Kern and Sohn GmbH; readability, 0.01 g; repeatability, 0.02 g). In contrast, the aliquot volumes were weighed in an ED224S analytic balance (Sartorius AG) with a readability of 0.1 mg.
Subsequently, each phantom (cuboid and 3 kidneys) was filled with a different stock solution (target and measured activity concentrations are presented in Table 2). Again, the actual filling volume was determined by weighing (filled minus empty kidney phantom). Last, the phantoms were separately mounted in a water-filled Jaszczak cylinder (Data Spectrum; inside diameter and height of 216 mm and 186 mm, respectively) and SPECT/CT measurements were performed. To make the phantom data as comparable as possible to the patient data, the phantom acquisition was performed with the same acquisition parameters as used in the patient acquisition. In contrast, different reconstructions (different gaussian postfilters) were applied for phantom and patient data to assess the correspondence between the resulting activity distributions (“SPECT/CT imaging” section).
Activity Concentration–Voxel Histograms
To semiquantitatively compare the patient scan with the 3 patient-specific phantom scans, activity concentration–voxel histograms (the number of voxels containing a measured activity concentration plotted against the respective activity concentration) were calculated in MATLAB. After sorting the SPECT voxels according to their activity concentration, their subdivision into ranges of 0.01 MBq/mL resulted in the number of voxels within each of these activity concentration bins. Ideally, these histograms should consist of 2 distributions around the 2 activity concentrations of the stock solution.
RESULTS
Cuboid Phantom
Figure 2 shows the design, fabrication, and validation of the cuboid phantom. The superimposition of the CAD model and the CT image in Figure 2C especially emphasize the good visual match between model and printed phantom. The SPECT reconstruction in Figure 2D shows apparently different yet homogeneous activity distributions in each of the 3 compartments, demonstrating that the dimension of the filling structures is in an adequate range for SPECT/CT imaging with a medium-energy collimator.
Figure 4 illustrates the SPECT-based activity distribution inside the gyroid. To avoid resolution effects along the phantom edges, the averages within 2 × 2 cm2 square regions of interest were calculated for the axial slices and plotted along the axis of the 4 × 4 × 12 cm3 cuboid phantom. In general, the edges are clearly underestimated because of partial-volume effects (e.g., between axial positions 0 and 8 mm). In contrast, the activity is overestimated in the central area when no or 10-mm postfiltering is applied (solid lines). For the wider 20-mm postprocessing filter, however, the activity is increasingly spilled out of the actual object dimensions (dashed lines), leading to an underestimation of the total activity.

Quantitative analysis of cuboid. Depicted is the mean activity concentration in square regions of interest plotted in axial direction for different reconstruction parameters (number of iterations and postfilters). Positioning of axial regions of interest is illustrated at the top right by red boxes in the SPECT reconstruction. Solid black vertical lines represent borders between different gyroid cubes. Dashed black rectangles indicate axial position of 2 × 2 × 2 cm3 cubes used for the quantitative analysis (height of each box = HPGe-based activity concentration).
In a quantitative analysis of the cuboid reconstructions (2 × 2 × 2 cm3 VOIs as indicated in Fig. 4), the best match between HPGe- and SPECT-based activity was found for reconstructions with a 10-mm gaussian postprocessing filter (Table 3). Here, the nominal activity concentration in each of the gyroids was calculated by multiplying the HPGe-based activity concentration of the stock solution (0.69 ± 0.01 MBq/mL) by the fillable fraction of the corresponding gyroid (Table 1).
Quantitative Evaluation of Different Gyroid Structures Inside Cuboid Phantom
Patient-Specific Kidney Phantom
Figure 5 shows design and validation of the 3 patient-specific 2-compartment kidneys. At the bottom of Figure 5, the phantom and the patient CT images were superimposed to emphasize the good match between the outer contours and the internal compartments for all 3 phantoms. No filling structures were used in the top sections of each phantom to simplify the filling process (green arrows). In addition, the renal pelvis was printed as a solid structure to ensure good printing quality (light blue regions in the CAD models in the center row of Fig. 5). The linear attenuation coefficient of our 177Lu SPECT/CT setup was determined as 0.148 ± 0.001 cm−1 in a VOI analysis of this solid structure in the associated μ-map.

Design and validation of patient-specific kidney phantoms. (Top, left to right) Coronal contrast-enhanced CT slice of patient kidney; segmented cortex (red) and medulla (green); and 3D model of segmentation. (Center) Cross-sections through CAD models (green arrows: top sections without internal structure) for all 3 phantom designs (grid dimension, 1 cm). (Bottom) Contrast-enhanced patient CT (grayscale) overlaid with CT of phantom kidney (yellow) for all 3 phantom designs. CE = contrast-enhanced.
Figure 6 shows fused SPECT/CT images of the patient (top) and the 3 phantom acquisitions (bottom). Although the 1:1 phantom visually overestimates the activity concentration in the medulla (green arrows), good visual agreement is obtained for the 1:3.5 phantom. The wide 20-mm filter strongly blurs the image, such that the difference between cortex signal and medulla signal becomes difficult to assess visually. The 1:3.5 phantom with moderate filtering (10-mm gaussian) leads to the best visual match.

SPECT/CT fusions of patient acquisition and 3 phantoms (resin fraction ratios of 1:1, 1:3.5, and 1:7.5) for different postfilters (left to right: 0, 10, and 20 mm). Green arrows indicate overestimation of activity concentration in medulla for resin fraction ratio 1:1. Blue arrows indicate surface tension–related air bubbles.
Table 2 shows all activities and the activity concentrations measured with regard to the patient-specific kidney phantom measurements. The table shows the filling volume (i.e., the volume filled with radioactive stock solution), the target activity concentration (based on the SPECT-based activity in the patient kidney), and the HPGe-based activity concentration and total kidney activity (the activity concentration multiplied by the filling volume), as well as the medulla and cortex activity concentrations (the stock solution activity concentration multiplied by the fillable fraction of the respective kidney phantom given in Table 1) and the SPECT-based total activities (VOI analysis based on the phantom filling volume). All total kidney activities lie within 10% of the SPECT-based total kidney activity of 94.9 MBq and thus are close enough to provide equivalent measurement conditions. As the resolution lies in the range of the medulla size, considerable spill-out and spill-in is to be expected between the cortex and the medulla. In consequence, a separate evaluation of both compartments based on the SPECT scan is extremely prone to errors and was not performed.
SPECT-based activity concentration–voxel histograms (“Activity Concentration–Voxel Histograms” section) are given in Figure 7. The patient data are plotted in black, and each phantom is indicated by a different color (red, 1:7.5; blue, 1:3.5; green, 1:1). The curves depict the number of voxels (vertical axis) containing a certain activity concentration (horizontal axis, bin width of 0.01 MBq/mL), and vertical dashed lines indicate the theoretic (HPGe-based) activity concentrations in the medulla and cortex (the values are given in Table 2). Ideally, the histogram should consist of activity distributions around these dashed lines. For the 1:1 phantom, there is only a single vertical green line, as both compartments have the same filling structure and, therefore, activity concentration. As expected, the postfilters smooth higher-activity concentration peaks, resulting in a shift toward lower activity concentrations in the filtered histograms (e.g., Fig. 7C). For the 1:7.5 resin fraction ratio (red), the peaks of the unfiltered and 10-mm gaussian curves lie in the range defined by the two theoretic activity concentrations, whereas the 20-mm gaussian filter leads to an underestimation. For the 1:3.5 resin fraction ratio (blue), the 10-mm gaussian filter leads to an activity concentration peak between the two theoretic values. In contrast, no filtering or a 20-mm gaussian filter results in an over- or underestimation, respectively, of the theoretic activity concentrations. For the 1:1 resin fraction ratio (green), good quantitative agreement is found for the 10-mm postprocessing filter, with the SPECT-based activity concentration peak centered exactly on the HPGe-based activity concentration. Although the 20-mm gaussian filter leads to the previously described underestimation, not applying any filter leads to a wide spectrum of activity concentrations (e.g., a maximum activity concentration up to 2 times higher than the theoretic value). In contrast to the colored phantom curves, all of which exhibit a maximum, all patient curves (black) are monotonically decreasing.

Activity concentration–voxel histograms for patient (black) and 3 phantoms (red, 1:7.5; blue, 1:3.5; green, 1:1) for 48 iterations, 1 subset, and gaussian postfilters of 0 mm (A), 10 mm (B), and 20 mm (C) in full width at half maximum. While solid curves depict number of voxels containing certain activity concentration, vertical dashed lines indicate HPGe-based activity concentrations in medulla and cortex (values are presented in Table 2).
DISCUSSION
One of the main problems in the clinical validation of quantitative SPECT/CT is the lack of a ground truth in patient measurements. Depending on the image reconstruction applied, a wide variety of different spatial activity distributions can be generated without knowledge of the ground truth (7), as can be seen in Figure 7 (black lines). This observation demonstrates that an assessment of the activity distribution on a voxel level, based purely on SPECT/CT imaging, is problematic (7) and that, for validation, additional methods such as the measurement of realistic, ideally patient-specific, phantoms should ideally complement the image quantification process. Up to now, the complexity of phantom measurements has been restricted by the availability of phantoms. Multicompartment phantoms usually consisted of separate compartments filled with radioactive stock solutions of different activity concentrations, thus considerably increasing the sources of uncertainty. As a major advance, the approach proposed in this work achieves to mimic inhomogeneous activity distributions in SPECT/CT with only one single fillable compartment by making use of internal gyroid structures of different volume fractions, considerably simplifying phantom preparation and reducing uncertainties.
In addition, the new method represents another important advance: while it was previously impossible to achieve continuous transitions of activity concentrations, this is changed by the introduction of filling structures of different volume fractions. If further developed, multiple thin gyroid layers of different wall thicknesses could be placed adjacent to each other to achieve continuously varying apparent activity concentrations while still requiring only a single stock solution. This development could take the individualization of phantoms to an unprecedented new level.
In comparison to standard, single-compartment phantoms, the gyroid structure features a large surface area with many very small congruent channels. These lead to an increased occurrence of surface tension–related air bubbles in these regions, resulting in small black regions in the CT scan (blue arrows in Fig. 6). This problem can, however, be considerably improved by reducing the surface tension of the stock solution, such as by adding soapy water. Through the addition of soap in our stock solutions, only a few air bubbles remained in the phantoms imaged in this work (e.g., Fig. 6).
Another subject to be discussed is the printing process. To keep the wall as thin as possible (e.g., a 0.4-mm thickness for the renal cortex gyroid structure), we applied a stereolithography-based 3D printing technique based on a photopolymer resin hardened layer by layer using an ultraviolet laser beam. The relatively large maximum unsupported overhang length of 3 mm allowed the entire kidney phantom to be printed as one part, in contrast to the previously used fused deposition modeling technique, by which the phantoms had to be printed in several individual parts (3,5,7). However, the techniques require that excess, uncured resin escapes the gyroid structure—a requirement that, because of the low viscosity of the resin, can be problematic for thick-walled gyroids. For our Form 2 printer, our standard period of 4π⋅mm with a wall thickness of 0.40–2.65 mm resulted in a realistic range of activity concentration ratios between the renal medulla and the cortex (1:1–1:8 (1,7)). Provided that careful modeling and positioning of the CAD models were done before 3D printing, reliable printing was possible even for the thickest walls of 2.65 mm thickness.
For validation, the model was tested using a patient-specific 2-compartment kidney model. A direct quantitative comparison between phantom and patient images by conventional means (e.g., using measures such as the structural similarity index) is almost impossible because of the isolated nature of the phantom in comparison to the patient kidney, which is surrounded by anatomic structures. To perform at least a semiquantitative evaluation, a histogram analysis (Fig. 7) was applied to illustrate the differences. Because an in-depth analysis of the difference between activity distributions and absorbed dose distributions for 177Lu demonstrated virtually no differences in their spatial distributions in a previous study (7), we considered only the activity concentration in this work.
Because of the unevenly shaped interface between the cortex and the medulla in combination with the SPECT resolution, which is unable to resolve the gyroid channels, the two theoretic peaks (vertical dashed lines) merge into a single peak in the SPECT/CT-based distribution of activity concentrations (Fig. 7). In contrast, all patient curves (black lines) are monotonically decreasing, indicating that the underlying activity distribution in the patient kidney is more heterogeneous than the distribution modeled by the two compartments in this study.
Given the numerous potential differences between any patient and phantom measurement (e.g., different scatter environments, different contouring of the camera, potential background radiation in the patient, and patient motion) affecting SPECT/CT-based quantification, some discrepancy between patient and associated phantom measurements is always to be expected. Considering this, the degree of similarity between patient and phantom (Fig. 6, center column) can be considered to be close to the maximum achievable. For this reason, we provide an analysis of only three example postfilters instead of trying to find the best combination of iterations, subsets, and postprocessing filter.
The routine application of dosimetry to optimize the efficacy of radionuclide therapies, and thus the need for a routine patient-specific validation of quantitative SPECT/CT imaging, currently still seems to be some way ahead. If internal individualized dosimetry becomes established, however, the methodology presented here could form the basis for a patient-specific optimization of quantitative SPECT/CT imaging (e.g., regarding imaging and reconstruction parameters). Provided that there is a certain quality level of SPECT/CT-based dose–voxel histograms, such quantitative measures could form a cornerstone for planning and monitoring of individualized radionuclide therapies, as it is already standard in external-beam radiotherapy.
CONCLUSION
We have shown that the use of internal support structures allows phantom measurements of inhomogeneous activity distributions using only a single stock solution of a single activity concentration. By keeping the dimensions of the filling structures well below the resolution of the imaging system, we were able to mimic the internal activity distribution in the kidney of a patient treated with 177Lu-PSMA (24 h after injection for SPECT/CT). In a quantitative analysis, however, it was shown that a representation of the kidney by only two compartments (renal cortex and medulla) of different apparent activity concentrations still represents an oversimplification. For an even better representation, more different compartments would be required.
DISCLOSURE
This study was funded by a grant from the German Research Foundation (Deutsche Forschungsgemeinschaft TR 1380/1-1). Michael Lassmann has received research grants by IPSEN Pharma and Nordic Nanovector. No other potential conflict of interest relevant to this article was reported.
KEY POINTS
QUESTION: Is it possible to design patient-specific kidney phantoms with only a single fillable compartment yet an inhomogeneous activity distribution for assessment of SPECT/CT-based peritherapeutic monitoring of radiopharmaceutical distributions?
PERTINENT FINDINGS: Using the presented methodology, we achieved production of a patient-specific kidney phantom for a patient with metastatic castration-resistant prostate cancer, visually and quantitatively mimicking a peritherapeutic SPECT/CT acquisition 24 h after injection of 177Lu-PSMA. Despite the restriction to only a single compartment for ease of phantom preparation, an inhomogeneous activity distribution in the patient SPECT/CT scan could be reproduced.
IMPLICATIONS FOR PATIENT CARE: The presented methodology enables a patient-specific assessment of activity distributions, and thus absorbed dose depositions, in organs at risk in radionuclide therapy.
Footnotes
Published online Nov. 18, 2021.
- © 2022 by the Society of Nuclear Medicine and Molecular Imaging.
REFERENCES
- Received for publication July 19, 2021.
- Revision received November 1, 2021.
In this issue


Jump to section
Related Articles
Cited By...
- No citing articles found.