


Visual Abstract

Abstract
In diffuse large B-cell lymphoma, early assessment of treatment response by 18F-FDG PET may trigger treatment modification. Reliable identification of good and poor responders is important. We compared 3 competing methods of interim PET evaluation. Methods: Images from 449 patients participating in the “PET-Guided Therapy of Aggressive Non-Hodgkin Lymphomas” trial were reanalyzed by applying the visual Deauville score and the SUV-based qPET (q = quantitative) and ΔSUVmax scales to interim PET scans performed after 2 cycles of chemotherapy. qPET relates residual lymphoma 18F-FDG uptake to physiologic liver uptake, converting the ordinal Deauville scale into a continuous scale and permitting a direct comparison with the continuous ΔSUVmax scale, which is based on SUVmax changes between baseline and interim scans. Positive and negative predictive values were calculated for progression-free survival. Results: When established thresholds were used to distinguish between good and poor responders (visual Deauville score 1–3 vs. 4–5; ΔSUVmax > 66% vs. ≤ 66%), the positive predictive value was significantly lower with Deauville than ΔSUVmax (38.4% vs. 56.6%; P = 0.03). qPET and ΔSUVmax were strongly correlated on the log scale (Pearson r = 0.75). When plotted along corresponding percentiles, the positive predictive value curves for qPET and ΔSUVmax were superimposable, with low values up to the 85th percentile and a steep rise thereafter. The recommended threshold of 66% SUVmax reduction for the identification of poor responders was equivalent to qPET = 2.26, corresponding to score 5 on the visual Deauville scale. The negative predictive value curves were also superimposable but remained flat between 80% and 70%. Conclusion: Continuous scales are better suited for interim PET–based outcome prediction than the ordinal Deauville scale. qPET and ΔSUVmax essentially carry the same information. The proportion of poor-risk patients identified is less than 15%.
Diffuse large B-cell lymphoma (DLBCL) is the most frequent cancer of the immune system (1). It is cured in about two thirds of patients (2). Treatment response is among the most important factors determining outcome. Remissions are more durable in rapid than slow responders, as was demonstrated first by CT (3) and later by PET using the tracer 18F-FDG (4,5). To adapt treatment to treatment response, reliable identification of good and poor responders is of the utmost importance.
Current guidelines recommend the Deauville scale for PET-based evaluation of early treatment response (6). This scale is based on a visual comparison of residual lymphoma-related uptake with areas of physiologically increased activity, such as in the mediastinal blood pool or liver (7). At the present time, any residual uptake exceeding that of the liver is considered a poor metabolic response.
A drawback of the Deauville scale is its ordinal nature, with no more than 5 response categories. An alternative way of evaluating interim scans is a quantitative comparison of the SUVmax before and during treatment. The ratio between the 2 values (ΔSUVmax) results in a continuous scale, which can be dichotomized to distinguish between good and poor responders (8). In DLBCL, thresholds of 66% SUVmax reduction after 2 cycles of rituximab, cyclophosphamide, doxorubicin, vincristine, and prednisone (R-CHOP) and 73% after 4 cycles of R-CHOP lead to maximum separation of the survival curves of good and poor responders (8–11).
The SUVmax method requires both baseline and interim PET scans. To restrict interim analysis to a single scan while maintaining the advantage of a continuous scale, we developed the qPET method (q = quantitative) where the SUVmean of the 4 most intense connected voxels of residual lymphoma-related uptake are put into relation with the SUVmean of a large volume in the liver. Pioneered in Hodgkin lymphoma, this approach converted the ordinal Deauville scale into a well-defined quantitative scale (12–14).
The goal of the present study was to apply the qPET approach to DLBCL and compare it with the visual Deauville scale and the ΔSUVmax method. To this end, we reanalyzed the data of the “PET-Guided Therapy of Aggressive Non-Hodgkin Lymphomas” (PETAL) trial, which set out—and failed—to improve treatment by adapting it to the response to the first 2 cycles of R-CHOP (15). Because none of the PET-driven treatment changes had an impact on outcome compared with standard R-CHOP, all treatment arms were combined for this analysis.
MATERIALS AND METHODS
Study Design
The PETAL trial (ClinicalTrials.gov NCT00554164; EudraCT 2006-001641-33) was a multicenter study for newly diagnosed aggressive non-Hodgkin lymphomas (15). The study was approved by the Federal Institute for Drugs and Medical Devices and the ethics committees of all participating sites. All patients gave written informed consent, including permission to use their data for post hoc scientific analyses.
Patients were treated with biweekly R-CHOP, with a 3-wk interval between cycles 2 and 3 to prevent false-positive results at interim staging uniformly performed after cycle 2. Patients with a favorable interim PET response received 4 more cycles of R-CHOP or the same treatment plus 2 extra doses of rituximab. Patients with an unfavorable response were randomly assigned to receive 6 additional cycles of R-CHOP or 6 blocks of a more intensive Burkitt lymphoma protocol (15).
PET/CT Imaging and Evaluation
Imaging conditions have been described previously (15). Baseline and interim scans (median chemotherapy-free interval, 20 d) were evaluated by local investigators using the ΔSUVmax method. Scans were then pseudonymized and transferred to a central server for reanalysis, including verification of the ΔSUVmax findings and evaluation according to the Deauville criteria by experienced nuclear medicine physicians (15).
In the present analysis, archived images were reanalyzed by a single physician (>10 y of working experience, >5,000 evaluated PET scans from lymphoma patients) using 3 different methods of interim scan evaluation. To ensure that visual Deauville scoring was not affected by quantitative measurements, assessment by purely visual criteria was performed before qPET and ΔSUVmax. The results were compared with the reports of the initially involved physicians (15), and any inconsistencies were resolved by further image evaluation taking account of clinical data available at the time of the first analysis. Discrepant results will be the subject of a future report.
The Deauville scale comprises 5 categories, which are defined as score 1, no residual uptake; 2, residual uptake not exceeding mediastinal uptake; 3, residual uptake above mediastinal but not exceeding liver uptake; 4, residual uptake above liver uptake; and 5, residual uptake markedly above liver uptake or new lesions (7). qPET was calculated by dividing the SUVmean of the 4 hottest connected voxels (SUVpeak) of the hottest residual lesion by the SUVmean of a 30-cm3 volume of interest in the right lobe of the liver (12). ΔSUVmax was determined by dividing the SUVmax of the hottest residual lesion on the interim scan by the SUVmax of the hottest lesion on the baseline scan (8).
Statistical Analysis
The endpoint of the current analysis was progression-free survival, defined as the time from interim PET scanning to disease progression, relapse, or death from any cause, subsequently referred to as treatment failure. Progression and relapse were defined by clinical and imaging criteria and confirmed by biopsy in most cases. For simplicity, we treated progression-free survival as a binary variable (events within 60 mo). This decision appeared justified because, in DLBCL, most events occur within the first 2 y (16) and, with a median follow-up of 52 mo, the data were mature (15).
We plotted empiric cumulative distribution functions of qPET by visual Deauville scores and used receiver-operating-characteristic (ROC) analysis and the Youden index to derive plausible thresholds between individual scores of the visual scale. These cutoffs were compared with the thresholds found in a study with nearly 900 pediatric Hodgkin lymphoma patients (12).
With regard to ΔSUVmax, we used 1 − ΔSUVmax, that is, the remaining proportion of maximum 18F-FDG uptake. This method allowed us to use the log scale (no negative values) and ensured the correlation with qPET to be positive. The area under the ROC curve was used to quantify the prognostic value of interim scanning. All analyses were performed using R, version 3.5.1 (R Core Team).
RESULTS
Patient Characteristics
Of 862 patients treated in the PETAL trial, 609 had DLBCL (15). Baseline and interim PET scans for post hoc analyses were available from 449 patients. In 65 cases, the scans were not transferred to the central server; in 75, the transferred data were incomplete; and in 20, quantitative evaluation was not possible for technical reasons.
The baseline features and treatment results of the subgroup studied here were similar to the subgroup excluded from the analysis and the entire DLBCL population of the PETAL trial (Table 1, Supplemental Table 1, and Supplemental Fig. 1 [supplemental materials are available at http://jnm.snmjournals.org]; no statistically significant differences).
Baseline Characteristics of Patients Included in Present Analysis in Comparison to Excluded Patients and All DLBCL Patients Participating in PETAL Trial
Response Assessment
Among the 449 patients included in this study, 117 (26.0%) were assigned to visual Deauville score 1, 42 (9.4%) to score 2, 113 (25.2%) to score 3, 120 (26.7%) to score 4, and 57 (12.7%) to score 5.
Patients with a visual score of 1 (n = 117) had a qPET value of zero, because the interim scan showed no measurable lymphoma-related activity. The qPET distribution of the 332 scans with measurable activity was symmetric on the log scale, with some outliers (representing poorly responding patients) on the right, and a mode (most frequent value) near 1.3 (Fig. 1A).
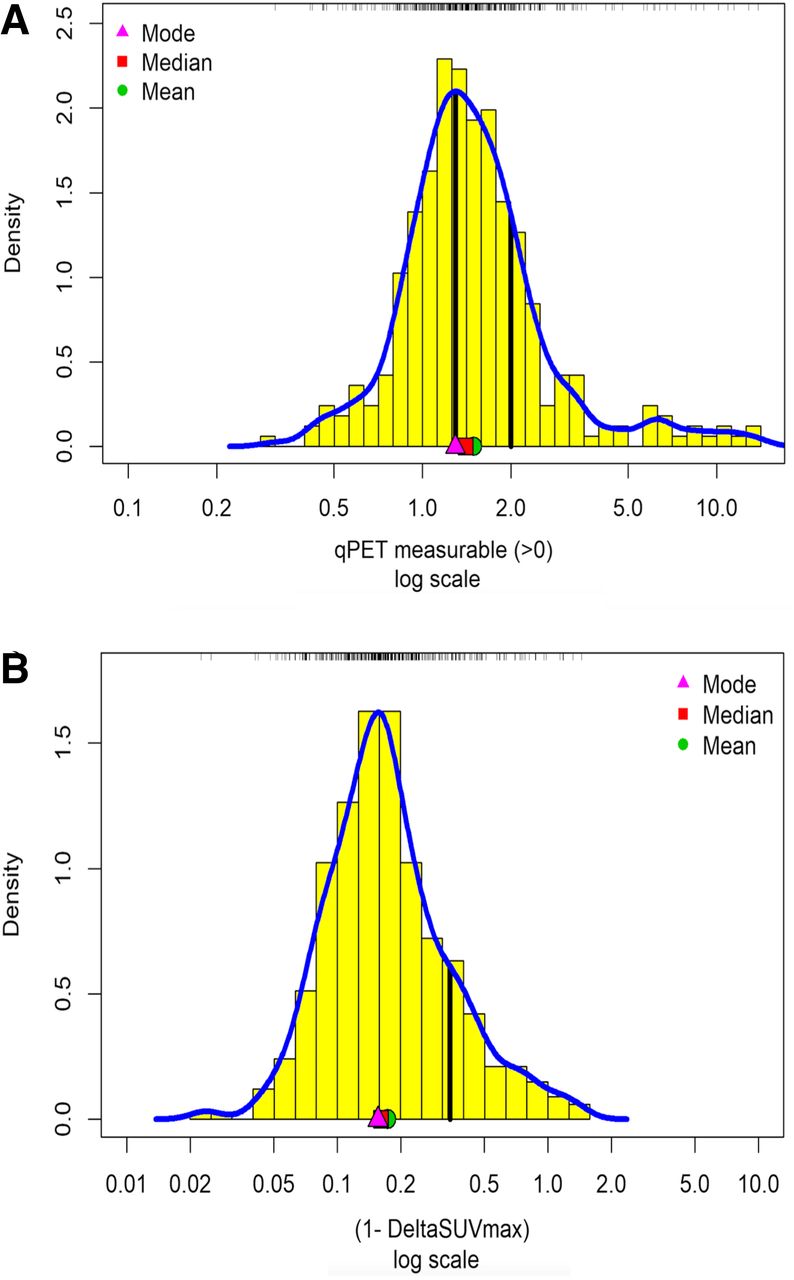
Density histograms for patients with measurable residual uptake at interim PET scanning (n = 332) evaluated by qPET (A) or ΔSUVmax (B) on log scale. First and second vertical lines in A indicate published thresholds between visual Deauville scores 3 and 4 (1.3) and 4 and 5 (2.0), respectively. ΔSUVmax in B is expressed as 1 − ΔSUVmax; vertical line indicates published threshold of 0.66, here 1–0.66 = 0.34.
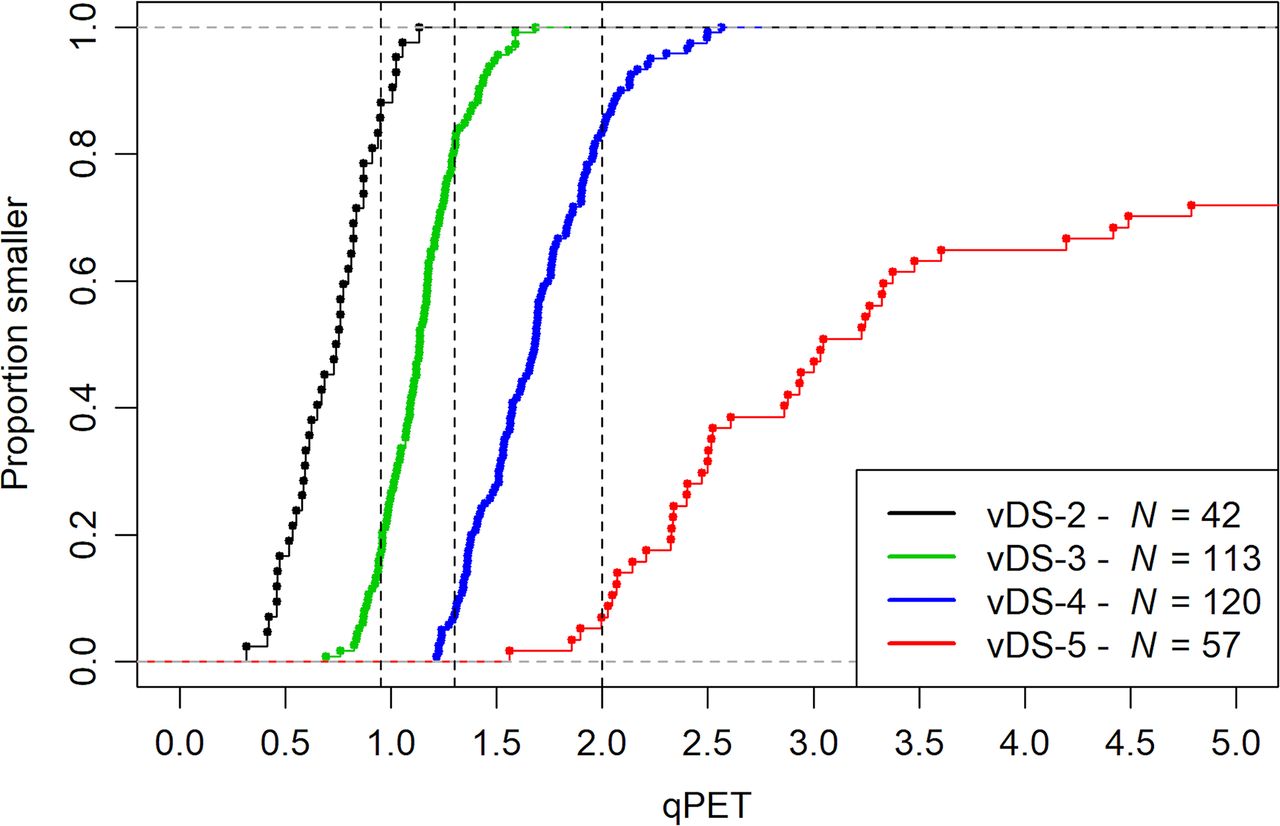
qPET measurements within a single visual score category were well separated (Fig. 2). Some overlap was observed between neighboring categories, particularly between scores 3 and 4, which were located near the mode of the distribution. Optimal qPET thresholds between individual visual categories were 0.87 for the distinction between scores 2 and 3, 1.31 for scores 3 and 4, and 2.02 for scores 4 and 5, confirming the thresholds previously determined in pediatric Hodgkin lymphoma (0.95, 1.3, and 2.0, respectively) (12). These thresholds allow translation of qPET measurements into quantitative Deauville scores (1, qPET not measurable; 2, qPET measurable, but <0.95; 3, qPET 0.95 to <1.3; 4, qPET 1.3 to <2.0; 5, qPET ≥ 2). The concordance between visual and quantitative scores was 82.4% (Table 2).

Empirical cumulative distribution functions of qPET measurements by visual Deauville categories. Vertical lines indicate published thresholds to map qPET values to individual categories. vDS = visual Deauville score.
Comparison of Visual and Quantitative Deauville Scores
As for ΔSUVmax, 100% SUVmax reduction was found in 117 patients. In the remainder, the distribution of measurable 1 − ΔSUVmax resembled the qPET distribution, with symmetry on the log scale, outliers on the right, and a mode at 0.156 corresponding to 84.4% SUVmax reduction (Fig. 1B).
Outcome Prediction
Using the recommended thresholds for the visual Deauville scale (scores 1–3 vs. 4–5) and the quantitative ΔSUVmax scale (>66% vs. ≤66% SUVmax reduction) to distinguish between good and poor responders, the positive predictive values were 38.4% and 56.6% (P = 0.03) and the negative predictive values were 75.4% and 73.5%, respectively. Raising the threshold to score 5 (vs. 1–4) of the Deauville scale improved the positive predictive value, with a concomitant decrease in the proportion of high-risk patients (Table 3).
Positive and Negative Predictive Values and Proportion of High-Risk Patients Identified by Interim PET: Comparison of Methods and Thresholds
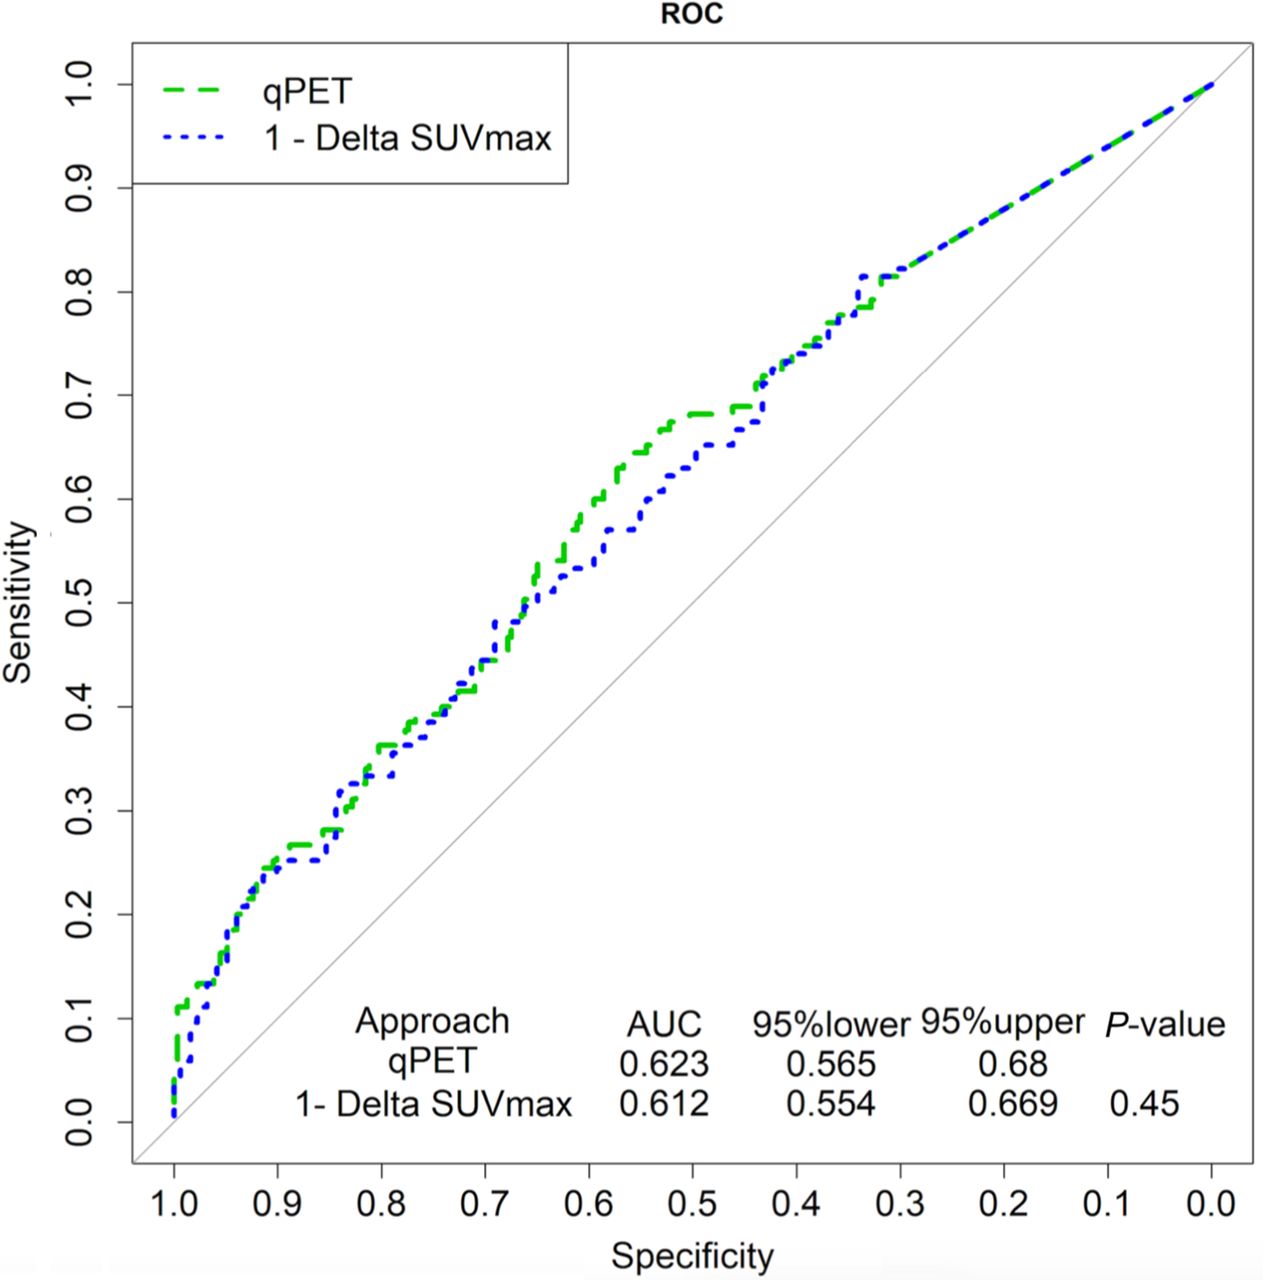
Treatment responses measured by qPET and ΔSUVmax were highly correlated on the log scale (Pearson r = 0.75; 95% CI, 0.70–0.80), suggesting that the methods provided similar information (Fig. 3). Neither of them reliably distinguished between patients in continued remission and patients who progressed, relapsed, or died, except at very high qPET and 1 − ΔSUVmax, where patients experiencing treatment failure were enriched. The similarities between qPET and ΔSUVmax were confirmed by ROC analysis yielding superimposable curves (Fig. 4). The area under the ROC curve was low for both methods (0.623 and 0.612, respectively), consistent with limited overall prognostic value.
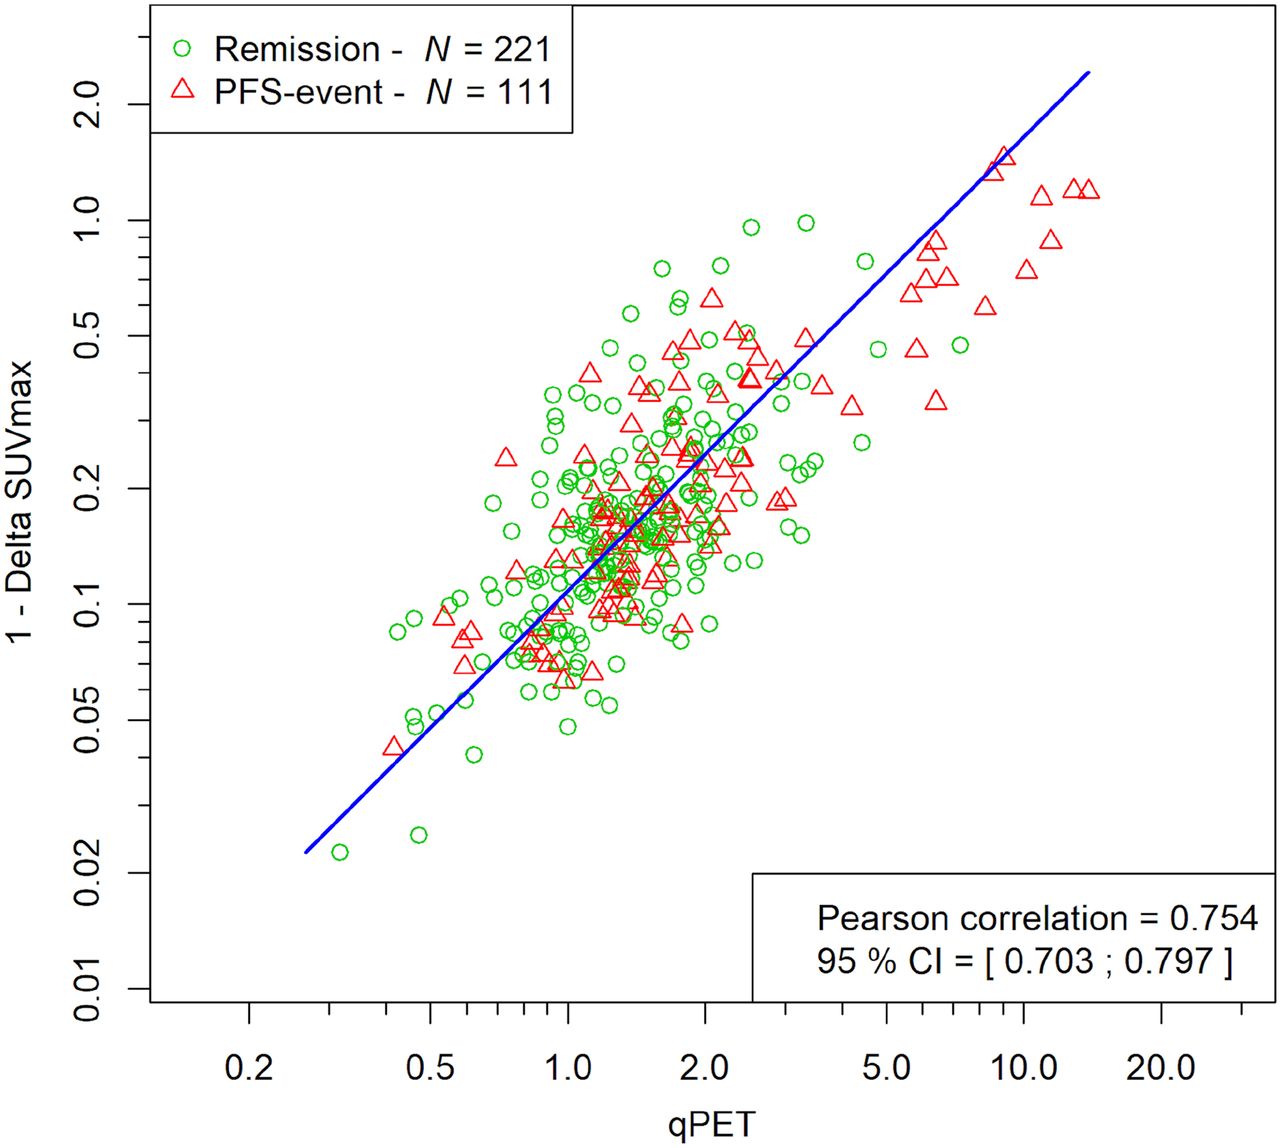
Scatterplot of qPET and ΔSUVmax. Triangles refer to patients experiencing treatment failure, whereas circles refer to patients who remained in remission. Blue line is the principal axis illustrating correlation. PFS = progression-free survival.

ROC curves of qPET and 1 − ΔSUVmax for progression-free survival.
To compare the positive and negative predictive values of qPET and ΔSUVmax at comparable thresholds, the values were plotted along their respective percentiles. Again, the curves were superimposable (Fig. 5). The positive predictive value was low up to the 85th percentile, followed by a steep increase (Fig. 5A). The negative predictive value curves remained flat between 80% and 70% (Fig. 5B).

Positive predictive value (A) and negative predictive value (B) of corresponding percentiles of qPET and ΔSUVmax measurements. Constant part of curves at low percentiles is due to inclusion of nonmeasurable values set at zero (n = 117).
Corresponding percentiles were used to translate between the ordinal Deauville scale and the qPET and ΔSUVmax scales. Table 4 displays the clinically relevant thresholds on the visual 5-point scale and the 66% SUVmax reduction threshold on the ΔSUVmax scale, which identifies patients with a high risk of treatment failure.
Selected Corresponding Thresholds in Categoric and Continuous Interim PET Response Scales
Outcome According to Prognostic Group
Figure 6 shows the progression-free survival of patients categorized according to the Deauville scales (5 categories) or the ΔSUVmax scale, which was divided into 3 categories (SUVmax reduction by 100%, <100 to >66%, and ≤66%). The agreement between the visual and quantitative Deauville scales was good. Progression-free survival did not differ between scores 2, 3, and 4, whereas score 5 was associated with significantly worse outcome (visual scale: hazard ratio [HR] of 2.56 and 95% CI of 1.68–3.90, P < 0.0001; quantitative scale: HR of 2.52 and 95% CI of 1.71–3.73, P < 0.0001), similar to an SUVmax reduction of 66% or less on the ΔSUVmax scale (HR of 3.27 and 95% CI of 2.16–4.96, P < 0.0001).
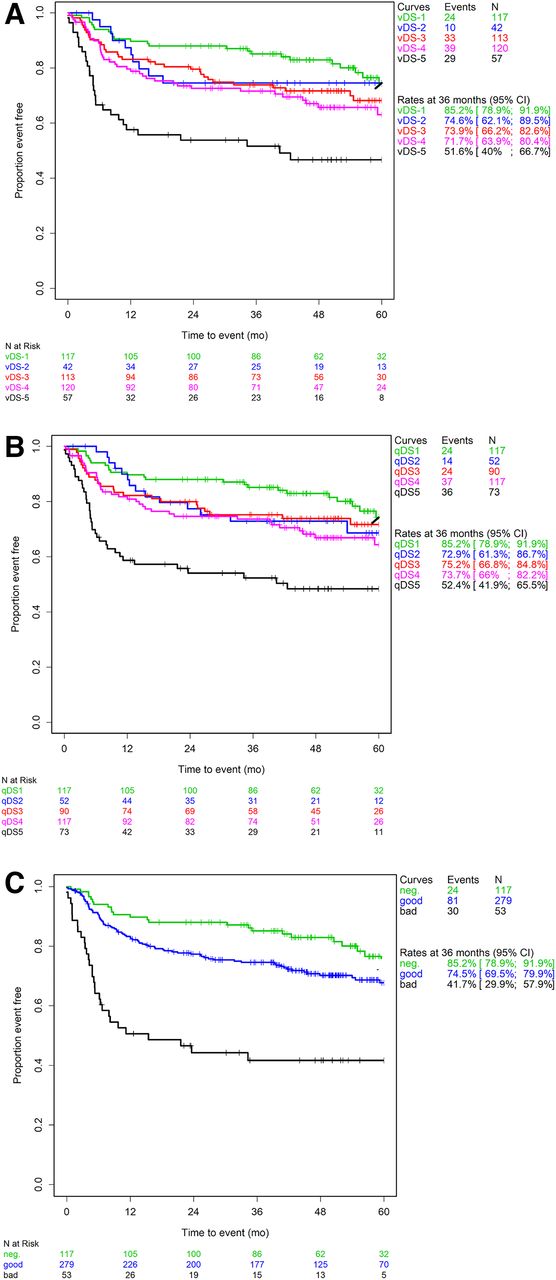
Progression-free survival in prognostic subgroups derived from visual Deauville scale (A), quantitative Deauville scale (B), or ΔSUVmax scale (C) (Kaplan–Meier analysis). vDS = visual Deauville score; qDS = quantitative Deauville score.
Patients with complete normalization of the interim scan (Deauville score 1, 100% SUVmax reduction) tended to have a better outcome than patients with a good response but residual activity. This observation was of borderline statistical significance (visual Deauville scale: HR of 1.63 and 95% CI of 1.03–2.60, P = 0.036; quantitative Deauville scale: HR of 1.57 and 95% CI of 0.98–2.51, P = 0.054; ΔSUVmax scale: HR of 1.57 and 95% CI of 0.99–2.51, P = 0.051).
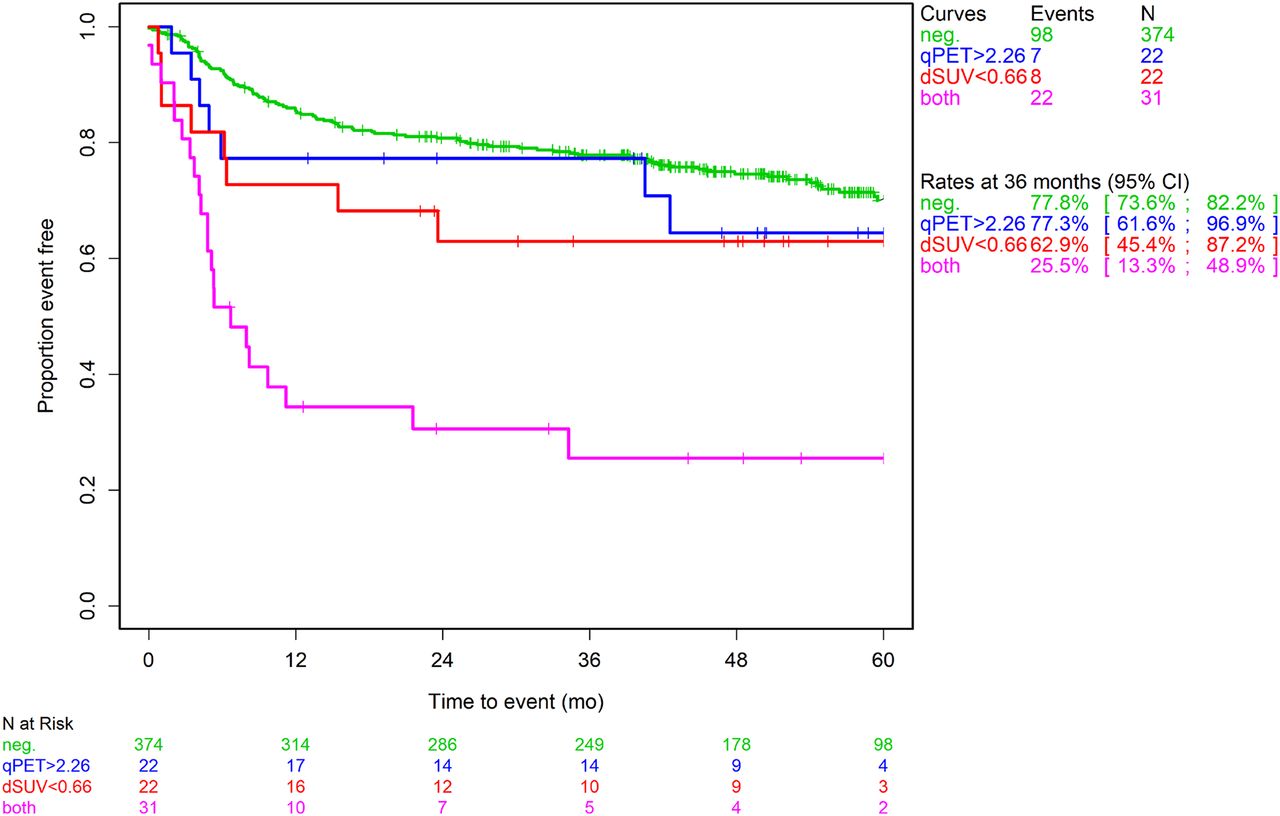
The 66% ΔSUVmax threshold identified a high-risk group comprising 13% of the total PETAL trial population (Fig. 5A) (15). The equivalent qPET value of 2.26 detected the same percentage but not the same individuals. Of 75 high-risk patients, 31 were tested positive by both methods, whereas 22 each were tested positive only by qPET or ΔSUVmax. Single-positive patients had a better outcome than double-positive patients (P = 0.0011). In our interpretation, qPET and ΔSUVmax are different methods measuring the same response concept, that is, replicates with independent measurement errors. Taking the average of the percentiles to reduce measurement errors, the mean percentiles were 0.47 for double-negative patients, 0.83 for single-positive patients, and 0.95 for double-positive patients (P < 0.0001). Thus, the observed outcomes (Fig. 7 corresponded to what was expected from the superimposable curves shown in Figure 5A.

Progression-free survival in patients with good interim PET response according to both qPET and ΔSUVmax, only qPET, or only ΔSUVmax, or with poor interim PET response according to both methods (Kaplan–Meier analysis). dSUV = ΔSUVmax.
DISCUSSION
The main result of our study is that, in DLBCL, qPET carries the same prognostic information as ΔSUVmax. The ROC and predictive value curves as a function of percentiles were superimposable. Thus, the methods can be used interchangeably. Combining them may help in individual cases, but only to reduce measurement errors by averaging.
The results obtained with both quantitative methods imply that the currently recommended threshold to identify high-risk patients by virtue of the visual Deauville scale (score 1–3 vs. 4–5) is of limited value. This conclusion complements our previous finding that ΔSUVmax is superior to Deauville for interim PET–based outcome prediction when recommended thresholds are used (17). A cut-off between scores 4 and 5 of the visual scale may be more appropriate, in particular when interim PET is used to select patients for more aggressive therapies. The current definition of Deauville score 5, however, is imprecise (7). Therefore, a better alternative is using a quantitative scale.
The visual Deauville scale is easy to use, but standardization remains difficult because of physiologic limitations of the human eye. The perception of light intensity depends on the surrounding background. In addition, any visual comparison is compounded by the distance between the areas of interest. Therefore, the reproducibility of visual assessments remains limited (18–20). The qPET method circumvents these problems because it relies on objective measurements rather than subjective impressions. Perhaps more importantly, it converts the Deauville categories into a continuous scale, allowing the definition of risk groups independent of the somewhat arbitrary thresholds of the visual scale. qPET is similar to rPET (r = ratio), which compares the SUVmax, that is, the single most intense voxels, in residual lymphoma and liver. In 2 small studies evaluating rPET after 2 cycles of R-CHOP, the best threshold for prognostic dichotomization was determined to be 1.4 or 1.6 times the SUVmax of the liver (21,22). After 1 or 4 treatment cycles, the most appropriate thresholds were 3.1 or 1.4 times the liver SUVmax, respectively (20,23). Advanced image reconstructions, however, may overestimate SUVmax compared with SUVpeak and SUVmean (24). We therefore chose the SUVmean of a large volume within the liver as the reference standard, and we chose a very small SUVpeak volume, comprising a low number of connected voxels, to represent the residual lymphoma lesion (12). Because of the systemic nature of DLBCL, its often rapid response to therapy, and the small size of posttreatment remnants, larger SUVpeak volumes commonly used in solid tumors appeared less suitable.
ΔSUVmax is more firmly established for quantitative interim scan evaluation than is qPET. In contrast to ΔSUVmax, interim PET interpretation by qPET is based on a single scan, which minimizes the influence of factors known to impair SUVmax measurements. Prominent examples are blood glucose levels, adipose tissue, plasma clearance, paravenous injection, calibration and correction errors, and reconstruction algorithms (25).
While the Deauville scale distinguishes 5 response categories, dichotomization of the ΔSUVmax scale results in only 2 groups. In our study, patients with Deauville scores 2–4 did not differ in outcome. Interestingly, with all 3 methods, patients with complete interim PET normalization, comprising more than 25% of the total population, tended to fare better than patients with a good response but remaining uptake. Our conclusion that interim PET may identify 3 rather than 2 prognostic groups needs to be confirmed in an independent dataset.
Both qPET and ΔSUVmax convey the same information, but the proportion of patients identified to be at high risk of treatment failure is less than 15%. Most patients eventually failing therapy remain undetected. Treatment response is only one of several factors determining outcome. Others include lymphoma burden and distribution, which can readily be assessed at baseline PET scanning (26,27); gene expression (28); and genetic abnormalities (29). Combining one or several of these factors with early response assessment is likely to improve outcome prediction (10,30). Future studies will show whether radiation exposure can be eliminated by substituting serial measurement of circulating tumor DNA for PET/CT (31).
Strengths of our study include rigorously defined conditions for PET performance and treatment delivery, a large sample size encompassing the entire spectrum of DLBCL, and reevaluation of all scans by a single specialist whose interpretation was reconciled with previous assessments of the same scans. In a comparative study, overall interobserver agreement was found to be almost perfect for the ΔSUVmax approach but no more than substantial for the Deauville scale (19). As for qPET, data on interobserver concordance are not yet available. In rPET, relying on principles similar to those of qPET, interobserver agreement was found to be almost perfect (20).
CONCLUSION
The currently recommended method for the identification of high-risk patients at interim PET scanning appears of limited value in DLBCL. The visual Deauville scale should be replaced by one of the quantitative methods, such as qPET or ΔSUVmax, that minimize the confounding factors of visual assessment and permit outcome prediction on a continuous scale.
DISCLOSURE
This work is based on a study funded by Deutsche Krebshilfe (grants 107592 and 110515), Amgen Germany, and Roche Pharma. No other potential conflict of interest relevant to this article was reported.
KEY POINTS
QUESTION: Should the visual Deauville scale be replaced by a quantitative method of interim 18F-FDG PET evaluation in DLBCL?
PERTINENT FINDINGS: In a post hoc analysis of the PETAL trial, the positive predictive value of the categoric Deauville scale was lower than that of the continuous ΔSUVmax and qPET scales. The continuous scales conveyed similar information.
IMPLICATIONS FOR PATIENT CARE: ΔSUVmax and qPET are better suited for the identification of high-risk DLBCL patients than is the visual Deauville scale.
ACKNOWLEDGMENTS
We thank the patients, investigators, and PET centers for their participation.
Footnotes
↵* Contributed equally to this work.
Published online November 27, 2020.
- © 2021 by the Society of Nuclear Medicine and Molecular Imaging.
REFERENCES
- Received for publication August 11, 2020.
- Accepted for publication November 5, 2020.


