


Abstract
The aim of this study was to assess the repeatability of activated brown adipose tissue (BAT) radiomic features. To decipher radiomic features that may provide useful information on BAT, the impact of reconstruction methods and imaging modality choice was also evaluated. Methods: Twenty-seven healthy adults enrolled in this study. After a cooling procedure to activate BAT, volunteers underwent 18F-FDG imaging. Participants underwent repeat imaging using the same imaging protocols and a similar 18F-FDG dose within 14 d. Active BAT was segmented using the BARCIST 1.0 methods. Radiomic features were extracted from each region of interest on high-definition PET (HD PET), non-HD PET, and CT images. Lin’s concordance correlation coefficient was used to estimate the repeatability of the extracted radiomic features. To determine whether BAT radiomic feature repeatability correlates with BAT SUVmax repeatability, participants were stratified based on the relative difference in SUVmax between sessions. Non-HD PET repeatable features were clustered together using hierarchical clustering, and the normalized dynamic range of each feature was computed to identify the most informative feature within each cluster. Results: Eighteen of the 27 volunteers had sufficient BAT activity for radiomic analysis. Sixty-six HD PET, 66 non-HD PET, and 6 CT features showed high repeatability (concordance correlation coefficient ≥ 0.80). Feature repeatability was significantly higher for PET than for CT, but there was no statistically significant difference between HD and non-HD PET in radiomic feature repeatability. The repeatability of radiomic features extracted from each modality and reconstruction method type followed the trend in SUVmax, as participants with lower relative differences in SUVmax between initial and repeated imaging sessions had higher radiomic feature repeatability. Hierarchical clustering of the high-repeatability PET features resulted in 10 highly correlated clusters (R 2 ≥ 0.95). Seven features, including SUVmax, did not cluster with any other features. Conclusion: Several clusters of highly repeatable BAT radiomic features derived from 18F-FDG PET/CT appear to provide information regarding BAT activity distinct from SUVmax. These features might be explored as quantitative imaging biomarkers of BAT activity in future studies.
Brown adipose tissue (BAT) is a metabolically active tissue that is the primary facilitator of shivering-independent thermogenesis via uncoupling protein-1 and glucose/lipid homeostasis (1–3). Cold exposure, β3-adrenergic receptor agonists, and catecholamines have been shown to activate BAT in adult humans. BAT activation has been postulated to raise total body energy consumption, enhance insulin sensitivity, and potentially prevent or reverse weight gain (1,4,5). Hence, it has become a potential target for treating obesity and decreasing insulin resistance.
The presence of BAT in adult humans was initially recognized on 18F-FDG PET/CT examinations performed for oncologic indications (6–9). 18F-FDG PET has since become the most commonly used technique, and gold standard, for the in vivo detection of cold-activated BAT in humans (10,11).
Maximum, peak, and mean standardized uptake values (SUVmax, SUVpeak and SUVmean, respectively) are the most commonly studied PET biomarkers (12). However, with the increasing sensitivity and resolution of PET imaging platforms, additional quantitative biomarkers are of interest. The goal of radiomics, which entails the extraction of quantitative features from tomographic images, is the detection of subtle changes in the microenvironment of tumors and other tissues, in addition to the macroscopic features typically reported by radiologists (13,14). Radiomic features have been used as biomarkers for phenotyping tumors, assessing response to treatment, and evaluating prognosis (15–17). Radiomics has the potential to complement our existing knowledge and has therefore emerged as a possible tool for precision medicine (14,18).
The utility of radiomic features in activated BAT is unknown; however, by capturing differences in BAT activity patterns, radiomic features may add useful information regarding BAT physiology. In addition to conventional metrics, radiomic features might be used as biomarkers to further study BAT and its impact on obesity and metabolic disorders. Repeatability is one of the primary elements of biomarker usefulness, as more highly repeatable biomarkers can potentially characterize a tissue in a more dependable fashion. The primary aim of this study (as part of a broader study of BAT imaging repeatability) was to assess the repeatability of BAT radiomic features and to evaluate whether repeatable radiomic features provide additional information beyond conventional metrics, such as SUVs (19).
MATERIALS AND METHODS
Subjects
This study was approved by the Washington University institutional review board, and all participants provided written informed consent. Volunteers were recruited using flyers placed in various locations on the Washington University in St. Louis medical campus. Subjects received modest financial compensation for their investment of time in the study. Age and body mass index have been shown to be negatively correlated with BAT activity (5,20). Therefore, healthy adult volunteers aged 18 to 35 with a body mass index under 25 were eligible for this study. Pertinent exclusion criteria included active infections; current or past usage of nicotine products; a history of cold-related injury; insulin-dependent diabetes; current or past usage of medications that may interfere with BAT activity, such as β-blockers; and nursing or pregnancy.
The study consisted of 2 separate imaging sessions. During each session, participants underwent an individualized cooling procedure intended to activate BAT, followed by 18F-FDG PET/CT imaging. During the repeat session, participants underwent cooling and imaging using the same protocol. Each imaging session took place at the same time of day, and both sessions were completed within 2 wk.
BAT Activation Protocol
BAT activation was achieved using a previously reported protocol (19). Figure 1 shows a timeline of the imaging sessions. On arrival, participants changed into a hospital gown (clo value of 0.44) and were wrapped in warmed blankets for approximately 1 h before the start of the cooling procedure. The cooling procedure was initiated about 60 min before the planned time of 18F-FDG injection. Participants were outfitted in a cooling suit (CureWrap, MTRE; Advanced Technologies) that circulates chilled water. At the start of the BAT activation procedure, the cooling system was set at 10°C for all volunteers. The goal of the procedure was to cool participants as much as possible without inducing sustained shivering. When shivering was observed by the study team or reported by the participant, the temperature of the water was raised by 0.5°C every 60 s until shivering ceased. This cooling protocol continued from 60 min before 18F-FDG administration until approximately 10 min before 18F-FDG PET/CT imaging.

BAT activation and imaging process. After a 1-h warming period, volunteers were cooled using a water-perfusion suit for approximately 2 h to activate BAT. After 1 h of cooling, 18F-FDG was administered and PET/CT imaging was performed immediately after the cooling procedure.
Imaging
PET/CT imaging was performed on a Siemens Biograph 40 (Siemens Healthineers). PET imaging was performed from the umbilicus to the base of the skull. About 60 min before the scan, each participant was approximately 185 MBq (5 mCi) (±20%) of 18F-FDG via intravenous bolus injection. A low-dose CT was performed immediately before PET imaging, using a tube potential of 120 kV, tube current of 80 mAs, pitch of 0.8, and rotation time of 0.5 s. PET imaging consisted of 3 contiguous, 8-min list-mode acquisitions. PET images were reconstructed using ordered-subset expectation maximization (OSEM; non-HD PET) and OSEM with point-spread function (HD PET).
Image Analysis
Because supraclavicular fossae generally contain the largest BAT depots in adult humans, this region was selected for radiomic analysis (21). The BAT segmentation process is illustrated in Figure 2. BAT segmentation was performed manually using MIM (version 6.7.7; MIM Software, Inc.) and according to a modified BARCIST 1.0 criteria: because all participants in the study were lean, a threshold based on SUV was used in place of SUV adjusted for lean body mass to segregate the activated BAT from the nonactive BAT and white adipose tissue. An SUVmax threshold of 1.2 or greater was applied to the supraclavicular fossae to identify potential areas of activated BAT. A CT Hounsfield unit (HU) range was then applied to help ensure the identified areas corresponded to fat.

BAT segmentation process. Areas known to contain BAT (A) were manually delineated (B) and then thresholds were applied, using CT HU (C) and SUV (D) cutoffs, to obtain volumes of interest from which radiomic features were extracted (E and F).
PET image intensities were normalized to decay-corrected injected activity per kilogram of body weight (SUV [g/mL]), and CT images were left as HUs. Images were converted from Digital Imaging and Communications in Medicine (DICOM) to Nearly Raw Raster Data (NRRD), and the masks derived from supraclavicular BAT segmentation were converted from DICOM-radiotherapy structure set to NRRD format using 3D Slicer (version 4.8; https://www.slicer.org/) (22). Radiomic features were extracted using PyRadiomics (version 1.3; http://www.radiomics.io/pyradiomics.html), which complies with the imaging biomarker standardization initiative (IBSI) recommendations (23,24). Images were discretized to a fixed bin width of 0.1 SUV and 10 HU for PET and CT, respectively, as suggested by Leijenaar et al. (25). Given the sensitivity of textural features to anisotropy, images were resampled to 3-mm isotropic voxels using the Simple Insight Toolkit (ITK) B-Spline algorithm for interpolation (26). The number of analyzed radiomic features and wavelet decompositions per feature class are shown in Supplemental Table 1 (supplemental materials are available at http://jnm.snmjournals.org), and additional imaging details (per the IBSI reporting requirements) are provided in Supplemental Table 2. A total of 74 textural features that quantify spatial distribution of voxel intensities were extracted, including 23 gray level cooccurrence matrix, 14 gray level dependence matrix, 16 gray level run length matrix, 16 gray level size zone matrix, and 5 neighboring gray tone difference matrix features. Additionally, we extracted 19 first-order histogram and 14 shape features. A detailed description of each feature can be found on the pyRadiomics website (https://pyRadiomics.readthedocs.io/en/latest/features.html). The application of wavelet filters resulted in 8 decompositions per feature, considering all possible combinations of high-pass (H) or low-pass (L) filters in 3 dimensions (i.e., HHH, HHL, HLH, HLL, LHH, LHL, LLH, LLL). Only first-order and textural features were wavelet-decomposed (n = 744). These steps resulted in 851 unique radiomic features for each of the 3 image sets (i.e., HD PET, non-HD PET, and CT). As the volume of the segmented BAT in the right supraclavicular region was more consistent between visits compared with the left side (Lin’s concordance correlation coefficient [CCC] values of 0.669 and 0.474, respectively), radiomic features were extracted only from BAT depots on the right side.
Statistical Analysis
Lin’s CCC was used to assess radiomic feature repeatability (Eq. 1). The repeatability of radiomic features extracted from different imaging modalities and reconstruction methods was compared using the Wilcoxon signed-rank test. In all appropriate cases, Levene’s test was used to assess variance equality between groups, and variance heterogeneity between groups was remedied using reciprocal transformation. Radiomic feature family comparison and all subsequent analyses were performed using only features extracted from non-HD PET to avoid the additional impact of point-spread function filter incorporation. The repeatability of radiomic feature families was tested using the Kruskal–Wallis H test. The repeatability of radiomic features grouped by wavelet decomposition type was evaluated by the Friedman test and the Nemenyi post hoc test. Additionally, the effect of high versus low frequency decomposition on feature repeatability was separately assessed using the Wilcoxon signed-rank test. Eq. 1
Eq. 1
where V1 and V2 indicate the first and second imaging visits, respectively, ρ is the Pearson correlation coefficient, σ is the radiomic feature SD from the indicated visit, and μ is the radiomic feature mean from the indicated visit.
Because SUVmax has been shown to be relatively consistent between test and retest imaging sessions, we hypothesized that radiomic feature repeatability would follow the trend in SUVmax relative difference (SUVmaxrd) between imaging sessions (Eq. 2) (19,27). To test this, subjects were stratified into a high-SUVmaxrd group and a low-SUVmaxrd group using a median SUVmaxrd cutoff. In order to assess the possible impact of changes in BAT metabolic volume (BMV) on radiomic feature repeatability, a similar analysis was performed by stratifying subjects into a high–BMV relative difference (BMVrd) group and a low-BMVrd group using a median BMVrd cutoff. The CCC of each radiomic feature was then recalculated for both SUVmaxrd groups and both BMVrd groups, and the Wilcoxon signed-rank test was used for groupwise comparison. Levene’s test was used to assess variance equality between groups. Eq. 2
Eq. 2
where μV1,V2 specifies the mean of the visit SUVmaxV1 the visit SUVmaxV2.
The most informative BAT radiomic features were identified using cluster analysis. The most stable radiomic features extracted from non-HD PET (defined as those with CCC ≥ 0.8), as well as SUVmean and SUVmax, were median centered, then cross-correlated. The coefficient of determination (R
2) between the features was computed, and features were then clustered together using hierarchical clustering with complete linkage and a Pearson correlation–based dissimilarity index (1-R
2). The cluster tree was cut at the height of 0.05 to designate clusters with highly correlated features (i.e., R
2 > 0.95). This step allowed a dimensionality decrease and the identification of redundant features. The most informative radiomic feature within each cluster was found by calculating the normalized dynamic range (NDR) of each feature (Eq. 3). Equation 3
where n is the number of subjects in the group and R is the radiomic feature value from the indicated visit for subject i. Rmax and Rmin are the maximum and minimum radiomic feature values within the tested group, respectively.
All data analyses were performed in R (version 3.4.1; http://cran.r-project.org/). P values less than 0.01 were considered statistically significant, unless otherwise stated, and the Benjamini–Yekutieli method was used to control for multiple comparisons (28).
RESULTS
Twenty-seven healthy adults were enrolled, and 26 participants completed both imaging sessions. Active BAT was identified using 18F-FDG PET/CT in 18 volunteers. Females comprised 13 of 18 subjects (72.2%). Subjects had a mean age of 22.9 y (range, 19.3–28.9 y), a mean body mass index of 22.6 kg/m2 (range, 19.4–26.3 kg/m2), a mean height of 169 cm (range, 152–191 cm), and a mean weight of 65 kg (range, 52–83 kg). Self-reported races and ethnicities were as follows: 14 White, 3 Asian, and 1 African-American (1 Hispanic; 17 non-Hispanic).
The number of repeatable features extracted from each imaging modality is shown in Figure 3 and Supplemental Table 3. When a CCC threshold of 0.80 was used, 66 of 851 (7%) HD PET features and 66 of 851 (7%) non-HD PET features were repeatable. The CCC values and absolute relative differences between test and retest radiomic feature values for all non-HD, HD, and CT features are provided in Supplemental Tables 4, 5, and 6, respectively. Fifty-five features were repeatable on both HD and non-HD PET. On CT, only 5 first-order histogram and 1 shape-based feature (0.7%) were repeatable. Averaged across all first-order histogram and texture features (with and without wavelet decompositions), there was significantly higher (P < 0.001) repeatability for HD PET (mean ± SD of CCC values, 0.45 ± 0.28) than for CT (mean ± SD of CCC values, 0.10 ± 0.29). Non-HD PET radiomic feature (mean ± SD of CCC values, 0.38 ± 0.32) repeatability was also significantly higher (P < 0.001) than CT radiomic feature repeatability. There was no significant difference between HD and non-HD PET radiomic feature repeatability (P = 0.521).
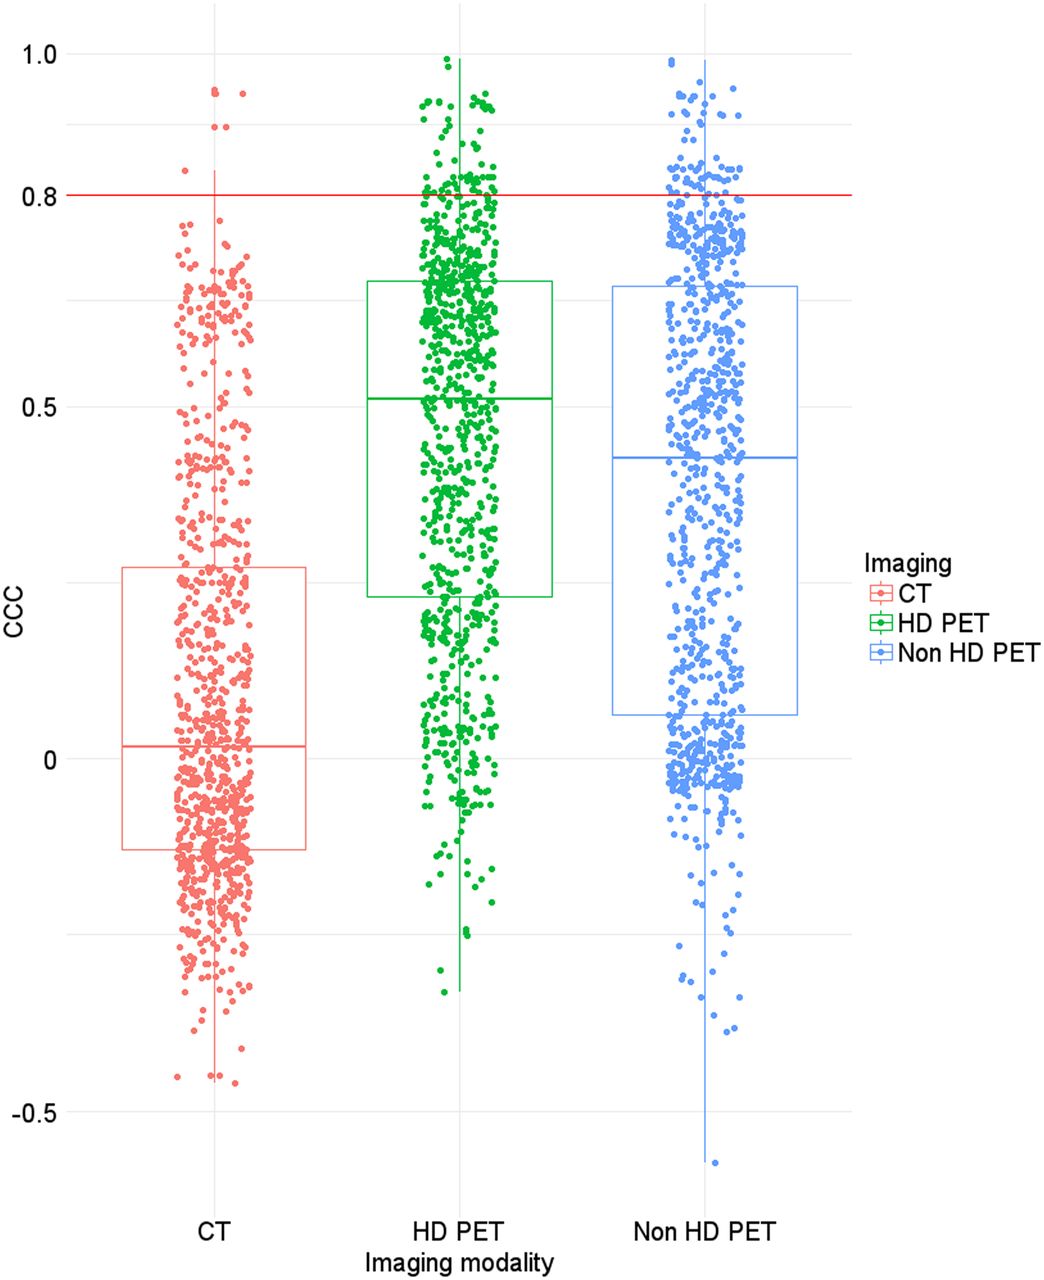
Box plots with overlaid strip plots comparing repeatability of first-order and textural (with and without wavelet decompositions) radiomic features extracted from CT, HD PET, and non-HD PET. Horizontal red line corresponds to a CCC threshold of 0.80.
When features extracted from non-HD PET images were used, no significant difference in repeatability was found between radiomic feature families (P ≈ 0.510). A significant repeatability difference was found between features when grouped by wavelet decomposition type (P < 0.001). Table 1 summarizes the results of a pairwise, post hoc analysis of the repeatability of features extracted from images with and without wavelet filtration. These radiomic feature CCC differences before and after wavelet filtering are also shown in Supplemental Figure 1. The differences in repeatability between high- and low-pass filter decomposition in each axis are displayed in Figure 4. Repeatability of features after low-pass filter decomposition in y (mean ± SD of CCC values, 0.42 ± 0.31) and z axes (mean ± SD of CCC values, 0.55 ± 0.25) was significantly higher (P < 0.001) than after high-pass filter decomposition in y (mean ± SD of CCC values, 0.26 ± 0.30) and z axes (mean ± SD of CCC values, 0.13 ± 0.23). However, no significant difference in repeatability was found between high-pass and low-pass filters (P ≈ 0.021) in the x axis.
Pairwise Comparison of Non-HD PET Radiomic Feature Repeatability Using Post Hoc Nemenyi Test

Repeatability comparison of radiomic features extracted after wavelet decomposition in x, y, and z axes using high- (H) and low- (L) pass filters. High-pass filters significantly reduced radiomic feature repeatability versus low-pass filters in the y and z axes.
Stratification by SUVmaxrd, extracted from non-HD PET images, revealed SUVmax CCC values of 0.94 and 0.26 for the low- and high-SUVmaxrd groups, respectively. The number of repeatable radiomic features at varying CCC thresholds and grouped by SUVmaxrd classification is shown in Figure 5. CT radiomic feature repeatability of the low-SUVmaxrd group (mean ± SD of CCC values, 0.13 ± 0.4) was significantly (P < 0.001) higher than the high-SUVmaxrd group (mean ± SD of CCC values, 0.11 ± 0.24). HD PET radiomic feature repeatability of the group with lower SUVmaxrd (mean ± SD of CCC values, 0.54 ± 0.37) was not significantly higher than the group with higher SUVmaxrd (mean ± SD of CCC values, 0.28 ± 0.19). Non-HD PET radiomic feature repeatability of the group with lower SUVmaxrd (mean ± SD of CCC values, 0.42 ± 0.43) was significantly (P < 0.001) higher than the group with higher SUVmaxrd (mean ± SD of CCC values, 0.28 ± 0.24). The stratification of subjects on the basis of SUVmaxrd revealed marked differences between subgroups with respect to the number of robust (CCC ≥ 0.8) radiomic features. For the SUVmaxrd high-repeatability subgroup, there were 92, 306, and 262 robust features for CT, HD PET, and non-HD PET, respectively. For the SUVmaxrd low-repeatability subgroup, there were 3, 1, and 10 robust features for CT, HD PET, and non-HD PET, respectively.
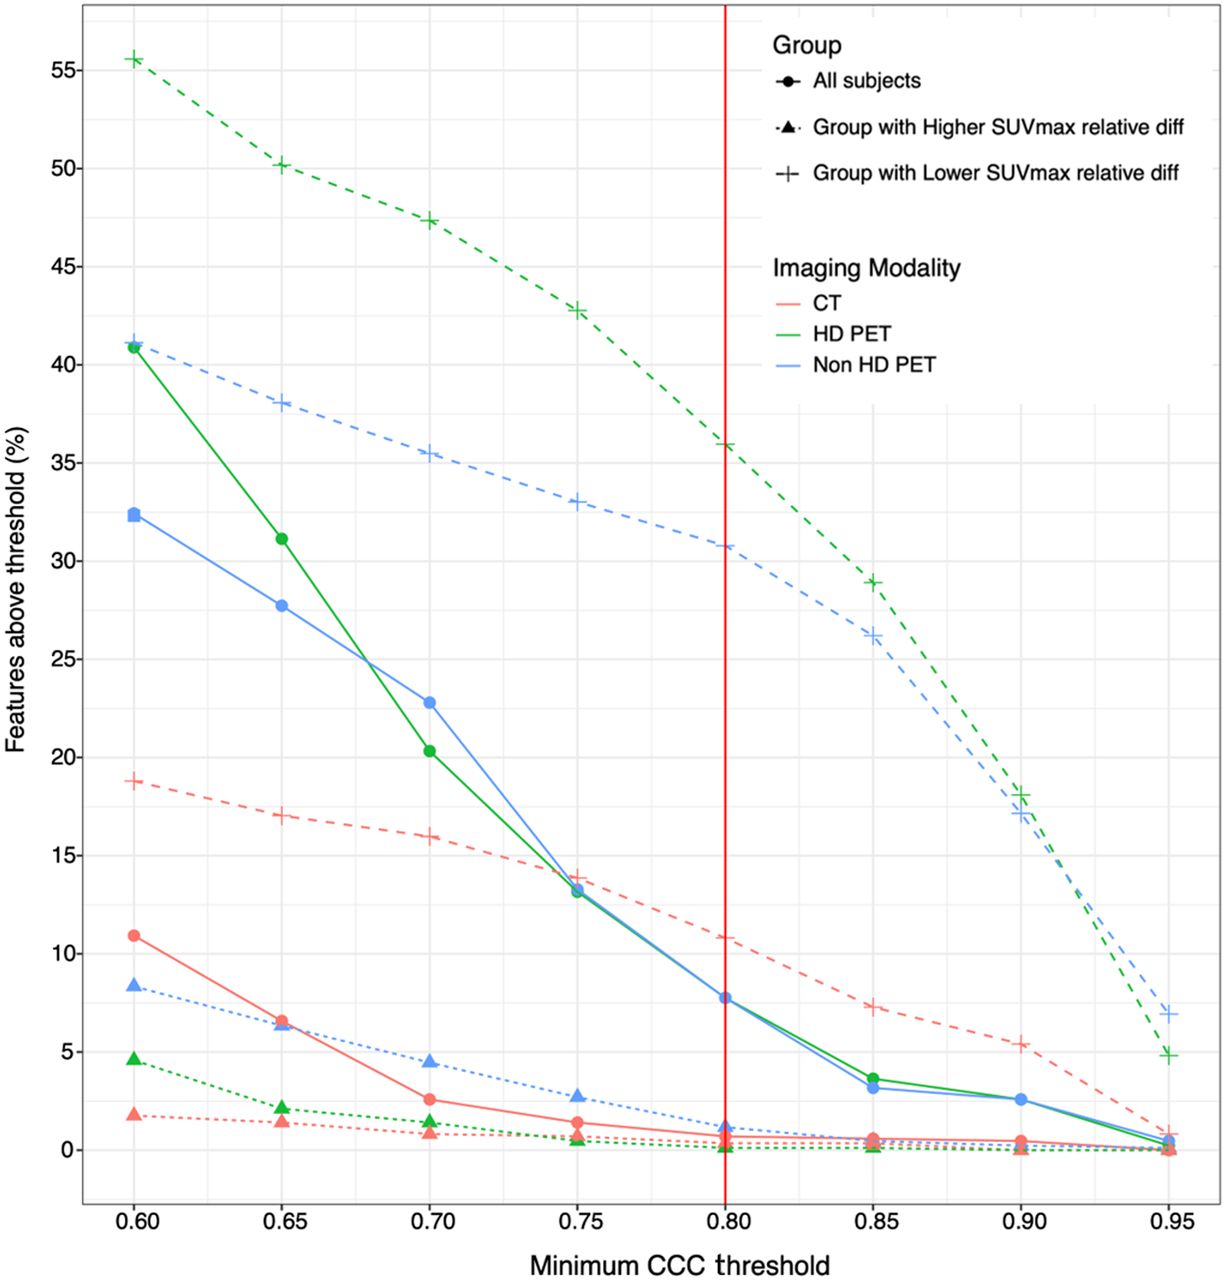
Repeatability of radiomic features extracted from PET and CT images, with and without stratification based on SUVmaxrd, at different CCC thresholds. Vertical red line corresponds to CCC repeatability threshold of 0.80.
Stratification by BMVrd revealed mean CCC values of 0.96 and 0.32 for the low- and high-BMVrd groups, respectively (Fig. 6). CT radiomic feature repeatability of the low-BMVrd group (mean ± SD of CCC values, 0.1 ± 0.4) was not significantly (P < 0.001) different from the high-BMVrd group (mean ± SD of CCC values, 0.1 ± 0.24). HD PET radiomic feature repeatability of the group with lower BMVrd (mean ± SD of CCC values, 0.45 ± 0.35) was not significantly different (P = 1) from the group with higher BMVrd (mean ± SD of CCC values, 0.5 ± 0.29) using the sign test. Non-HD PET radiomic feature repeatability of the group with lower BMVrd (mean ± SD of CCC values, 0.41 ± 0.32) was significantly (P < 0.001) higher than the group with higher BMVrd (mean ± SD of CCC values, 0.37 ± 0.4). The stratification of subjects on the basis of SUVmaxrd revealed marked differences between subgroups with respect to the number of robust (CCC ≥ 0.8) radiomic features.

Repeatability of radiomic features extracted from PET and CT images, with and without stratification based on BMVrd, at different CCC thresholds. Vertical red line corresponds to CCC repeatability threshold of 0.80.
For the BMVrd high-repeatability subgroup, there were 75, 170, and 168 robust features for CT, HD PET, and non-HD PET, respectively. For the BMVrd low-repeatability subgroup, there were 5, 164, and 86 robust features for CT, HD PET, and non-HD PET, respectively.
Hierarchical clustering of robust non-HD PET radiomic features, along with SUVmax and SUVmean, revealed 10 highly correlated (R 2 > 0.95) clusters (Fig. 7). Repeatable features and their respective clusters, along with their NDR and CCC values, are provided in Figure 7B. Six robust features (CCC ≥ 0.8), as well as SUVmax, did not cluster with any other feature. As mentioned previously, the features with the highest NDR values can be interpreted as the representative features of their respective clusters. Though several high-performing features with similar NDR indices in each cluster were identified.

Hierarchical clustering of repeatable radiomic features (A) extracted from non-HD PET images. Features were median-centered and clustered using complete linkage with a coefficient of determination-based dissimilarity index (1-R 2). (B) Repeatable radiomic features, their respective clusters, NDR, and CCC values. Cluster groups are numbered and color-coded to match heat map row and column colors (A).
DISCUSSION
Radiomics has been mainly focused on characterizing tumors. However, these methods may be relevant for other physiologic structures and functions. BAT is a complex tissue with a variable and dynamic mixture of lipid and water density. This heterogeneity may not be well captured using simple CT HU or PET SUV tissue measurements.
Identification of nonredundant, repeatable PET/CT radiomic features of BAT may help elucidate a BAT radiomic signature and its activity pattern in healthy adults, which is potentially quite informative. To the best of our knowledge, this is the first study assessing radiomic feature repeatability in BAT. Although we attempted to scan participants under the same conditions (e.g., cooling procedure, 18F-FDG dose, imaging parameters, etc.), most features did not show strong repeatability. We assume the dynamic response of BAT to cold temperature, and its complex biology, may help to explain the observed low repeatability of radiomic features in BAT. This is supported by recent studies that have shown the repeatability of standard SUV metrics in activated BAT can vary substantially between test and retest studies, because all the factors that impact SUV measurements can hypothetically influence radiomic repeatability (19,27).
In our study, PET radiomic features were more repeatable than CT radiomic features. This poor performance of CT-based features might be attributable to the low-dose technique used for the CTs in our study, as low tube currents result in higher levels of noise that might obscure radiomic features and negatively impact their repeatability (29,30). Our results also indicate that high-pass filter decomposition in the y and z axes leads to lower repeatability when compared with low-pass filter decomposition in the same axes. High-frequency wavelet decomposition results in enhancement of the most high-contrast (heterogeneous) areas of the region of interest, such as the edge (31,32). Additionally, the low-contrast regions become noisier. Because the boundary regions of test–retest BAT regions of interest are highly variable, this may help explain why high-pass filters lowered repeatability.
Our results suggest the repeatability of BAT radiomic features mostly follows the SUVmax repeatability trend. A similar trend was not consistently identified when subjects were stratified based on differences in BAT metabolic volume. Interestingly, none of the repeatable non-HD radiomic features clustered with SUVmax. Hence, repeatable non-HD PET radiomic features can potentially provide unique (i.e., separate from SUVmax) information regarding activated BAT. These features may potentially be used as biomarkers for assessing the effects of pharmacologic BAT activation in conjunction with conventional metrics such as activated BAT volume and SUVmax. Textural radiomic features might also be more sensitive for assessing the drug-induced changes in BAT metabolism than activated BAT volume and SUVmax, as these 2 more conventional BAT metrics have been shown to exhibit lower repeatability than some of the radiomic features and they may capture activation pattern rather than single voxel value (19,27). The precise biologic significance of the features we have evaluated will require further study.
Limitations of this study include using a low-dose CT scan, which decreases radiation exposure but has been shown to negatively impact the reproducibility of CT-derived radiomic features (30). Given the dynamic nature of BAT, its contour changes between visits. The delineation of supraclavicular BAT, thus, may not be identical between the visits, which could negatively impact radiomic repeatability (33). In this study, intensity discretization was achieved using a fixed SUV bin width. An alternative approach is to vary the number of SUV bins. Radiomic feature repeatability may vary between these methods, and the impact of a fixed bin number approach on radiomic feature repeatability should be evaluated in future studies. Another limitation is the risk of false discovery of correlation given the multiple radiomic features assessed. Thus, the highly repeatable features should be prospectively evaluated for further validity of biologic significance.
CONCLUSION
Several repeatable 18F-FDG PET BAT radiomic features were identified, which may provide information regarding BAT metabolic activation distinct from SUVmax, and these features potentially can be explored as quantitative imaging biomarkers of BAT in future studies.
DISCLOSURE
No potential conflict of interest relevant to this article was reported.
KEY POINTS
QUESTION: Are radiomic features extracted from PET images of brown fat repeatable?
PERTINENT FINDINGS: Clusters of repeatable radiomic features were identified that may offer information beyond what is provided by standard SUV measures.
IMPLICATIONS FOR PATIENT CARE: Certain radiomic features, found here to be repeatable, may be useful for evaluating BAT.
Footnotes
Published online Oct. 9, 2020.
- © 2021 by the Society of Nuclear Medicine and Molecular Imaging.
REFERENCES
- Received for publication April 30, 2020.
- Accepted for publication September 9, 2020.


Jump to section
Related Articles
Cited By...
- No citing articles found.