


Article Figures & Data
Figures
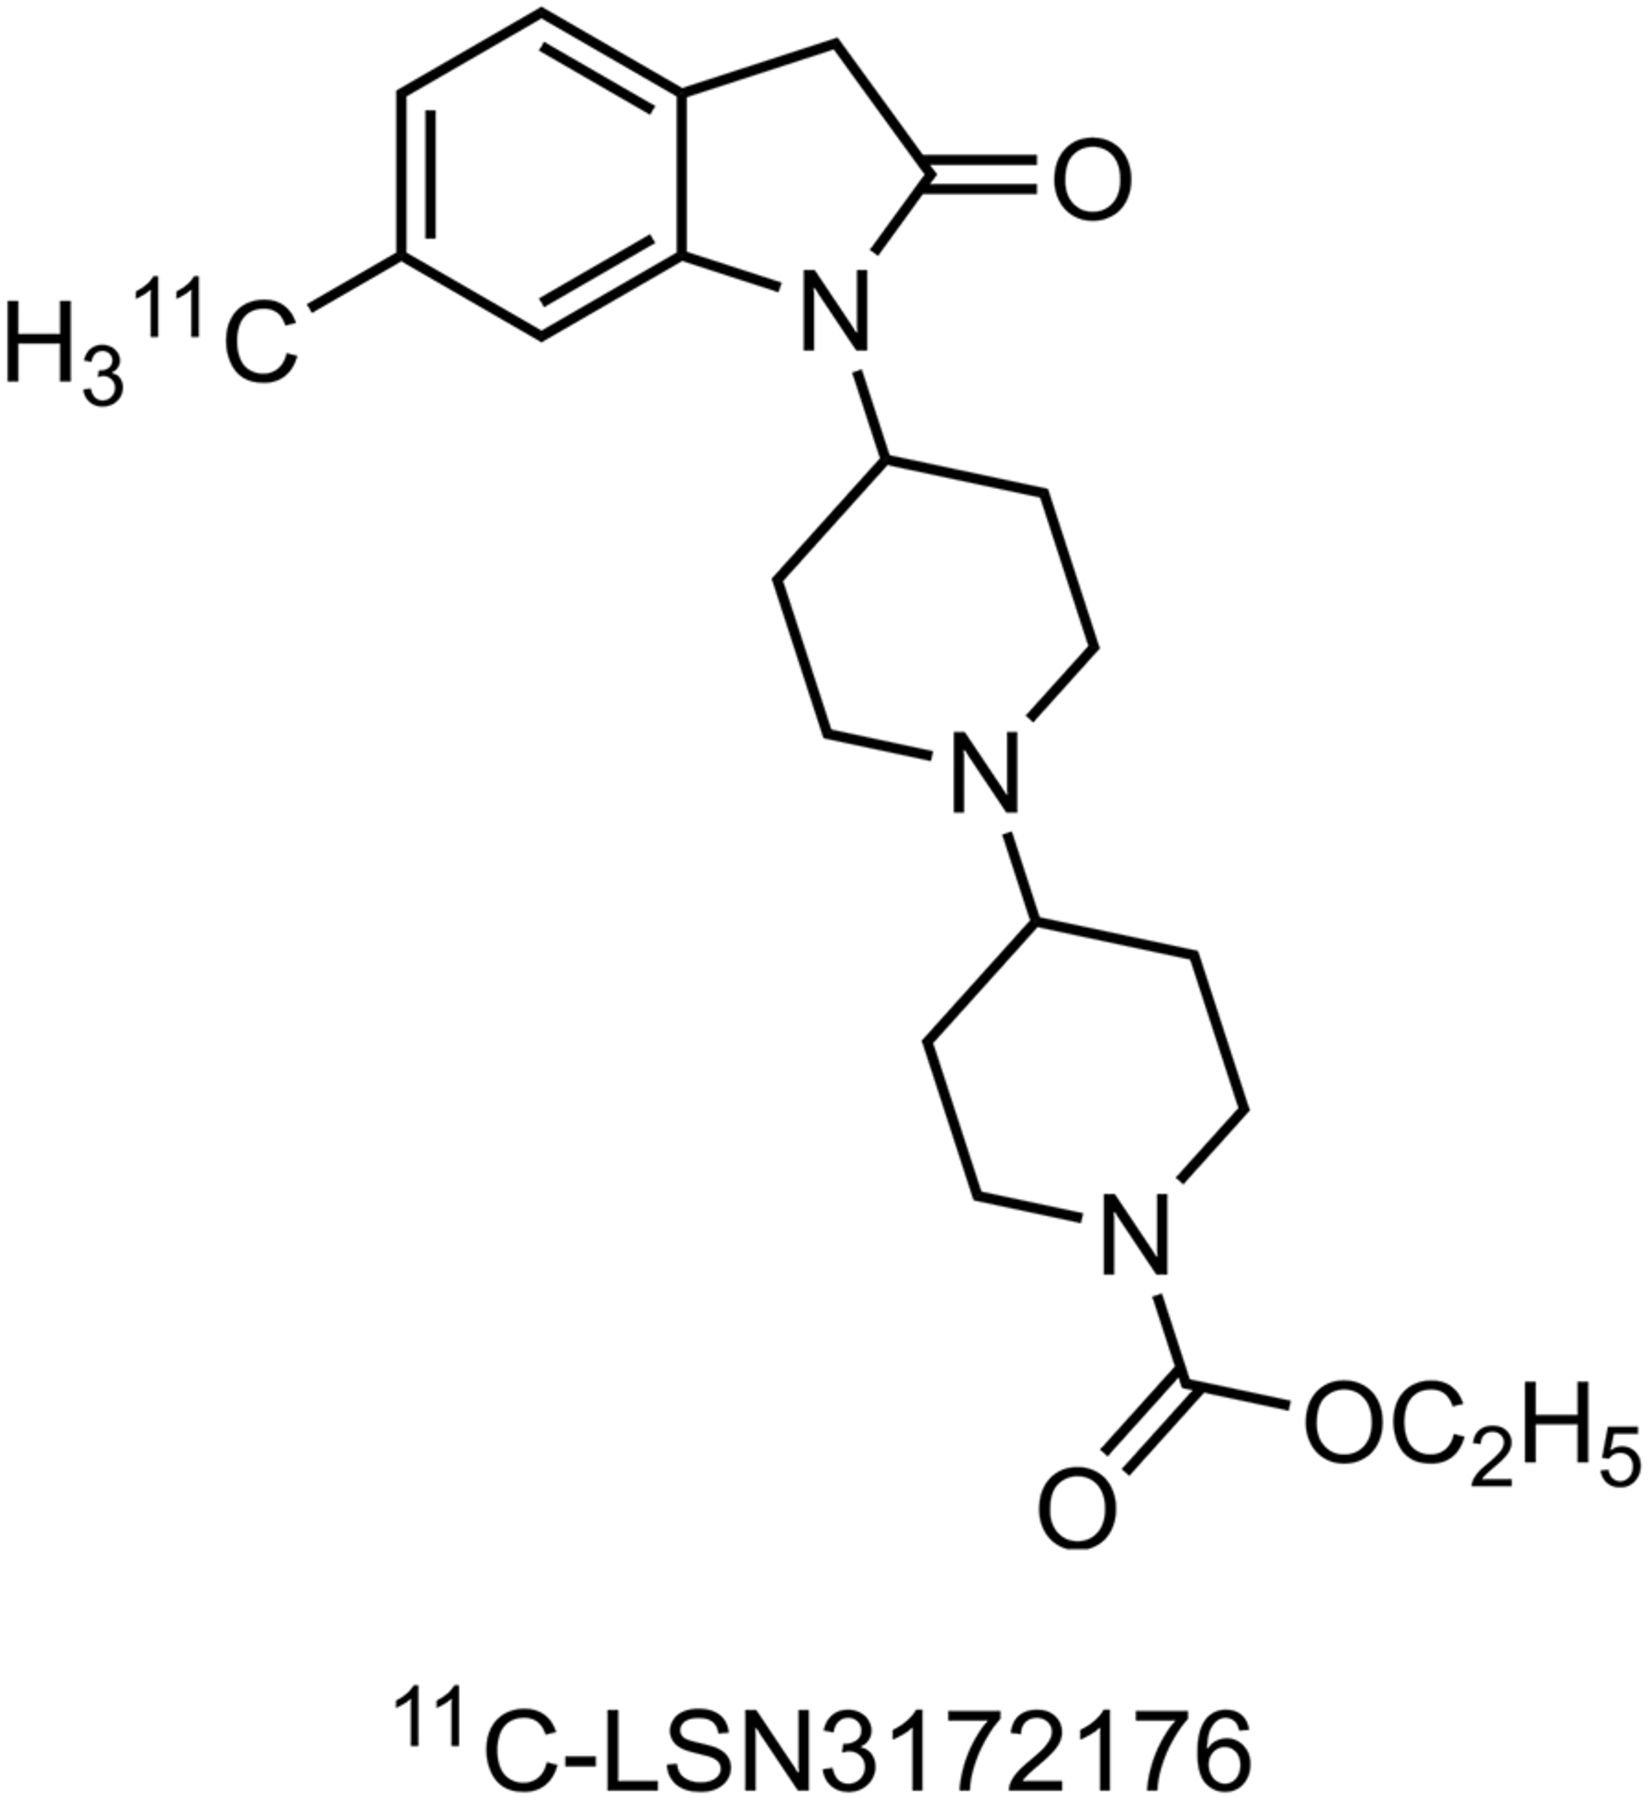
- FIGURE 1.
Molecular structure of 11C-LSN3172176.
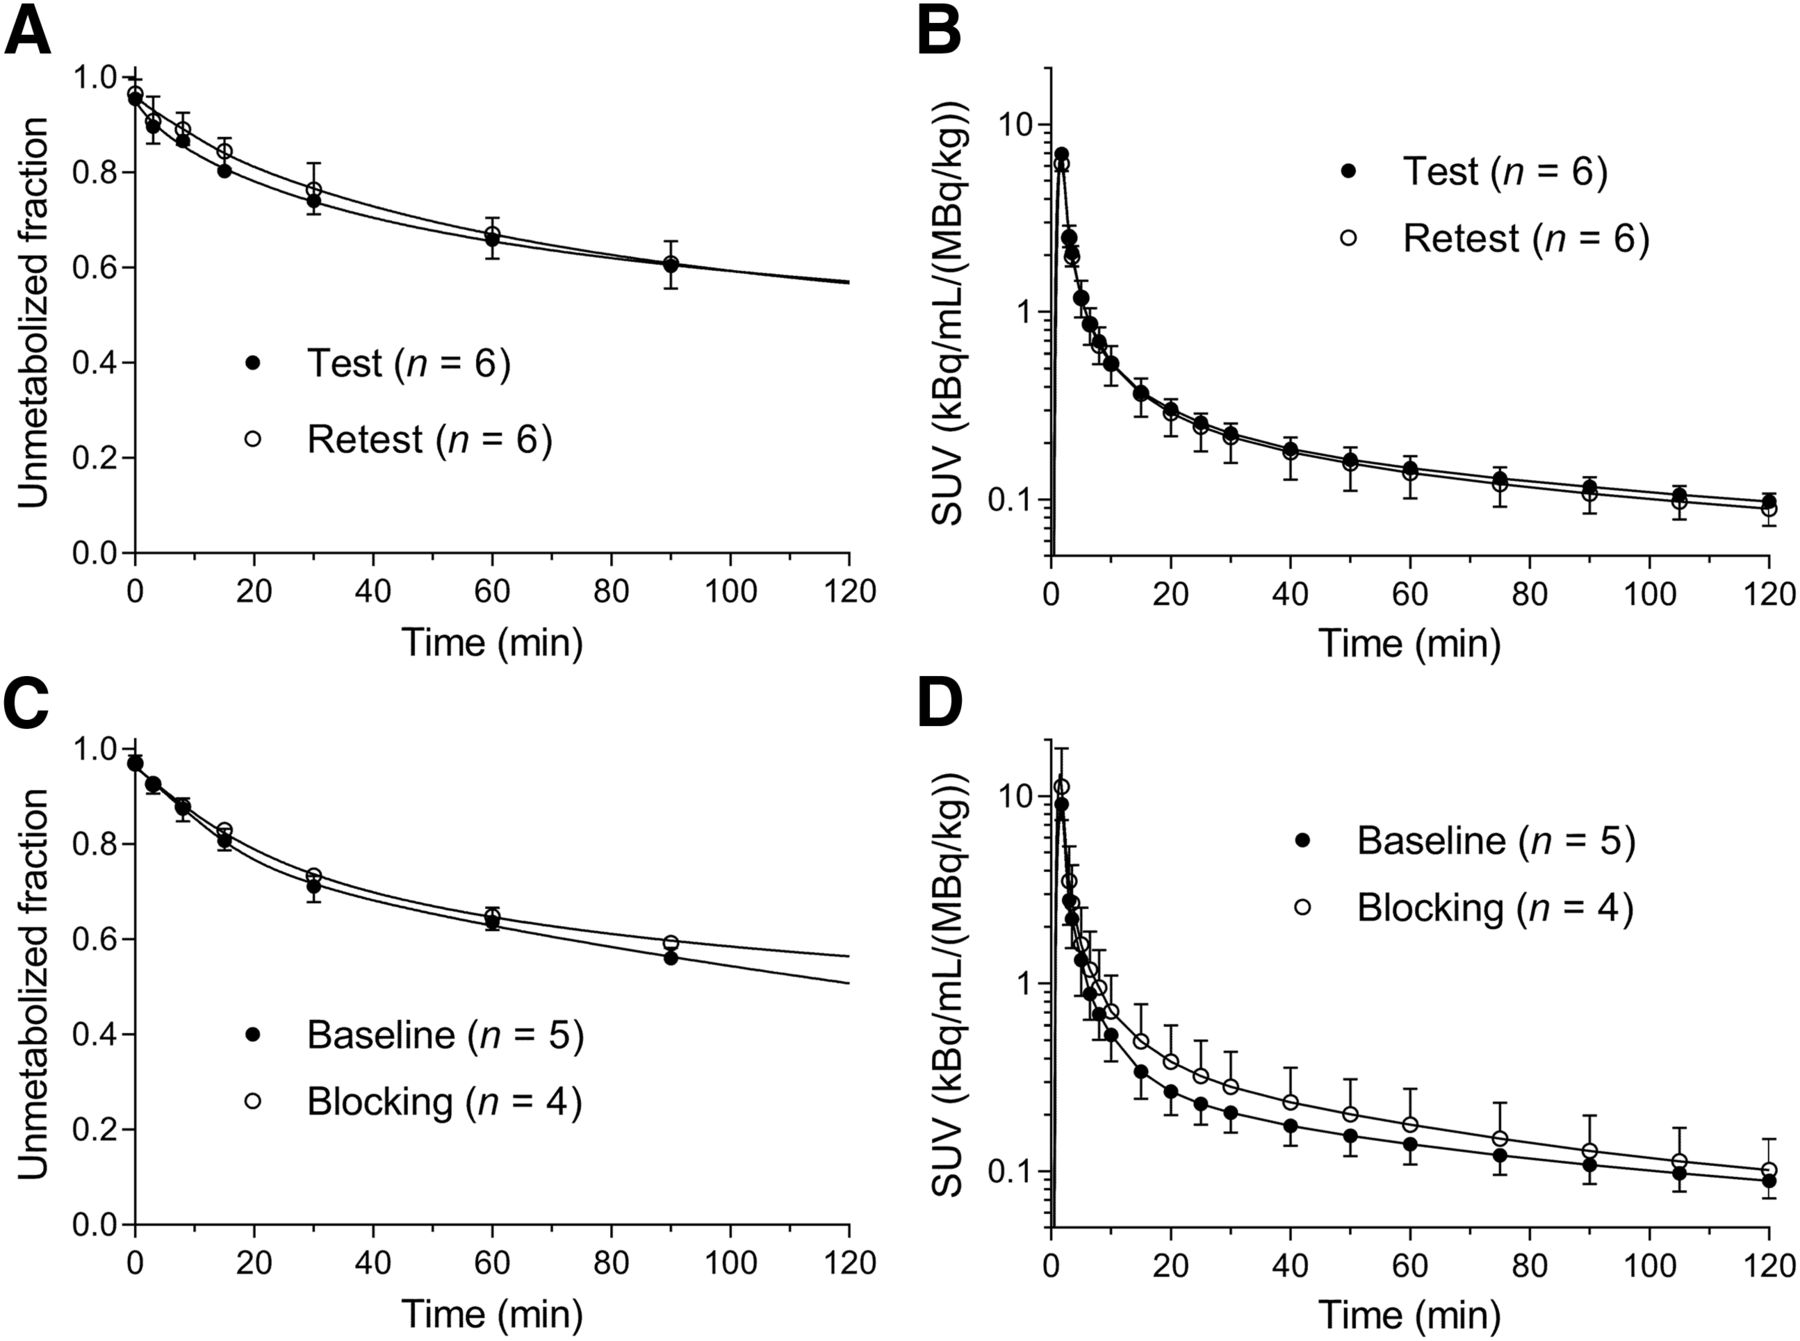
- FIGURE 2.
(A and B) Mean ± SD of plasma parent fraction (A) and metabolite-corrected input function (B) in test and retest scans of 11C-LSN3172176. (C and D) Plasma parent fraction (C) and metabolite-corrected input function (D) in baseline and blocking scans.
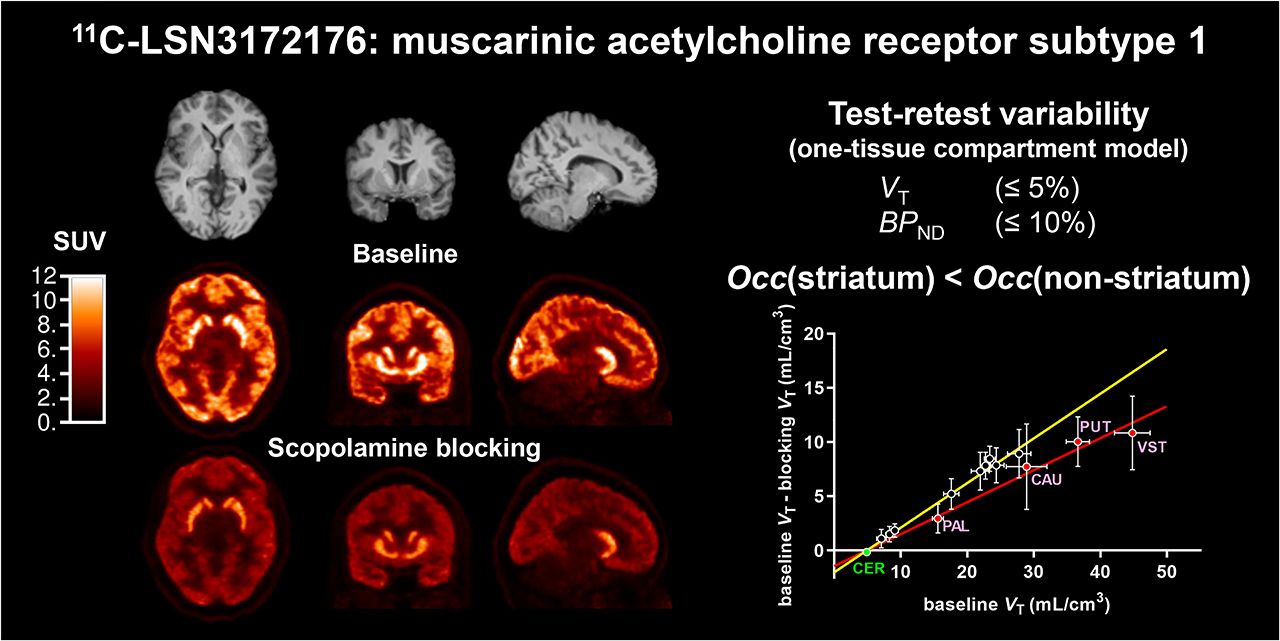
- FIGURE 3.
MR and coregistered typical PET images of 11C-LSN3172176 under test and retest conditions in one subject and under baseline and blocking conditions in another subject. PET images were summed from 30 to 60 min after injection.
- FIGURE 4.
Time–activity curves of 11C-LSN3172176 in baseline (A) and blocking (B) scans and fits with 1TC, 2TC, SRTM, and SRTM2. CER = cerebellum; FRO = frontal cortex; PUT = putamen; THA = thalamus.
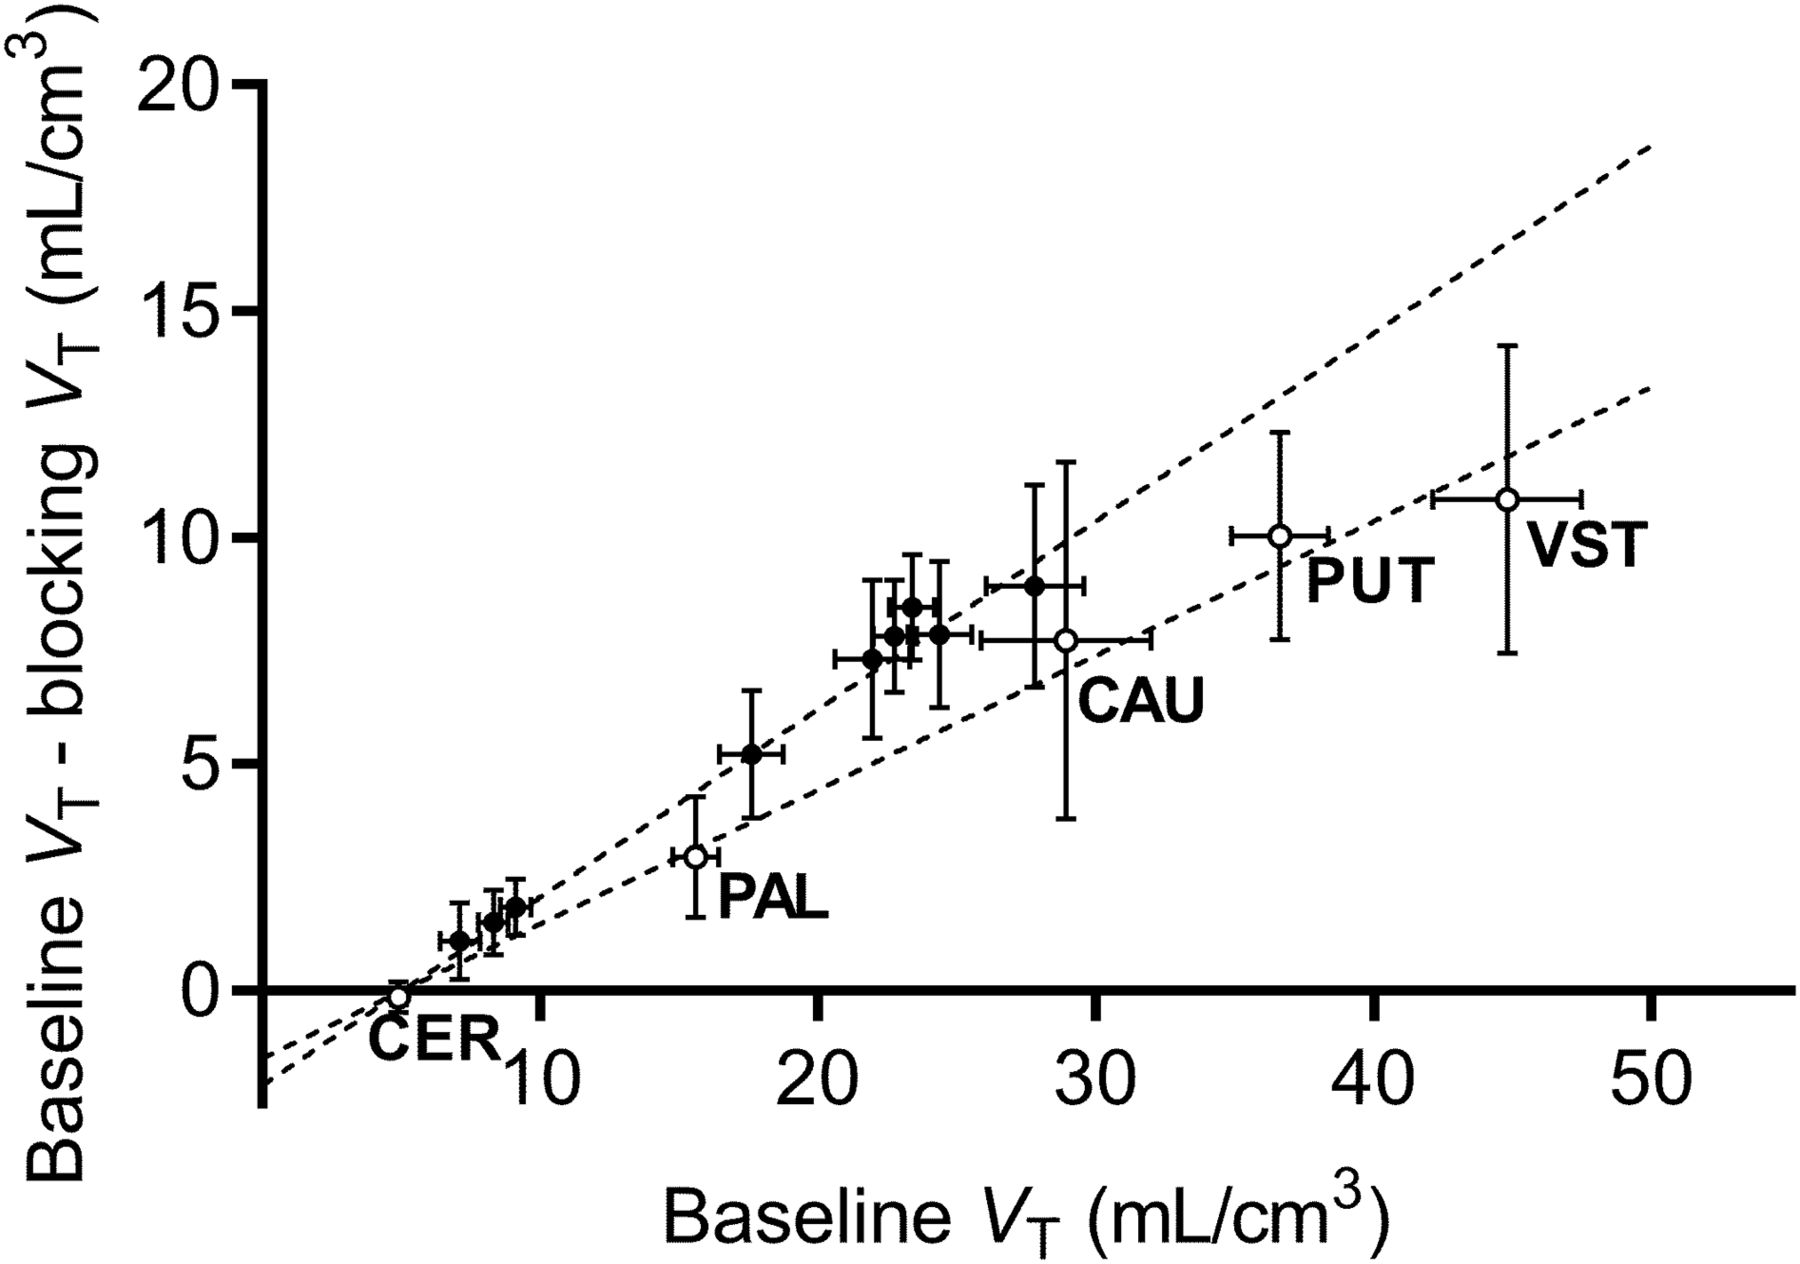
- FIGURE 5.
Lassen plot of mean regional 1TC VT of 11C-LSN3172176 (n = 4). Error bar shows SEM. Ventral striatum (VST), putamen (PUT), caudate (CAU), pallidum (PAL), and cerebellum (CER) are shown as open circles, and other regions are shown as closed circles.


Tables
Parameter Test (n = 6) Retest (n = 6) Baseline (n = 5) Blocking (n = 5) Age (y) 38 ± 10 43 ± 2 Body weight (kg) 81 ± 16 88 ± 13 Injected dose (MBq) 559 ± 109 584 ± 152 601 ± 74 579 ± 141 Specific activity at injection (MBq/nmol) 452 ± 83 400 ± 100 139 ± 42 158 ± 31 Injected mass (μg/kg) 0.006 ± 0.002 0.008 ± 0.004 0.021 ± 0.008 0.017 ± 0.006 Data are mean ± SD. Age and weight are for test and retest groups combined and for baseline and blocking groups combined.
1TC VT (mL/cm3) (n = 6) 1TC BPND (n = 6) SRTM2 BPND (n = 6) Region Test Retest Minimum scan time (min) Test Retest Minimum scan time (min) Test Retest Ventral striatum 48.5 (16%) 48.9 (20%) 50 8.87 (12%) 8.69 (17%) 50 8.60 (17%) 8.00 (14%) Putamen 38.6 (22%) 39.3 (22%) 60 6.82 (20%) 6.74 (18%) 60 6.63 (23%) 6.31 (16%) Caudate 30.2 (19%) 30.4 (20%) 60 5.13 (15%) 4.98 (14%) 70 4.97 (19%) 4.64 (12%) Amygdala 28.8 (21%) 28.8 (18%) 40 4.80 (14%) 4.67 (8%) 50 4.62 (20%) 4.3 (12%) Temporal cortex 27.4 (15%) 27.9 (14%) 60 4.56 (10%) 4.52 (10%) 70 4.41 (11%) 4.25 (8%) Occipital cortex 26.7 (16%) 27.3 (14%) 60 4.42 (9%) 4.41 (9%) 70 4.28 (10%) 4.17 (8%) Parietal cortex 25.5 (16%) 26.1 (13%) 60 4.18 (9%) 4.16 (9%) 60 4.04 (9%) 3.94 (8%) Frontal cortex 24.4 (17%) 24.7 (15%) 60 3.96 (14%) 3.88 (12%) 70 3.83 (14%) 3.67 (10%) Hippocampus 17.5 (18%) 18.0 (15%) 70 2.55 (16%) 2.58 (16%) 80 2.48 (21%) 2.42 (17%) Globus pallidus 16.4 (24%) 16.6 (24%) 40 2.31 (25%) 2.27 (24%) 40 2.26 (28%) 2.15 (23%) Centrum semiovale 9.0 (16%) 9.4 (15%) 30 0.82 (16%) 0.85 (13%) 40 0.77 (16%) 0.78 (17%) Thalamus 8.7 (19%) 9.0 (19%) 30 0.76 (27%) 0.76 (20%) 30 0.75 (28%) 0.75 (19%) Cerebellum 4.9 (12%) 5.1 (14%) 30 Data are percentage coefficient of variation followed by intersubject variability in parentheses.
1TC VT (mL/cm3) 1TC BPND Region Baseline (n = 5) Blocking (n = 4) Baseline (n = 5) Blocking (n = 4) Ventral striatum 44.6 (10%) 34.0 (12%) 7.82 (8%) 5.68 (7%) Putamen 37.2 (9%) 26.6 (11%) 6.37 (7%) 4.25 (11%) Caudate 29.7 (19%) 21.2 (24%) 4.85 (14%) 3.14 (19%) Amygdala 27.4 (12%) 18.9 (15%) 4.44 (16%) 2.71 (10%) Temporal cortex 24.7 (9%) 16.5 (14%) 3.89 (8%) 2.25 (10%) Occipital cortex 23.8 (7%) 14.9 (11%) 3.71 (7%) 1.94 (10%) Parietal cortex 23.1 (7%) 14.9 (13%) 3.59 (11%) 1.94 (14%) Frontal cortex 22.5 (12%) 14.6 (15%) 3.45 (11%) 1.88 (13%) Hippocampus 17.7 (11%) 12.4 (13%) 2.51 (15%) 1.44 (13%) Globus pallidus 15.6 (9%) 12.6 (17%) 2.12 (24%) 1.51 (35%) Centrum semiovale 8.7 (14%) 6.8 (14%) 0.72 (28%) 0.34 (40%) Thalamus 9.4 (13%) 7.3 (9%) 0.86 (12%) 0.43 (12%) Cerebellum 5.1 (11%) 5.1 (10%) Data are percentage coefficient of variation followed by intersubject variability in parentheses.
One-occupancy model Two-occupancy model Subject Occupancy (%) VND (mL/cm3) Nonstriatum occupancy (%) Striatum occupncy (%) VND (mL/cm3) 1 47 (7%) 3.87 (15%) 52 (4%) 41 (5%) 4.17 (5%) 2 34 (15%) 5.24 (20%) 44 (8%) 27 (15%) 6.01 (6%) 3 31 (13%) 4.49 (21%) 36 (7%) 24 (19%) 5.51 (8%) 4 39 (7%) 4.92 (13%) 43 (4%) 33 (8%) 5.19 (6%) Mean ± SD 4.63 ± 0.59 5.22 ± 0.77 Data are best-fit values using nonlinear analysis, followed by relative percentage SE in parentheses.
1TC VT (mL/cm3) (n = 6) 1TC BPND (n = 6) SRTM2 BPND (n = 6) Region aTRV TRV ICC aTRV TRV ICC aTRV TRV ICC Ventral striatum 5% 0% ± 7% 0.92 7% 3% ± 8% 0.87 8% 7% ± 6% 0.83 Putamen 2% −2% ± 2% 0.99 4% 1% ± 4% 0.98 9% 4 ± 9% 0.84 Caudate 1% 0% ± 1% 1.00 4% 3% ± 3% 0.96 8% 6 ± 8% 0.79 Amygdala 3% −1% ± 4% 0.99 6% 2% ± 7% 0.81 11% 6 ± 12% 0.67 Temporal cortex 3% −2% ± 3% 0.98 4% 1% ± 5% 0.92 7% 4 ± 8% 0.61 Occipital cortex 4% −3% ± 5% 0.93 6% 0% ± 7% 0.72 8% 2 ± 10% 0.34 Parietal cortex 5% −2% ± 6% 0.92 6% 0% ± 8% 0.67 8% 3 ± 11% 0.35 Frontal cortex 4% −1% ± 4% 0.97 6% 2% ± 7% 0.89 6% 4 ± 7% 0.78 Hippocampus 4% −4% ± 4% 0.96 6% −1% ± 8% 0.90 9% 1 ± 11% 0.87 Globus pallidus 4% −2% ± 5% 0.98 6% 2% ± 9% 0.95 7% 4 ± 7% 0.94 Centrum semiovale 4% −4% ± 3% 0.94 7% −4% ± 8% 0.87 6% −1 ± 8% 0.91 Thalamus 4% −3% ± 4% 0.97 10% −1% ± 12% 0.91 11% −1% ± 13% 0.88 Cerebellum 4% −3% ± 3% 0.96 aTRV = absolute TRV; ICC = intraclass correlation coefficient.
HTML Page - index.htslp
Files in this Data Supplement:


Jump to section
Related Articles
Cited By...
- Linking Brain Entropy to Molecular and Cellular Architecture in Psychosis
- Connectome-based brain fingerprints predict early cognitive decline in Parkinsons patients with minor hallucinations
- An engine for systematic discovery of cause-effect relationships between brain structure and function
- Geometric influences on the regional organization of the mammalian brain
- Brain maps of general cognitive function and spatial correlations with neurobiological cortical profiles
- Mapping the Microstructure of Human Cerebral Cortex In Vivo with Diffusion MRI
- Mapping neuropeptide signaling in the human brain
- A replicable and generalizable neuroimaging-based indicator of pain sensitivity across individuals
- Concurrent assessment of neurometabolism and brain hemodynamics to comprehensively characterize the functional brain response to psychotropic drugs: an S-ketamine study
- Benchmarking methods for mapping functional connectivity in the brain
- Controlling the human connectome with spatially diffuse input signals
- Integrating brainstem and cortical functional architectures
- The biological role of local and global fMRI BOLD signal variability in human brain organization
- Resting state changes in aging and Parkinsons disease are shaped by underlying neurotransmission - a normative modeling study
- Transitions between cognitive topographies: contributions of network structure, neuromodulation, and disease
- Multimodal, multiscale connectivity blueprints of the cerebral cortex
- Whole-brain modeling explains the context-dependent effects of cholinergic neuromodulation
- PET Imaging of Cholinergic Neurotransmission in Neurodegenerative Disorders
- Molecular and connectomic vulnerability shape cross-disorder cortical abnormalities
- Mapping neurotransmitter systems to the structural and functional organization of the human neocortex
- neuromaps: structural and functional interpretation of brain maps
- Correspondence between gene expression and neurotransmitter receptor and transporter density in the human brain