


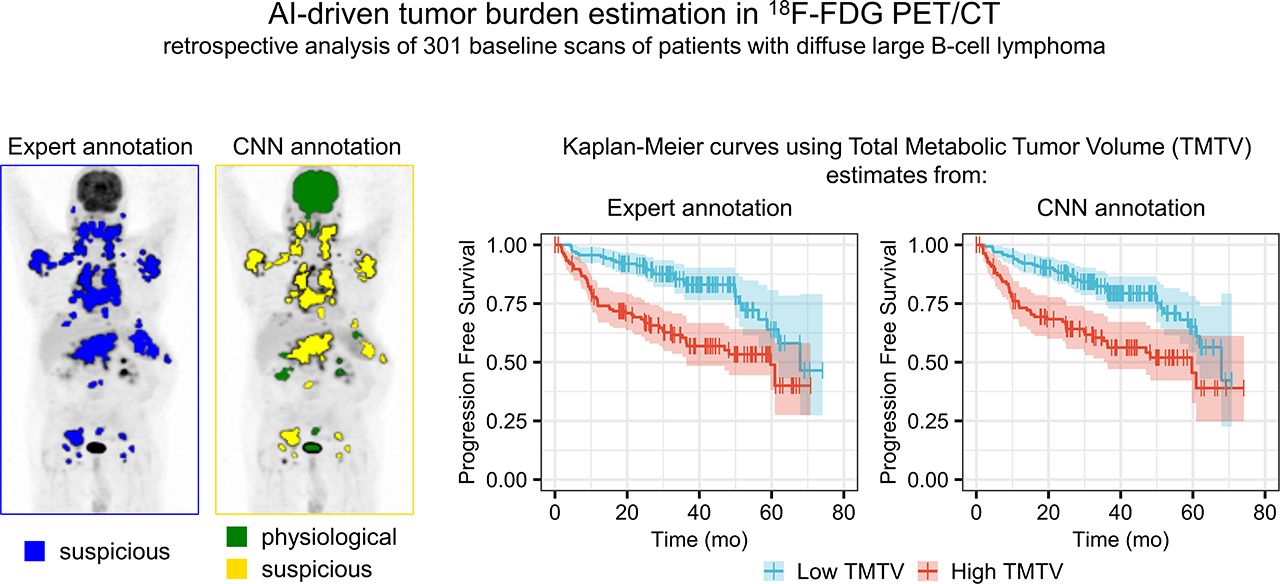
Visual Abstract
Abstract
Total metabolic tumor volume (TMTV), calculated from 18F-FDG PET/CT baseline studies, is a prognostic factor in diffuse large B-cell lymphoma (DLBCL) whose measurement requires the segmentation of all malignant foci throughout the body. No consensus currently exists regarding the most accurate approach for such segmentation. Further, all methods still require extensive manual input from an experienced reader. We examined whether an artificial intelligence–based method could estimate TMTV with a comparable prognostic value to TMTV measured by experts. Methods: Baseline 18F-FDG PET/CT scans of 301 DLBCL patients from the REMARC trial (NCT01122472) were retrospectively analyzed using a prototype software (PET Assisted Reporting System [PARS]). An automated whole-body high-uptake segmentation algorithm identified all 3-dimensional regions of interest (ROIs) with increased tracer uptake. The resulting ROIs were processed using a convolutional neural network trained on an independent cohort and classified as nonsuspicious or suspicious uptake. The PARS-based TMTV (TMTVPARS) was estimated as the sum of the volumes of ROIs classified as suspicious uptake. The reference TMTV (TMTVREF) was measured by 2 experienced readers using independent semiautomatic software. The TMTVPARS was compared with the TMTVREF in terms of prognostic value for progression-free survival (PFS) and overall survival (OS). Results: TMTVPARS was significantly correlated with the TMTVREF (ρ = 0.76; P < 0.001). Using PARS, an average of 24 regions per subject with increased tracer uptake was identified, and an average of 20 regions per subject was correctly identified as nonsuspicious or suspicious, yielding 85% classification accuracy, 80% sensitivity, and 88% specificity, compared with the TMTVREF region. Both TMTV results were predictive of PFS (hazard ratio, 2.3 and 2.6 for TMTVPARS and TMTVREF, respectively; P < 0.001) and OS (hazard ratio, 2.8 and 3.7 for TMTVPARS and TMTVREF, respectively; P < 0.001). Conclusion: TMTVPARS was consistent with that obtained by experts and displayed a significant prognostic value for PFS and OS in DLBCL patients. Classification of high-uptake regions using deep learning for rapidly discarding physiologic uptake may considerably simplify TMTV estimation, reduce observer variability, and facilitate the use of TMTV as a predictive factor in DLBCL patients.
Total metabolic tumor volume (TMTV) derived from 18F-FDG PET/CT baseline studies is a promising prognostic factor in diffuse large B-cell lymphoma (DLBCL) (1,2) and other types of lymphoma (3–5). DLBCL is the most frequent non-Hodgkin lymphoma, being present in about 30%–40% of non-Hodgkin lymphoma cases worldwide. Although the prognosis of DLBCL can be improved with immunochemotherapy, more than 30% of patients are refractory or relapse after first-line treatment, with a poor outcome (6,7). Therefore, there is a need to identify high-risk patients who could benefit from intensive or novel therapies early. Unfortunately, the role of current prognostic factors such as the International Prognostic Index (8), Revised International Prognostic Index (9), and National Comprehensive Cancer Network International Prognostic Index (10), based on tumor burden surrogates is limited. Thus, baseline TMTV, which estimates the total metabolic tumor burden at diagnosis, has been proposed as an alternative prognostic tool for early risk stratification.
To date, TMTV is not yet routinely used in clinical lymphoma patient management, in part because of a lack of consensus throughout the literature. Several methods have been proposed to calculate TMTV (11–13), and the cutoffs reported to detect high-risk patients differed among methods and studies. However, recent studies have suggested that, despite these differences, most methods yielded similar accuracy in predicting patient prognosis when applied in similar patient groups (11,12), emphasizing the strong prognostic power of baseline TMTV.
Regardless of the criteria used for delineating tumor regions, all methods for deriving TMTV require extensive and time-consuming manual input from an experienced reader. The reader either manually segments the tumor regions or, more commonly, uses an automated method to detect all regions with increased uptake and then manually eliminates the regions of physiologic uptake and adds in undetected tumor regions (13). Recently, a machine-learning algorithm using a convolutional neural network (CNN) was trained to differentiate physiologic from nonphysiologic uptake regions in whole-body 18F-FDG PET scans acquired from an unselected population of more than 600 patients, including half who were lymphoma patients with different subtypes of diseases (14,15). This CNN achieved a high degree of accuracy in characterizing increased tracer uptake in the whole body as physiologic or nonphysiologic. Such automated identification of nonphysiologic regions would facilitate TMTV measurement and clinical adoption. This study therefore sought to assess the ability of this CNN to identify regions from which TMTV could be automatically calculated and to evaluate the ability of the resulting TMTV in predicting patient outcome among a large group of DLBCL patients included in an international phase III trial wherein TMTV has already been demonstrated to be a strong predictor of 4-y progression-free survival (PFS) and overall survival (OS). To evaluate the CNN performance, regions with elevated tracer uptake automatically identified as physiologic or suspicious were compared with regions attributed to suspicious uptake by an expert reader using a semiautomatic method.
MATERIALS AND METHODS
Patients
Patients from an ancillary study (16,17) of the REMARC trial (NCT01122472) were retrospectively analyzed. This trial is a phase III study that was designed to assess the efficacy of lenalidomide versus placebo in responding elderly DLBCL patients (60–80 y old) treated with the standard first-line rituximab, cyclophosphamide, doxorubicin hydrochloride (hydroxydaunorubicin), vincristine sulfate, and prednisone (R-CHOP) therapy approach (18). The institutional review board approval and the informed consent of the REMARC trial included all the ancillary studies. The ancillary study was conducted by involving 301 patients who underwent baseline PET/CT before R-CHOP and showed that TMTV was a strong prognosticator of outcome in patients responding to first-line chemotherapy combined with monoclonal antibody treatment.
Image Acquisition and Analysis
All baseline 18F-FDG PET/CT images from the ancillary study were collected in an anonymized DICOM format. Patients whose PET or CT DICOM series had incomplete axial slices or irregular slice intervals were excluded. PET images were expressed in SUV units, accounting for injected dose and patient body weight.
PET/CT images were analyzed using an investigational software prototype (PET Assisted Reporting System [PARS]; Siemens Medical Solutions USA, Inc.) that uses artificial intelligence. The prototype first automatically located a cylindric reference region at the center of the proximal descending aorta by applying a landmarking algorithm to the CT image (19). This region was used to determine the mean blood pool SUV and mean blood pool SUV standard deviation (SD), following PERCIST recommendations (20). The 3-dimensional regions of the PET image with increased tracer uptake were identified for each subject using an automated whole-body high-uptake segmentation algorithm (multi-foci segmentation, MFS) (21). In line with the PERCIST recommendations, only the regions with SUVpeak greater than twice the mean blood pool SUV plus twice the mean blood pool SUV SD were included. Those regions were then further segmented according to 42% of the SUVmax threshold, and the ones with volumes below 2 cm3 were discarded. The resulting regions of interest (ROIs), called ROIPARS, were then automatically processed by a CNN. Details of the training and validation of this CNN were previously reported (15). The input of the CNN was the PET/CT data together with the set of ROIPARS sites. For each ROIPARS, the output of the CNN was the anatomic localization among a set of possible anatomic sites relevant for staging and whether the ROIPARS uptake was physiologic (e.g., due to unspecific bowel uptake, muscle activation, inflammation, infection, or bone degeneration) or suspicious (i.e., due to lymphoma). The volumes of all ROIPARS sites classified as suspicious uptake were then summed to obtain the TMTVPARS.
The CNN was also used in combination with 2 other settings of the initial high-uptake ROI segmentation: the first used an initial threshold of 2.5 SUV instead of the blood-pool–based threshold, followed by thresholding with 41% of SUVmax; the second also included ROIs with a volume between 0.1 and 2 cm3.
The TMTV obtained by 2 experienced nuclear medicine physicians in the context of a previous study (16,17) was used as a reference (TMTVREF). The TMTVREF was obtained using the semiautomatic version of the Beth Israel Fiji (ImageJ) software plugin (22), which was previously used to demonstrate the prognostic value of TMTV in various lymphoma subtypes (5,23). To calculate TMTVREF, the physician combined automated and manual steps as follows. First, volumes of interest with high uptake in the PET images were segmented using an automated method, which applied in sequence an algorithm based on component trees and shape priors (24), a region growing, and a final region delineation using 41% of the region SUVmax threshold (25). Second, the resulting ROIs were manually reviewed by the reader, who selected only the regions corresponding to lymphoma (ROIREF), adding an ROIREF wherever a lymphoma lesion had been missed by the algorithm by drawing a prism around that lesion and applying a 41% SUVmax threshold. The volumes of all lymphoma ROIREF sites were summed to obtain the reference TMTV (TMTVREF).
Statistical Analysis
To evaluate the performance of the CNN classification, for each patient, each ROIPARS, having been labeled as presenting suspicious or physiologic uptake by the CNN, was compared with all the ROIREF sites of that patient taken together. The ROIPARS was considered to match the ROIREF if at least 50% of its volume overlapped with one or several ROIREF sites. ROIPARS sites classified as suspicious and matching one or several ROIREF sites were considered true-positives, ROIPARS sites classified as physiologic and matching one or several ROIREF sites were considered false-negatives, ROIPARS sites classified as physiologic and not matching any ROIREF sites were considered true-negatives, and ROIPARS sites classified as suspicious and not matching any ROIREF sites were considered false-positives. The sensitivity, specificity, and accuracy of the uptake classification were calculated. The performance of the CNN classification was also assessed in case a minimum overlap of 25% and 75% was required to consider an ROIPARS as matching the ROIREF.
To evaluate differences between TMTVPARS and TMTVREF, Bland–Altman analysis was performed. Since the Shapiro–Wilk test revealed a significant nonnormal distribution of the differences between TMTVPARS and TMTVREF (P < 0.001), the median bias and limits of agreement at the 2.5 and 97.5 percentiles were reported in the Bland–Altman plot. To assess the correlation between ranked TMTV values, the Spearman rank correlation coefficient was used. For each patient, the agreement between the patient set of ROIPARS sites classified as suspicious and the patient set of ROIREF sites was characterized using the Dice score, precision (the fraction of voxels in the set of ROIPARS sites classified as suspicious that were also present in the set of ROIREF sites), and recall (the fraction of voxels in the set of ROIREF sites that were also present in the set of ROIPARS sites classified as suspicious).
Survival analysis was performed for both TMTVPARS and TMTVREF with respect to PFS and OS. Receiver-operating-characteristic curves were used to determine TMTV cutoffs to predict the occurrence of events within 4 y for both PFS and OS, by maximizing the Youden index (sensitivity + specificity − 1). Survival functions were computed by Kaplan–Meier analyses and used to estimate survival time statistics (such as 4-y PFS rate and 4-y OS rate) for low- and high-TMTV groups. A log-rank test was used to assess whether differences between Kaplan–Meier survival curves were significant. Univariate Cox regression was used to calculate hazard ratios between survival groups. Statistical significance was set at a P value of less than 0.05. Statistical analysis was performed using R, version 3.6.1, with survivalROC, version 1.0.3, and pROC, version 1.15.3 (26).
RESULTS
In total, 280 patients from 124 centers were included in the analysis. Patient characteristics are reported in Table 1. All received first-line treatment with R-CHOP and were responders at the time of inclusion in the trial, 142 received a lenalidomide regimen afterward as maintenance, and 138 received placebo. After a median follow-up of 5 y, 86 patients presented with a PFS event and 51 patients had an OS event; the 4-y survival rates were 69% for PFS and 83% for OS. The 4-y survival rates were comparable to those of the entire trial.
Patient Characteristics
PET/CT images were acquired using different scanner models from different vendors as summarized in Supplemental Table 1 (supplemental materials are available at http://jnm.snmjournals.org). The delay between injection and acquisition time was 71.7 ± 14.1 min (mean ± SD). The SUVmean in the proximal descending aorta cylindric region was 1.6 ± 0.5 (mean ± SD across subjects), resulting in an SUVpeak threshold of 3.6 ± 1.2 for detecting ROIs with increased tracer uptake.
The results below are described for the PERCIST-based setting of the initial high-uptake ROI segmentation, whereas changes observed with other settings are reported in Supplemental Tables 2–4.
Uptake Classification
In total, 6,737 ROIPARS sites exhibiting increased uptake were obtained from the 280 subjects. There were 7,996 ROIREF sites in the 280 subjects. Descriptive statistics for the number of ROIPARS and ROIREF sites per subject are summarized in Supplemental Table 5. Among the 6,737 ROIPARS sites with increased uptake, 2,831 (42%) were classified as having suspicious uptake by the CNN.
When compared with the ROIREF sites obtained by the experienced reader, the identification of the ROIPARS sites with suspicious uptake by the CNN yielded 3,317 true-negatives, 2,399 true-positives, 589 false-negatives, and 432 false-positives. Corresponding sensitivity was 80%, specificity was 88%, and accuracy was 85%.
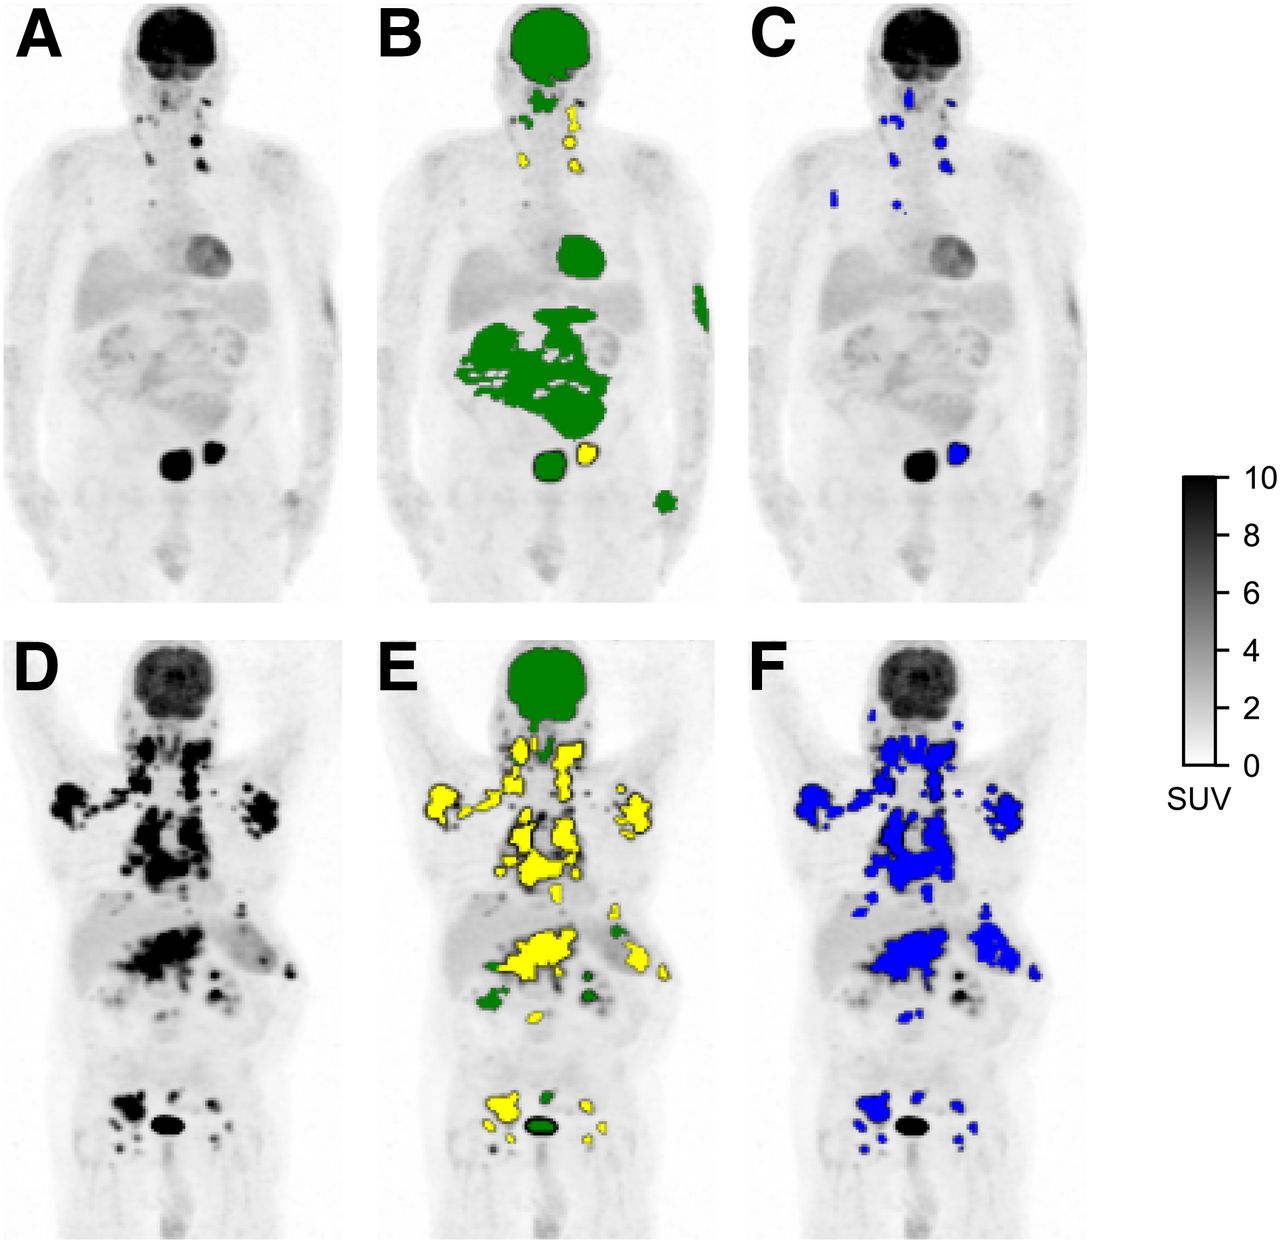
Additionally, the mean per-subject ROIPARS classification accuracy was 87% (median, 89%; interquartile range [IQR], 81%–96%). There were an average of 20 correctly classified ROIPARS sites per subject (median, 17 ROIPARS sites; IQR, 11–27 ROIPARS sites) and an average of 4 incorrectly classified ROIPARS sites per subject (median, 2 ROIPARS sites; IQR, 1–5 ROIPARS sites), which were regions classified as suspicious by the CNN that did not overlap with the set of ROIREF sites or regions classified as physiologic by the CNN but overlapped with the set of ROIREF sites. Two examples of uptake classification of ROIPARS sites with corresponding ROIREF are shown in Figure 1. Results with a minimum overlap of 25% and 75% required to consider a ROIPARS as matching the ROIREF are reported in Supplemental Table 6.

Detection of regions of high 18F-FDG uptake and classification as physiologic or suspicious. (A and D) Maximum-intensity-projection PET images of subjects with low TMTV (A) and high TMTV (D). (B and E) ROIPARS obtained automatically using PARS software prototype. ROIPARS sites detected by MFS algorithm are overlaid onto PET maximum-intensity projection. ROIPARS sites classified by deep-learning algorithm as physiologic are shown in green, and ROIPARS sites classified as suspicious are shown in yellow. (C and F) ROIREF obtained by an experienced nuclear medicine physician using semiautomatic software.
TMTV
After discarding the ROIPARS sites classified as physiologic uptake by the CNN, a median TMTVPARS of 110 cm3 was obtained (IQR, 33–281 cm3). The median TMTVREF was 240 cm3 (IQR, 80–529 cm3) (Table 2).
Statistics for TMTV Using PARS and Reference Method
There was a significant correlation between ranked TMTV estimates (ρ = 0.76; P < 0.001). The median Dice score across all patients between the patient set of ROIPARS sites labeled as suspicious and the patient set of ROIREF sites was 0.73 (IQR, 0.33–0.86), the median recall of the patient set of ROIPARS sites labeled as suspicious with respect to the patient set of ROIREF sites was 0.62 (IQR, 0.20–0.81), and the median precision was 0.96 (IQR, 0.86–0.99). The Bland–Altman plot comparing TMTVPARS and TMTVREF (Fig. 2) showed wide limits of agreement.
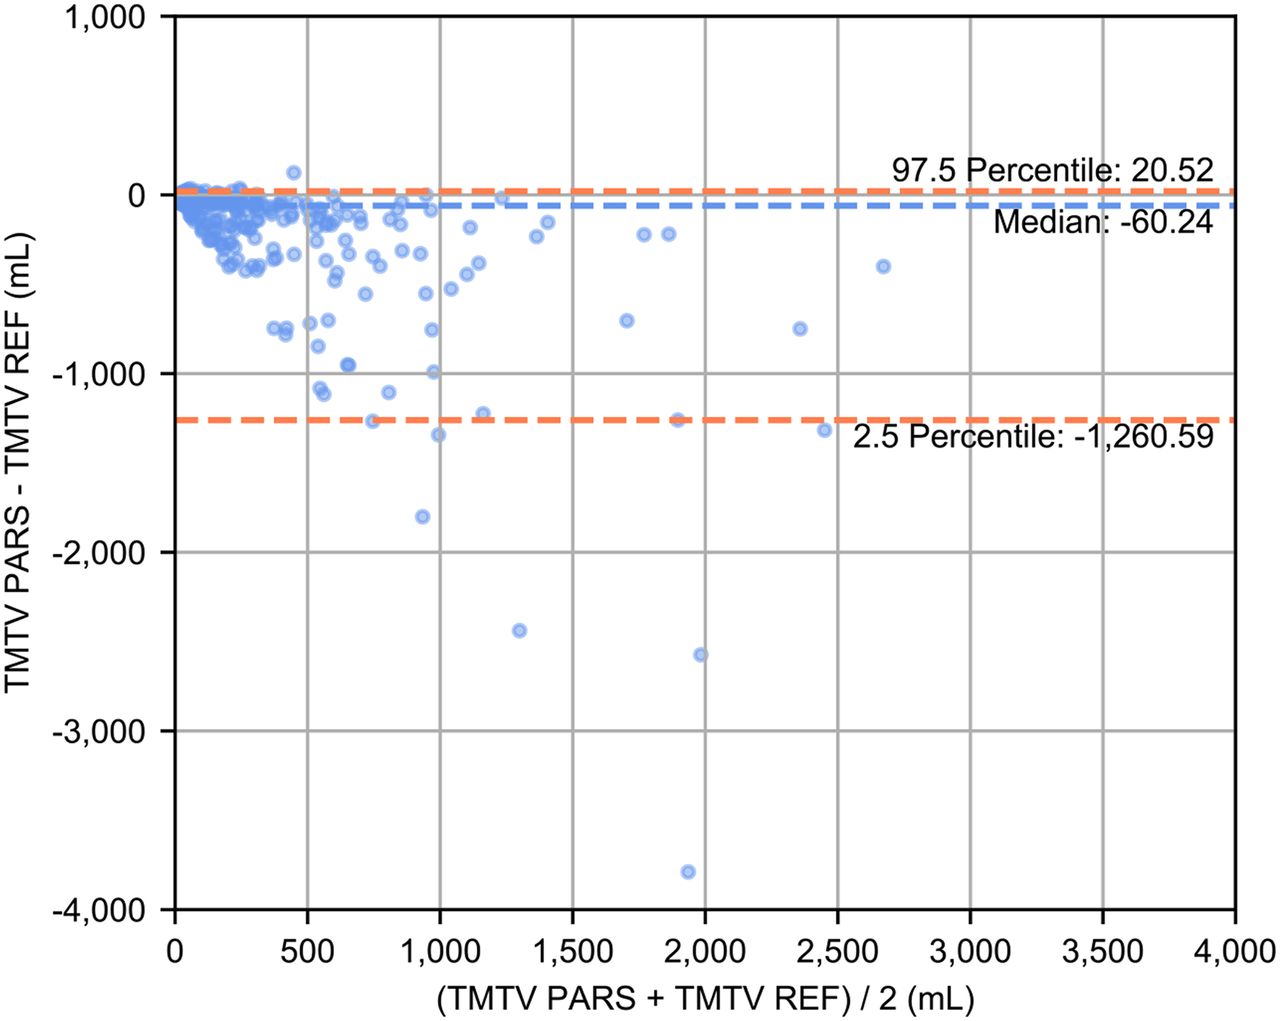
Bland–Altman plot comparing TMTV obtained using PARS and TMTVREF obtained by nuclear medicine physician using semiautomatic software.
Survival Analysis
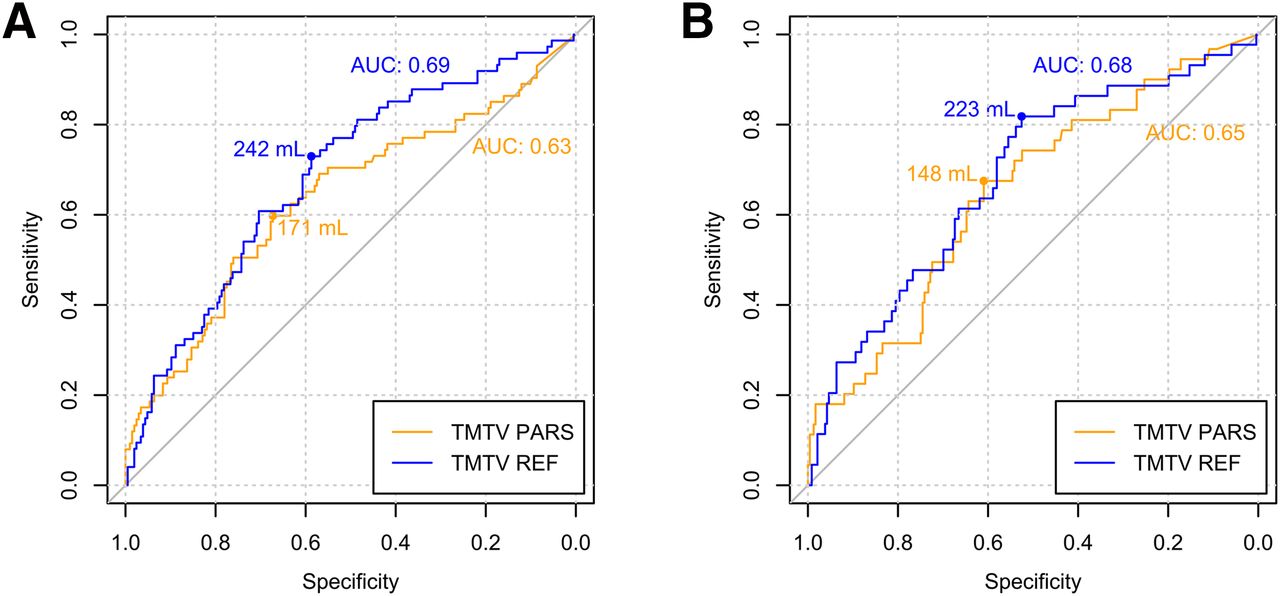
The area under the receiver-operating-characteristic curve for predicting the 4-y PFS was 0.63 for TMTVPARS and 0.69 for TMTVREF (Fig. 3). The optimal cutoffs for predicting the 4-y PFS were 171 cm3 for TMTVPARS and 242 cm3 for TMTVREF. Kaplan–Meier survival curves are shown in Figure 4. The 4-y PFS rates were 79% and 54% for the low- and high-TMTVPARS groups and 83% and 55% for the low- and high-TMTVREF groups, respectively. The log-rank test indicated a significantly longer PFS time in the low-TMTV patient group for both TMTV estimation methods (P < 0.001 for TMTVPARS and TMTVREF). Cox regression for PFS resulted in hazard ratios (high-TMTV group vs. low-TMTV group) of 2.3 (95% confidence interval, 1.5–3.6; P < 0.001 for Wald test) for TMTVPARS and 2.6 (95% confidence interval, 1.6–4.1; P < 0.001) for TMTVREF. The survival results are summarized in Table 3.

Receiver-operating-characteristic curves for TMTVPARS and TMTVREF for 4-y PFS (A) and 4-y OS (B). Areas under receiver-operating-characteristic curves (AUC) and optimal TMTV cutoffs are reported.
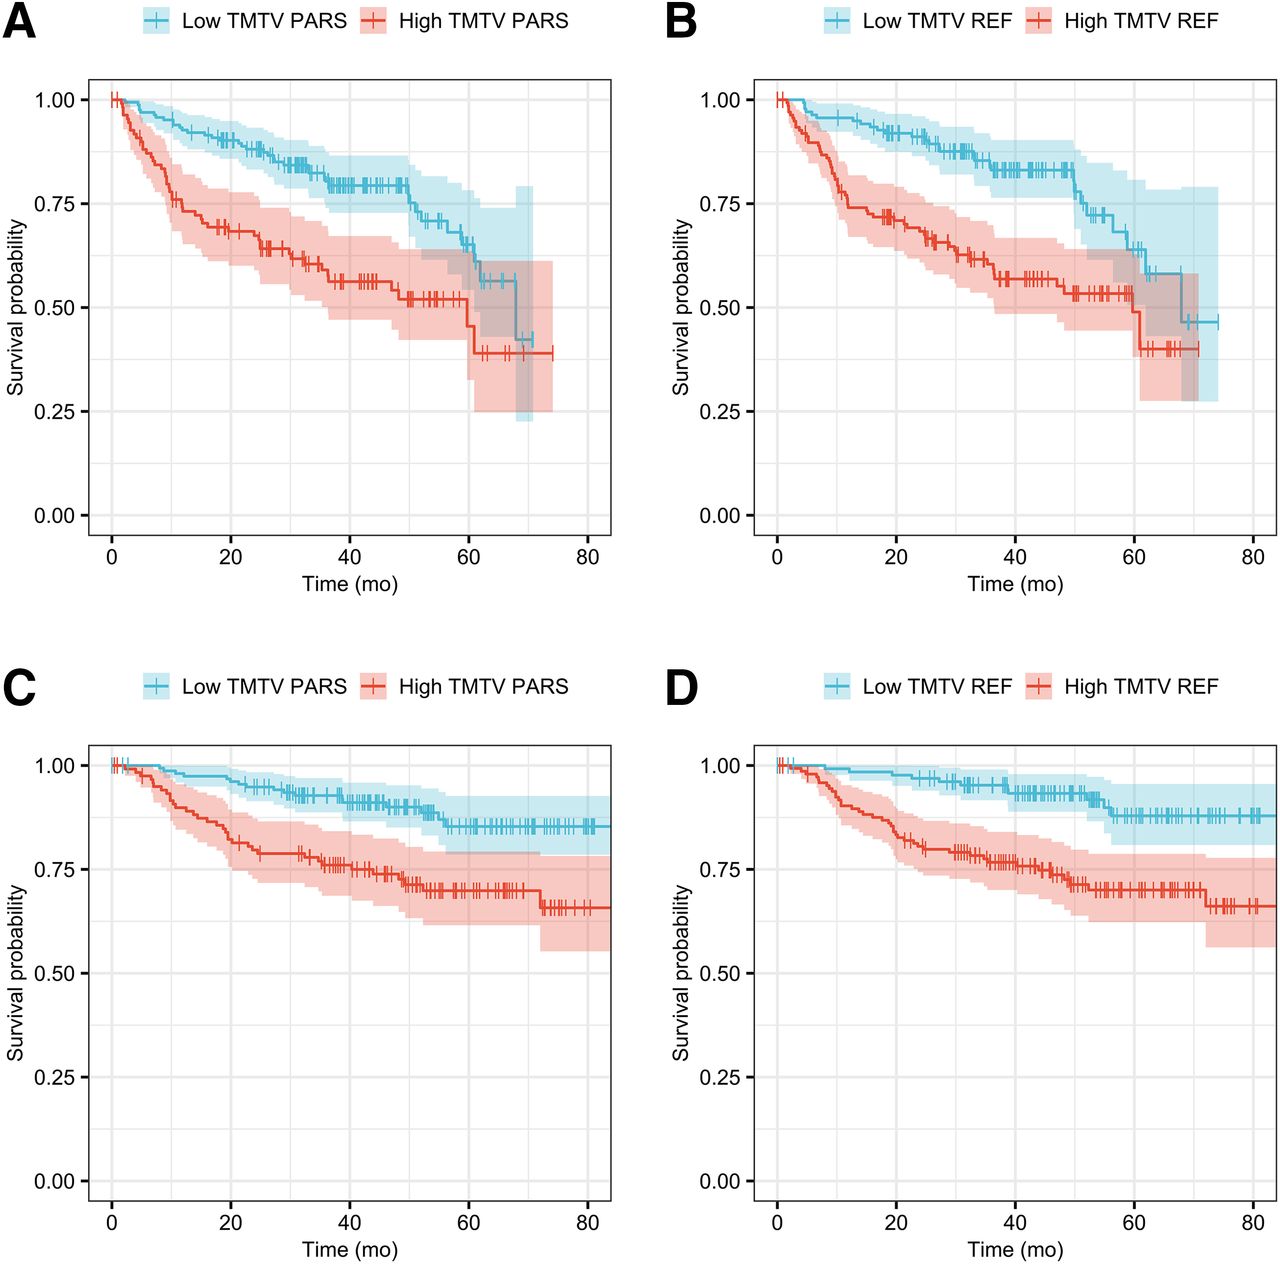
Kaplan–Meier survival curves for PFS (A and B) and OS (C and D).
TMTV AUC, Hazard Ratio, and 4-Year Survival Analyses for PFS and OS
For the 4-y OS, the area under the receiver-operating-characteristic curve was 0.65 for TMTVPARS and 0.68 for TMTVREF. The optimal TMTV cutoffs for predicting the 4-y OS were 148 cm3 for TMTVPARS and 223 cm3 for TMTVREF. The 4-y OS rates were 90% and 74% for the low- and high-TMTVPARS groups and 93% and 74% for the low- and high-TMTVREF groups, respectively. The log-rank test revealed a significantly higher OS time in the low-TMTV patient group for both TMTV estimation methods (P < 0.001 for TMTVPARS and TMTVREF). Cox regression for OS resulted in hazard ratios (high-TMTV group vs. low-TMTV group) of 2.8 (95% confidence interval, 1.6–5.1; P < 0.001) for TMTVPARS and 3.7 (95% confidence interval, 1.9–7.2; P < 0.001) for TMTVREF.
The sensitivity, specificity, negative predictive value, positive predictive value, and accuracy for predicting the occurrence of survival events within 4 y, determined at the optimal TMTV cutoff for each method, are reported in Supplemental Table 7 and were similar for both PFS and OS.
DISCUSSION
Our main result was that a fully automated method combining a region delineation method based on PERCIST recommendations and a CNN-based algorithm to distinguish between regions with elevated physiologic uptake and nonphysiologic regions was able to generate, in a uniform population of DLBCL patients, TMTV values predictive of 4-y PFS and OS with an accuracy comparable to that obtained when TMTV is calculated by manual selection of the tumor regions by medical experts. Although the CNN-based algorithm was trained using images obtained on only 2 scanner models from the same vendor, the algorithm was highly accurate in classifying increased uptake in patients from an international trial involving 124 centers that obtained images on different scanner models from different vendors and with variable reconstruction settings. This accuracy underlines the robustness of the CNN despite different image quality. Moreover, this algorithm was not originally trained for TMTV computation and outcome prediction and was developed with data from patients with different lymphoma subtypes and lung cancer who underwent PET at baseline and for response assessment. However, we showed that the algorithm was successful in a group of patients with a homogeneous lymphoma subtype scanned at baseline, enabling the identification of a TMTV cutoff separating high-risk from low-risk patients and predicting prognosis with accuracy comparable to that of the reference method. No subject was excluded because of failure of the initial high-uptake ROI segmentation, which identified at least one high-uptake region in all subjects. Furthermore, comparable results were obtained when different settings of the initial high-uptake ROI segmentation were applied using a lower threshold (2.5 SUV) than the PERCIST-recommended blood-pool–based threshold (Supplemental Tables 2 and 3), suggesting the robustness of the algorithm to the initial segmentation results. Additionally, the accuracy of the high-uptake ROI classification was not substantially impacted when a different level of overlap was required to consider an ROI as matching the TMTVREF and when ROIs with volumes of less than 2 cm3 were included in the analysis (Supplemental Tables 4 and 6).
The median TMTVPARS and the resulting cutoff were lower than those observed for TMTVREF. This finding could be due to multiple factors, including the higher initial SUV threshold used for TMTVPARS relative to the one used for TMTVREF, the manual addition of suspicious regions with low uptake in TMTVREF, regions being classified as physiologic in TMTVPARS but considered suspicious in TMTVREF, and differences in the contouring of suspicious regions between TMTVPARS and TMTVREF. However, the ability of the TMTVPARS estimates to be predictive of PFS and OS despite involving a TMTV range different from that of TMTVREF is consistent with what has already been reported (11,12) when comparing different TMTV estimation methods. This result confirms both the validity of the CNN method and the value of TMTV as a prognostic indicator.
Our study had limitations. Since there is currently no gold standard method for TMTV calculation from 18F-FDG PET/CT images (27), the reported figures of merit supporting the uptake classification performance and accuracy of the TMTV segmentation are limited to the comparison with the reference method considered in the study. Moreover, a uniform cohort of lymphoma patients was evaluated in the current study, and results may differ for different lymphoma subtypes or different cancer types.
In the present work, we evaluated a fully automated application of PARS. However, PARS was initially intended to be used in a supervised manner, allowing the reader to correct for potentially misclassified regions when appropriate. In particular, pitfalls in PET/CT image quality, such as misalignment due to motion or image artifacts, may influence the classification output of the CNN algorithm, and the results should be validated by an expert. This is especially true when the labeling results are used to derive a prognostic index such as TMTV that can be used to stratify the risk and guide personalized therapy. Nevertheless, this approach could be used by expert readers to efficiently estimate TMTV, as the deep-learning–based method is able to automatically identify several relevant suspicious uptake sites and automatically discard physiologic uptake sites, with the expert only having to correct the potential improper classification of a limited number of regions per subject, requiring limited user interaction and potentially improving interreader variability. This approach may introduce bias in the TMTV estimation process by relying on pregenerated results. However, this risk should be marginal, especially when a careful revision of the results is performed by an experienced reader.
To our knowledge, this was the first study showing that an artificial intelligence method can generate a TMTV value prognostic of outcome in a large series of patients with DLBCL, with results comparable to other currently used methodologies. Other machine-learning–based approaches for TMTV estimation in lymphoma patients, including some involving CNN, are being developed and evaluated (28). The automated method for TMTV segmentation assessed in the present study combined a region-delineation method based on PERCIST recommendations and a deep-learning–based classification scheme for rapidly discarding physiologic uptake. Further efforts toward developing a stricter definition of TMTV, standardizing volume-segmentation methods, and establishing guidelines for the inclusion of tumor-bearing anatomic regions are ongoing, and these will constitute a prerequisite for the optimization of a complete automated method (13).
CONCLUSION
We showed that TMTV can be estimated fully automatically using a deep-learning approach. The resulting TMTV was consistent with that obtained by independent experts and showed significant prognostic value for PFS and OS in a large cohort of DLBCL subjects.
DISCLOSURE
This project received funding from the European Union’s Horizon 2020 research and innovation program under the Marie Skłodowska–Curie grant agreement (grant 764458). Nicolò Capobianco is a full-time employee of Siemens Healthcare GmbH. Ludovic Sibille, Bruce Spottiswoode, and Sven Zuehlsdorff are full-time employees of Siemens Medical Solutions USA, Inc. No other potential conflict of interest relevant to this article was reported.
KEY POINTS
QUESTION: Can deep learning be used to obtain an automated estimation of TMTV in baseline 18F-FDG PET/CT for risk stratification in DLBCL patients?
PERTINENT FINDINGS: In a cohort of 280 DLBCL patients from the REMARC trial, a deep-learning algorithm could classify regions of interest with elevated uptake in 18F-FDG PET/CT as physiologic or suspicious in good agreement with expert human reader assessment. By aggregating the regions of interest classified as suspicious uptake by the deep-learning algorithm, the automated TMTV estimates were significant for PFS and OS prediction.
IMPLICATIONS FOR PATIENT CARE: Estimation of TMTV with an automated method using deep learning may contribute to reproducible and accurate identification of high-risk patients with DLBCL.
Footnotes
Published online Jun. 12, 2020.
- © 2021 by the Society of Nuclear Medicine and Molecular Imaging.
Immediate Open Access: Creative Commons Attribution 4.0 International License (CC BY) allows users to share and adapt with attribution, excluding materials credited to previous publications. License: https://creativecommons.org/licenses/by/4.0/. Details: http://jnm.snmjournals.org/site/misc/permission.xhtml.
REFERENCES
- Received for publication January 22, 2020.
- Accepted for publication April 9, 2020.


Jump to section
Related Articles
Cited By...
- Total metabolic tumor volume on 18F-FDG PET/CT is a game-changer for patients with metastatic lung cancer treated with immunotherapy
- Technologist-Based Implementation of Total Metabolic Tumor Volume into Clinical Practice
- 18F-FDG PET Maximum-Intensity Projections and Artificial Intelligence: A Win-Win Combination to Easily Measure Prognostic Biomarkers in DLBCL Patients
- Nuclear Medicine and Artificial Intelligence: Best Practices for Algorithm Development
- Quantification of Metastatic Prostate Cancer Whole-Body Tumor Burden with 18F-FDG PET Parameters and Associations with Overall Survival After First-Line Abiraterone or Enzalutamide: A Single-Center Retrospective Cohort Study