


Abstract
Peptide receptor radionuclide therapy (PRRT) is an effective treatment for patients with neuroendocrine neoplasms. The aim of this study was to identify clinical and treatment parameters associated with progression-free survival (PFS) and overall survival (OS). Methods: All patients treated from October 2002 until March 2016 at the Zentralklinik Bad Berka with at least 3 administrations of PRRT (maximal interval of 6 mo between consecutive administrations) were included. Data were collected in 5 categories: general patient characteristics, tumor characteristics, prior treatments, radioisotope used for PRRT, and blood chemistry. Survival was analyzed using Kaplan–Meier curves. Univariate and multivariate Cox regression analyses were performed to identify parameters associated with PFS and OS. Results: In total, 782 patients were included, with a median follow-up of 36 mo. The median PFS and OS were 22 and 53 mo, respectively. Parameters associated with lower PFS in the multivariate analysis were a Ki-67 of more than 5%, previous treatment with interferon-α and chemotherapy, presence of diabetes, and chromogranin-A (CgA) levels higher than 336 μg/L. Parameters associated with lower OS were a Ki-67 of more than 10%, performance status of at least 1, previous chemotherapy and ablation, and CgA levels higher than 112 μg/L. Conclusion: Higher Ki-67 values, as well as higher CgA levels and previous chemotherapy, had a negative outcome on both PFS and OS. Furthermore, PFS was negatively associated with previous interferon-α treatment and diabetes, whereas lower OS was related to prior ablation and higher performance status.
Well-differentiated neuroendocrine tumors (NETs) arise from neuroendocrine cells, and although they can occur anywhere throughout the body, the most common locations are the gastrointestinal tract, pancreas, and lungs (1). In the United States, NETs comprise 0.5% of new cancer diagnoses, with an incidence of approximately 6.98/100,000/y (2). Most NETs are characterized by expression of the somatostatin receptor (SSTR), which can be exploited for diagnostic imaging and radionuclide therapy. Treatment with radiolabeled somatostatin analogs, called peptide receptor radionuclide therapy (PRRT) (3), was introduced using 111In-pentetreotide (4), followed by 90Y-octreotide and 177Lu-DOTATATE (5). A randomized phase III PRRT clinical trial (NETTER-1) was concluded in 2017 (6). NETTER-1 applied randomized treatment to NET patients between 4 cycles of 177Lu-DOTATATE (plus long-acting octreotide acetate, 30 mg/mo) and a control group with high-dose octreotide (long-acting, 60 mg/mo). The progression-free survival (PFS) was 28.4 mo in the 177Lu-DOTATATE group and 8.4 mo in the control group. On the basis of this trial, PRRT was approved in the United States and Europe for treatment of metastatic or irresectable NETs and is included now in the societal guidelines from the European Neuroendocrine Tumour Society (ENETS), International Atomic Energy Agency, European Association of Nuclear Medicine, and Society of Nuclear Medicine and Molecular Imaging (7,8).
Patient eligibility for PRRT is primarily based on tumor lesion SSTR expression, visualized with 68Ga-labeled somatostatin analog PET/CT. Treatment is effective when sufficient uptake is shown on 68Ga-somatostatin analog PET/CT (3,9). Several studies have investigated nonimaging parameters that affect outcome after PRRT. Ezziddin et al. demonstrated that a proliferation index (or Ki-67) of less than 20% resulted in good response after PRRT, whereas a Ki-67 of more than 20% often led to progression within 3 mo after treatment (10). Ki-67 was also found to be a predictive factor for overall survival (OS) after PRRT in a multivariate analysis (74 patients). Other factors identified were hepatic tumor burden, performance status, and neuron-specific enolase level (11). Brunner et al. found that SSTR type 2 expression is an independent prognostic marker for OS in 279 NET patients. A subgroup analysis of 61 patients with pancreas NET (pNET) showed that SSTR expression is not a prognostic marker for OS in pNET (12). Other nonhistologic parameters associated with survival after PRRT include gene cluster expression (13), primary tumor site (14), resection of the primary tumor (15), dominant liver metastases, and lesion size (14). A previous study to analyze multiple factors was an intention-to-treat analysis and included all patients that started PRRT, but not all received full treatment (16). The aim of the current study was to identify clinical parameters that predict PFS and OS after PRRT in a large patient population.
MATERIALS AND METHODS
Patients
All patients treated with PRRT at Zentralklinik Bad Berka from October 2002 to March 2016 were reviewed. Patients with histopathologically proven NET were referred for PRRT because of progressive metastatic or inoperable disease. Treatment was performed according to the local Bad Berka protocol (17), followed by the ENETS protocol (7) and the International Atomic Energy Agency/European Association of Nuclear Medicine/Society of Nuclear Medicine and Molecular Imaging protocol (8). SSTR expression was confirmed and dedifferentiation excluded by pretherapy 68Ga-somatostatin analog PET/CT and 18F-FDG PET/CT, respectively, and scored as previously described (18). Renal function was evaluated with 99mTc-MAG3 renography, and tubular excretion rate was evaluated (8). An in-house–produced amino acid infusion containing lysine and arginine was given during each administration for nephroprotection (17). Patients were treated with 177Lu, 90Y, or both according to the previously described protocol (17). Written informed consent was obtained from all patients before treatment, including data use for research, and institutional review board approval was obtained. The inclusion criteria for this study were at least 3 administrations of PRRT and a maximum of 6 mo between consecutive administrations. Patients previously treated with PRRT at a different center were excluded.
Data Collection
Data were collected in 5 categories: general patient characteristics, tumor characteristics, prior treatments, PRRT radionuclide, and laboratory parameters and tumor biomarkers. Progression was determined on the basis of RECIST or PERCIST criteria (19,20). Progression and survival were determined in January 2017. PFS was calculated from the start of PRRT to progression or death from any cause. OS was calculated from the start of PRRT to death from any cause.
Statistical Analysis
Statistical analyses were performed in SPSS, version 22.0 (IBM). In the case of nonnormal distribution in a histogram, the variable was categorized in quartiles 1, 2, 3, and 4 (Q1, Q2, Q3, and Q4, respectively). Univariate Cox regression was performed to determine the association between single parameters and PFS and OS. In order not to be too stringent, the multivariate Cox regression model included all parameters with a P value of less than 0.1 in the univariate analysis. Accordingly, after every iteration the parameter with the highest P value (above P > 0.05) was removed from the multivariate model (backward selection). The final model contained only variables significantly (P < 0.05) associated with survival. In addition, survival per primary tumor location and after primary tumor resection was evaluated.
RESULTS
Patient and PRRT Characteristics
In total, 1,425 patients were reviewed, of whom 782 met the inclusion criteria. The median follow-up time was 36.0 mo (range, 4–155 mo). The mean age before treatment was 60.3 y, and 94.2% of the patients were in good health (World Health Organization [WHO] 0–1). Most tumors (92.4%) were G1/G2. Regarding other treatments, 33.2% of patients were given 1 treatment; 24%, 2 treatments; and 12.9%, 3–5 treatments before PRRT, whereas 29.7% of patients were treatment-naïve. PRRT consisted of 3 administrations (50.4%), 4 administrations (42.1%), or 5–6 administrations (7.5%). Half of the patients were treated with both 177Lu and 90Y (Supplemental Table 1; supplemental materials are available at http://jnm.snmjournals.org), whereas 37.7% received 177Lu only and 12.3% 90Y only. Most patients had NETs originating from the small intestine (28.3%) or pancreas (35.4%), and 50% of the patients had a functional tumor. All patient characteristics are shown in Table 1. Table 2 presents the PFS and OS per primary tumor location, showing that gastroenteropancreatic NETs have a higher PFS and OS.
Patient, Tumor, and Treatment Characteristics
PFS and OS per Primary Tumor Location
PFS
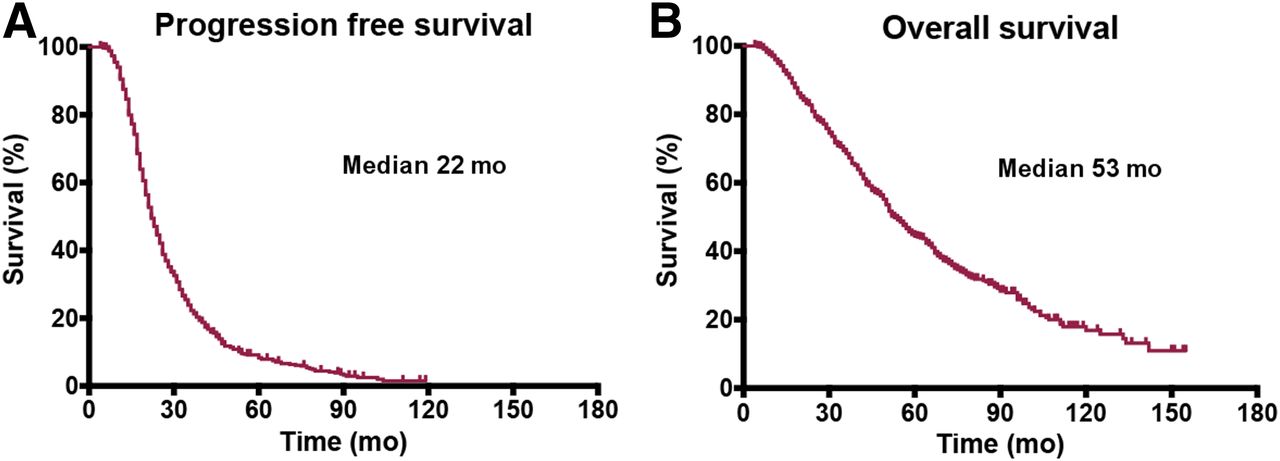
Progression was observed in 643 patients (82.2%), with a median PFS of 22 mo (interquartile range [IQR], 14.0–31.3; Fig. 1A). In univariate analyses, 10 parameters were associated with lower PFS: primary tumor in the lung compared with primary tumor in the small intestine (hazard ratio [HR], 1.625; confidence interval [CI], 1.186–2.226), performance status (WHO 1 [HR, 1.352; CI, 1.127–1.623] and WHO 2/3 [HR, 1.741; CI, 1.262–2.402] compared with WHO 0), and prior treatments with chemotherapy (HR, 1.362; CI, 1.123–1.652), interferon-α (HR, 1.487; CI, 1.046–2.114), and radiotherapy (HR, 2.059; CI, 1.420–2.984). Furthermore, Ki-67 for Q3 (Ki-67 = 5%–10% [HR, 1.466; CI, 1.111–1.934]), and Q4 (Ki-67 > 10% [HR, 1.631; CI, 1.230–2.163]), resulted in lower PFS than Ki-67 for Q1 (Ki-67 < 2%). Finally, initial chromogranin-A (CgA) levels for Q3 (CgA = 336–1,168 μg/L [HR, 1.580; CI, 1.241–2.011]) and Q4 (CgA > 1,168 μg/L [HR, 2.148; CI, 1.679–2.747]) were associated with lower PFS than CgA for Q1 (CgA < 112 μg/L). Only the combination of 177Lu and 90Y was positively associated with PFS compared with 177Lu alone (HR, 0.797; CI, 0.672–0.944). Different treatment strategies concerning the isotopes resulted in median PFS of 20 mo for 177Lu, 25 mo for 90Y, and 23 mo for treatment with both isotopes. Finally, G3 tumors showed lower PFS than G1 (HR, 1.522; CI, 1.062–2.180), with a median of 23 mo for G1, 21 mo for G2, and 18 mo for G3.

Kaplan–Meier curves of PFS (A) and OS (B).
The final multivariate model included Ki-67 for Q3 (HR, 1.419; CI, 1.041–1.935) and Q4 (HR, 1.493; CI, 1.090–2.045), compared with Q1, prior treatment with chemotherapy (HR, 1.375; CI, 1.039–1.820), interferon-α (HR, 2.054; CI, 1.211–3.485), presence of diabetes (HR, 1.706; CI, 1.117–2.605), and CgA for Q3 (HR, 1.469; CI, 1.084–1.992) and Q4 (HR, 2.039; CI, 1.488–2.794). All significant results regarding PFS are shown in Table 3, and the full results are in Supplemental Table 2.
PFS Analysis
OS
Median OS was 53 mo (IQR, 18.0–57.0), and death from any cause was observed in 405 patients (51.8%) (Fig. 1B). Eleven parameters were associated with lower OS in univariate analyses: primary tumor in the pancreas (HR, 1.519; CI, 1.184–1.948), large intestine (HR, 1.594; CI, 1.003–2.533), and lung (HR, 1.716; CI, 1.150–2.560) compared with the small intestine; performance status (WHO 1 [HR, 1.781; CI, 1.432–2.214] and WHO 2/3 [HR, 2.817; CI, 1.941–4.089] compared with WHO 0); and prior treatment with ablation (HR, 1.458; CI, 1.103–1.928), interferon-α (HR, 1.504; CI, 1.002–2.256), radiotherapy (HR, 1.780; CI, 1.120–2.829), and chemotherapy (HR, 1.792; CI, 1.434–2.239). Ki-67 for Q3 (HR, 1.519; CI, 1.051–2.194) and Q4 (HR, 2.143; CI, 1.488–3.087) resulted in lower PFS than Ki-67 for Q1. Furthermore, initial CgA levels for Q2 (112–336 μg/L [HR, 1.531; CI, 1.100–2.131], Q3 (HR, 1.887; CI, 1.354–2.631) and Q4 (HR, 3.357; CI, 2.434–4.631) were associated with lower PFS than CgA for Q1. Both resection of the primary tumor (HR, 0.715; CI, 0.584–0.877) and the combination of 177Lu and 90Y compared with 177Lu alone (HR, 0.792; CI, 0.636–0.986) were associated with improved OS. The median OS was 48 mo for patients treated with only 177Lu, 57 mo for patients treated with only 90Y, and 56 mo for patients treated with both isotopes. Finally, G2 tumors (HR, 1.394; CI, 1.065–1.826) and G3 tumors (HR, 2.473; CI, 1.621–3.772) showed lower OS than G1 tumors, with a median of 74 mo for grade 1, 51 mo for grade 2, and 26 mo for grade 3. For selected results, Kaplan–Meier curves are shown in Figures 2 and 3.
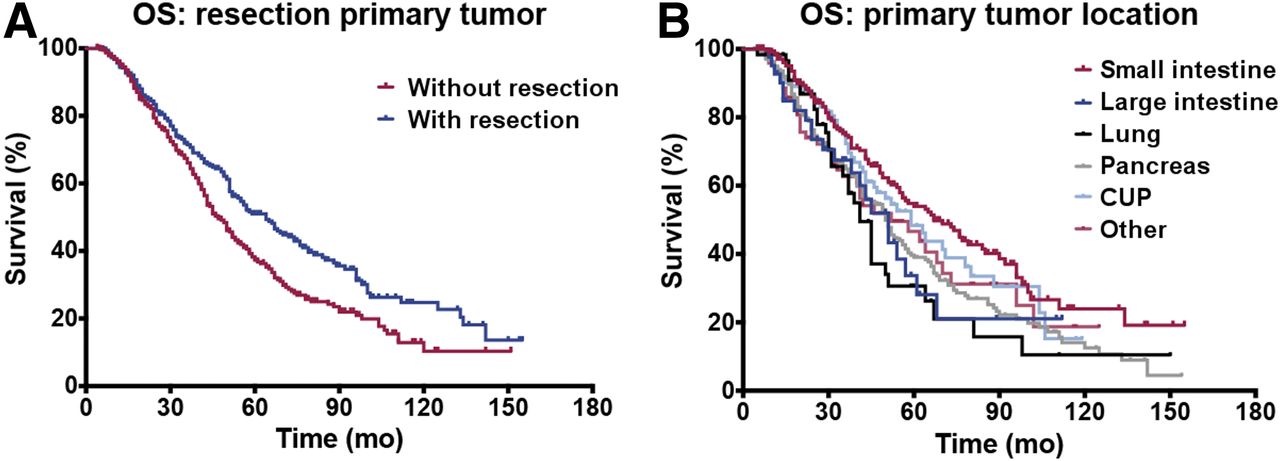
Kaplan–Meier curves of OS after resection of primary tumor and OS per primary tumor location. Median OS is 43 and 65 mo without and with resection, respectively. Median OS is 67 mo for small-intestine NETs, 51 mo for large intestine, 41 mo for lung, 50 mo for pancreas, 59 mo for cancer of unknown primary (CUP), and 52 mo for other NETs.
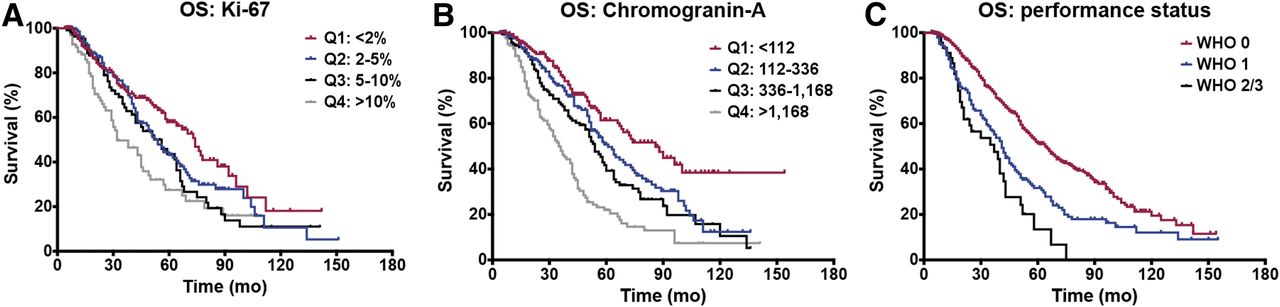
Kaplan–Meier curves of OS per Ki-67 and CgA quartiles and performance status classes. Median OS is 74 mo for Ki-67 < 2%, 54 mo for 2%–5%, 56 mo for 5%–10%, and 32 mo for >10%. Median OS is 86 mo for CgA < 112, 61 mo for 112–336, 54 mo for 336–1,168, and 35 mo for >1,168. Median OS is 64 mo for WHO 0, 41 mo for WHO 1, and 37 mo for WHO 2/3.
In the multivariate analysis, the following parameters were associated with lower OS: Ki-67 for Q4 (HR, 1.930; CI, 1.285–2.899) compared with Q1, performance status (WHO 1 [HR, 1.551; CI, 1.109–2.169] and WHO 2/3 [HR, 2.305; CI, 1.432–3.713] compared with WHO 0), ablation (HR, 1.519; CI, 1.041–2.215), chemotherapy (HR, 1.979; CI, 1.412–2.773), and CgA for Q2 (HR, 1.690; CI, 1.095–2.608), Q3 (HR, 1.816; CI, 1.718–2.799), and Q4 (HR, 2.671; CI, 1.717–4.155) compared with CgA for Q1. The median OS was 47 mo (IQR, 29–80) without and 64 mo (IQR, 32–112) with resection of the primary tumor, significantly different in primary pancreas or small-intestine NETs after univariate Cox regression analysis (Table 4). All results with regard to OS are shown in Table 5 and Supplemental Table 3.
Resection of Primary per Tumor Location
OS Analysis
DISCUSSION
The reported PFS in other studies (32–41 mo) is higher than in the current study (22 mo). Meanwhile, the OS (43 mo) of the current patient cohort was within the reported range in the literature (38–82 mo) (21–26). However, differences between the current study and the literature exist. One study reported higher PFS and OS, yet only gastroenteropancreatic NET patients were included (22). These patients are known to have a better survival than patients with primary lung and colon NETs (27). Another study included only patients with G1/G2 tumors, who are likely to have a longer OS than patients with G3 tumors (24). In our study, high-risk patients with characteristics such as G3 tumors, WHO 2/3, and nongastroenteropancreatic NETs were also included.
Tumor grade was significantly associated in the univariate analysis with both PFS and OS. Differences in survival between G1 and G2 tumors were previously shown (28); however, this study observed differences only in the univariate analysis. Because tumor grade and Ki-67 index are related (29), both indicate a more aggressive tumor, whereas the latter is generally associated with shorter OS (30). Ezziddin et al. showed in 74 patients that patients with a Ki-67 of more than 10% have both lower PFS and lower OS (11). In the current study, this finding was confirmed from a Ki-67 of more than 5% for PFS and more than 10% for OS in multivariate analysis. The performance status is a well-known factor that affects PFS and OS regardless of tumor type. The current study found that patients with WHO 1 and WHO 2/3 have decreased OS compared with patients with WHO 0, a result that was also confirmed by another study (25).
Our data showed a reduction in PFS and OS in both univariate and multivariate analysis in patients pretreated with chemotherapy, as was also demonstrated in other studies (23,25). Additional analysis in our dataset revealed that of the 43 patients with a G3 tumor, 19 (44%) were treated with chemotherapy, whereas among patients with G1 and G2 tumors, only 12% and 23%, respectively, were treated with chemotherapy. According to current ENETS guidelines, chemotherapy is indicated for G3 neuroendocrine neoplasms (31). Therefore, the association between chemotherapy and survival might be the result of high-grade tumor patients receiving chemotherapy.
Resection of the primary tumor significantly improved OS (47 vs. 64 mo), significantly different in primary pNETs or small intestine NETs after univariate Cox regression analysis (Table 4). Bertani et al. reported an OS of 112 mo without resection and 65 mo with resection, and resection increased the median PFS (70 vs. 30 mo). The longer OS reported could be explained by solely including G1/G2 pNET patients with liver metastases only (15). Prolonged OS after resection of the primary tumor was also observed in pNET populations in a systematic review and metaanalysis (32). According to current guidelines, resection of the primary tumor is indicated for G1/G2 tumors with curative intent, and the presence of liver or lymph node metastases is not a contraindication for primary tumor resection (31). Resection of a primary pNET is hypothesized to improve survival because of underlying anatomic and biologic mechanisms. First, part of the pancreatic venous blood flow drains into the portal vein, which directly flows into liver parenchyma, which is therefore the first organ reached by metastatic pNET cells (seed-and-soil hypothesis). Second, the liver might be more susceptible to metastases because of its microenvironment with stromal build-up, growth factors, and immune cells (metastatic niche hypothesis) (33,34). Thus, resection of the primary tumor, as the source of metastasizing cells, may improve survival even in the presence of metastases.
High levels of the biomarker CgA were associated with lower PFS and OS in the current patient population. CgA levels greater than 336 μg/L before PRRT were predictors for lower PFS, where for OS this level was greater than 112 μg/L. Previous studies showed that CgA levels greater than 600 μg/L were associated with shorter PFS and OS in smaller patient populations (35,36). The current ENETS guidelines indicate that high CgA levels indicate poorer prognosis, probably associated with a high tumor load (29,37).
In the current study, the choice of the radioisotope did not influence PFS and OS in the multivariate analysis. In the univariate analysis, however, the combination of 177Lu and 90Y improved OS and PFS compared with 177Lu alone. This result is different from the results of a German cohort study, in which treatment with only 90Y was associated with decreased OS compared 177Lu only or tandem PRRT (177Lu and 90Y concurrently) (21). Nevertheless, it is known that 90Y implies a risk for nephrotoxicity compared with 177Lu alone (38). However, a bias in radionuclide selection exists in the current study because patients with a large tumor burden often receive tandem PRRT (17).
Besides the disadvantages inherent in a retrospective analysis, this study had other limitations. First, information about the extent of the disease (tumor burden and hepatic involvement) was not included, because the goal was to define non–imaging-related parameters. Second, patients could have received other treatments after PRRT, which could have extended their survival, but this aspect was beyond the scope of this research. Also, toxicity was not covered in this study but has been evaluated in another large multivariate analysis (38). Nephrologic disease could decrease life expectancy, yet nephrotoxicity and related side effects due to medical interventions were not taken into consideration as confounders for survival in this study.
The association of some parameters in this dataset with PFS and OS has already been described in other papers (12,23,25,28–30,32,35,36). However, to our knowledge, this is the first study that combines all parameters in a multivariate analysis. The fact that some patients have factors that are related to shorter PFS or OS does not indicate that PRRT is an unsuitable treatment for these patients. Patients could still respond to treatment and have a longer PFS or OS compared with other treatments. This is especially true for patient with G3 tumors or SSTR-positive neuroendocrine carcinomas (39). Furthermore, this study might help physicians and patients manage expectations from PRRT based on individual characteristics.
CONCLUSION
Higher Ki-67 values, as well as higher CgA levels and previous chemotherapy, had a negative outcome on both PFS and OS. Furthermore, PFS was negatively associated with previous interferon-α treatment and diabetes, whereas lower OS was related to prior ablation and higher performance status.
DISCLOSURE
Richard Baum received honoraria from Ipsen Pharma, ROTOP Pharmaka, OctreoPharm Sciences GmbH, and Advanced Accelerator Applications outside the submitted work. No other potential conflict of interest relevant to this article was reported.
KEY POINTS
QUESTION: Can clinical and treatment parameters be associated with progression-free survival (PFS) and overall survival (OS) after peptide receptor radionuclide therapy (PRRT)?
PERTINENT FINDINGS: Patients (n = 782) treated with at least 3 cycles of PRRT were retrospectively reviewed, data were collected in 5 categories (general patient characteristics, tumor characteristics, prior treatments, radioisotope used for PRRT, blood chemistry), and univariate and multivariate Cox regression analyses were performed. Higher Ki-67 values, higher chromogranin-A levels, and previous chemotherapy had a negative outcome on both PFS and OS; lower PFS was associated with previous interferon-α treatment and diabetes; and lower OS was related to prior ablation and higher performance status.
IMPLICATIONS FOR PATIENT CARE: Knowledge of parameters associated with PFS and OS after PRRT can guide both physicians and patients in their choice for PRRT.
Acknowledgments
We thank Karin Niepsch for her support in data collection.
Footnotes
Published online Mar. 8, 2019.
- © 2019 by the Society of Nuclear Medicine and Molecular Imaging.
REFERENCES
- Received for publication December 12, 2018.
- Accepted for publication February 6, 2019.


Jump to section
Related Articles
Cited By...
- No citing articles found.