


Abstract
The aim of this work was to evaluate 82Rb PET/CT as a diagnostic tool for quantitative tumor blood flow (TBF) imaging in prostate cancer (PCa). Study 1 was performed to evaluate 82Rb as a marker of TBF, using 15O-H2O PET as a reference method. Study 2 investigated the ability of 82Rb uptake measurements to differentiate between PCa and normal prostate. Methods: Study 1: 9 PCa patients scheduled for radical prostatectomy were included. Prostate multiparametric MRI and both cardiac and pelvic 15O-H2O PET and 82Rb PET were performed. PET findings were compared with postprostatectomy Gleason grade group (GGG). Study 2: 15 primary high-risk PCa patients and 12 controls without known prostate disease were included in a clinical drug trial (EudraCT 2016-003185-26). 68Ga-prostate-specific membrane antigen PET/CT scans of PCa patients were available. Pelvic 82Rb PET was performed. Results: Study 1: both 82Rb K1 and 82Rb SUVs correlated strongly with 15O-H2O TBF (ρ = 0.95, P < 0.001, and ρ = 0.77, P = 0.015, respectively). 82Rb SUV and K1 were linearly correlated (r = 0.92, P = 0.001). 82Rb SUV correlated with postprostatectomy GGG (ρ = 0.70, P = 0.03). Study 2: 82Rb SUV in PCa (3.19 ± 0.48) was significantly higher than prostate 82Rb SUV in healthy controls (1.68 ± 0.37) (P < 0.001), with no overlap between groups. Conclusion: Study 1 shows that 82Rb PET/CT can be used for TBF quantification and that TBF can be estimated by simple SUV and suggests that 82Rb SUV is associated with postprostatectomy GGG and, hence, cancer aggressiveness. Study 2 shows that 82Rb uptake is significantly higher in PCa than in normal prostate tissue with no overlap between cohorts, confirming the primary hypothesis of the clinical trial. Consequently, 82Rb PET/CT may have potential as a noninvasive tool for evaluation of tumor aggressiveness and monitoring in nonmetastatic PCa.
Prostate cancer (PCa) is the most common malignancy in men and responsible for 8% of male cancer deaths, making it a major cause of cancer deaths (1,2). However, the disease is heterogeneous, and most patients with PCa will die from other causes, even with conservative cancer management. Consequently, the classification into significant cancer and insignificant cancer, which rely on risk evaluation, becomes an important challenge in PCa management (3).
The PCa diagnosis and risk evaluation are usually based on prostate-specific antigen (PSA) sampling, digital rectal examination, and random transrectal biopsies, which both are unpleasant and cause potentially severe side effects (4). PCa, including high-grade cancers, is common among men with PSA values under 4.0 ng/mL (5), and the number of false-negative random sextant biopsies is relatively high (6). Because this procedure presents only a rough assessment of the underlying tumor biology, it results in considerable overtreatment (7).
The use of multiparametric MRI (mpMRI) with the Prostate Imaging Reporting and Data System (PI-RADS) score (8) for diagnosis (9), biopsy guidance, and monitoring of PCa patients (10) has increased over recent years because mpMRI has a high sensitivity, specificity, and negative predictive value (11). mpMRI has thereby made a major impact on detection of clinically significant PCa (3). Although an inverse relationship between apparent diffusion coefficient value and aggressiveness determined by Gleason score has been established in peripheral-zone cancers, mpMRI does not assess the exact tumor aggressiveness. Because induction of angiogenesis is one of the hallmarks of cancer (12,13), a noninvasive quantitative estimation of tumor blood flow (TBF) may assess tumor aggressiveness. This would enable repeated measurements of the tumor’s malignant potential, which could make a valuable contribution to the existing panel of diagnostic imaging in PCa at the time of diagnosis, but especially in evaluation of patients in active surveillance or active treatment.
TBF is generally increased in more aggressive PCa, and contrast-enhanced imaging provides additional information on functional tumor characteristics in mpMRI (14). Dynamic 15O-H2O PET is the gold standard of measuring blood flow in humans. Recently, we demonstrated that absolute quantification values of perfusion measured by dynamic 15O-H2O PET in PCa are highly correlated with postprostatectomy Gleason grade group (GGG) (15). Thus, this method is a promising noninvasive diagnostic tool for measurement of tumor aggressiveness. However, the method requires an on-site cyclotron to produce the short-lived 15O tracer, which is not possible in most clinical PET centers. Several other PET tracers are used for quantification of blood flow. A clinically interesting alternative to 15O-H2O is 82Rb, a potassium analog with intracellular trapping in metabolically active tissues at a rate proportional to tissue blood flow. Contrary to 15O-H2O, 82Rb is retained in the tissue, allowing both absolute quantifications using kinetic modeling and semiquantitative measurements using SUVs in late-uptake images. 82Rb is generator-produced and is widely used for myocardial blood flow quantification in high-throughput clinical settings. Consequently, 82Rb could be a relevant tracer for PCa blood flow measurements in a clinical setting but has not been previously studied in this context.
Validating a tracer for a novel indication requires several steps, and here we present 2 substudies. The main purposes of study 1 were to perform an analytic validation of tumor perfusion measurement by dynamic 82Rb PET compared with the gold standard method, dynamic 15O-H2O PET; to determine whether simplified semiquantitative measurements using SUV can be used comparatively with absolute kinetic quantification; and finally, to evaluate the correlation between TBF and characteristics of PCa aggressiveness. The main purpose of study 2 was to compare TBF with blood flow in healthy prostate tissue in a control group without known prostate disease as the primary endpoint of a clinical trial.
MATERIALS AND METHODS
Patient Population
Study 1
Nine patients with PCa, scheduled for radical prostatectomy, were included in a pilot study. Because of irregularity in the 82Rb infusion, one patient was excluded from kinetic analysis. mpMRI, PSA, and postprostatectomy GGG were available in these patients. As illustrated in Figure 1, 4 PET scans were performed per patient: pelvic and cardiac dynamic 15O-H2O PET and 82Rb PET. PET images were fused to MRI for tissue delineation for volume-of-interest (VOI) analysis.
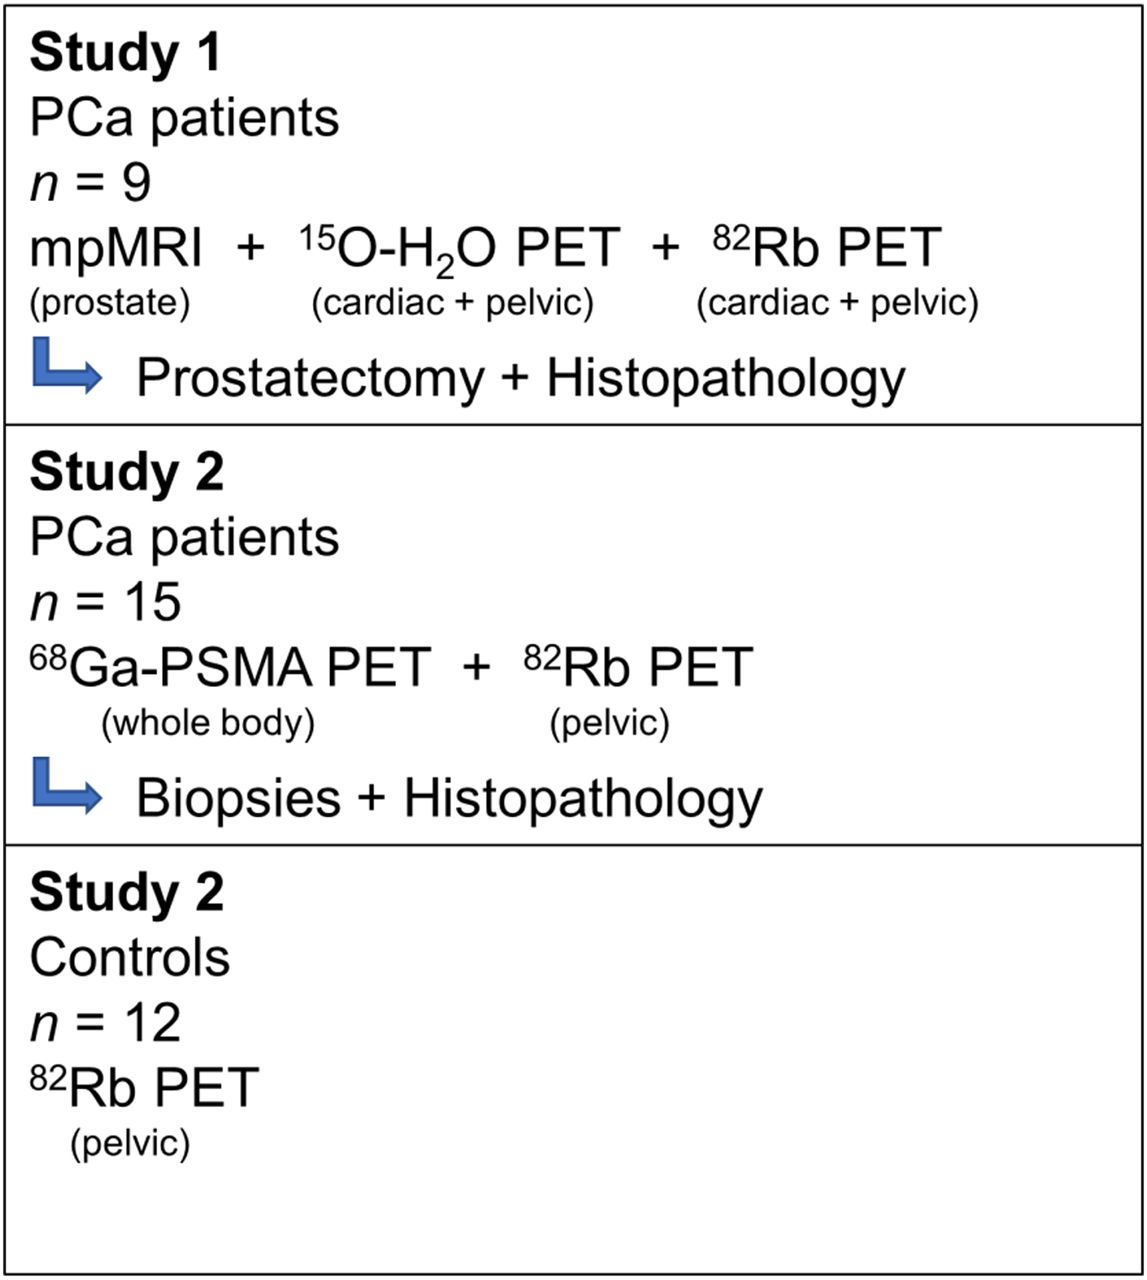
Overview of study groups.
Study 2
Fifteen patients with high-risk PCa (D’Amico criteria (16)) who had undergone 68Ga-prostate-specific membrane antigen (PSMA) PET/CT were included. 68Ga-PSMA PET/CT, PSA, and needle-biopsy GGG were available in these patients. Pelvic 82Rb PET was performed (Fig. 1). 82Rb PET images were fused to 68Ga-PSMA PET/CT for tissue delineation for VOI analysis. Fifteen controls were recruited from patients referred for myocardial blood flow examination with 82Rb PET. The controls had no urinary tract symptoms, and no known prostate disease, and a PSA blood sample was taken. Three controls were subsequently excluded. A pelvic 82Rb PET/CT scan was performed before clinical cardiac examination.
The institutional review board (Central Denmark Region Committees on Health Research Ethics) approved both studies, and all subjects gave written informed consent. The Danish Medicines Agency approved study 2 as a drug trial monitored by the Unit of Good Clinical Practice, EudraCT number 2016-003185-26.
Imaging
Study 1
Both pelvic and cardiac 15O-H2O PET scans were performed on a Biograph TruePoint PET/CT scanner (Siemens). Bolus injection of 15O-H2O (400 MBq) at the beginning of each scan was performed with a MedRad Contrast Infusion Pump (1 mL/s) followed by infusion of 30 mL of saline. Arterial blood sampling was performed using an automatic blood sampler (Allogg ABSS), and delay and dispersion correction was performed. Both pelvic and cardiac 82Rb PET scans of the patients were performed on a Discovery 690 PET/CT scanner (GE Healthcare). A low-dose CT scan was performed before the scans for attenuation correction. 15O-H2O and MRI scans have previously been described by Tolbod et al. (15).
Study 2
Pelvic 82Rb scans of the patients and controls were performed on a Discovery MI Digital Ready PET/CT device (GE Healthcare). 68Ga-PSMA PET/CT was performed according to clinical guidelines.
Studies 1 and 2
Both GE Healthcare scanners have the same PET detector configuration, and the same PET reconstruction algorithm was used. A low-dose CT scan was used for attenuation correction, and all common corrections were applied. Scans (8 min) were performed in list mode with extraction of a static (3 to 7 min after injection) and a dynamic image series (frame structure: 22 × 5 s, 6 × 10 s, 4 × 20 s, 4 × 40 s, 1 × 60 s). PET images were reconstructed using the VuePointFX reconstruction algorithm (2 iterations, 24 subsets) in a 3.27 × 3.27 × 3.27 mm (5-mm transaxial gaussian postprocessing filter and 3-point axial convolution postprocessing filter [1 4 1]) and a 2.18 × 2.18 × 3.27 mm matrix (4-mm transaxial gaussian postprocessing filter and 3-point axial convolution postprocessing filter [1 61]) for the static and dynamic series, respectively. Bolus injection of 82RbCl (1,110 MBq) at the beginning of each scan was performed directly by the Cardiogen-82 generator infusion system (Bracco).
Image Analysis
Study 1
Fusion of the T2-weighted mpMRI images with the low-dose CT scans and, subsequently, with both the 15O-H2O and 82Rb PET scans was performed using Carimas software (Turku PET Centre) (17). The tumor VOIs were drawn directly on the mpMRI, using both T2-weighted and diffusion-weighted images. The VOIs were transferred to the PET series, and time–activity curves were extracted. To calculate K1, input function from arterial blood sampling was used for 15O-H2O PET, and cardiac image–derived arterial input function was used for 82Rb PET, as described in detail by Tolbod et al. (15). Kinetic modeling using a 1-tissue-compartment model for both tracers was performed (15). SUV analysis was performed using the static image series (3 to 7 min after injection).
Study 2
The 68Ga-PSMA PET/CT scans were fused with the low-dose CT scans and the 82Rb PET scans using Hybrid Viewer (Hermes Medical Solutions). The tumor VOIs were drawn directly on the 68Ga-PSMA PET/CT images by visual guidance from PSMA activity and transferred to the 82Rb PET static images (primary endpoint) and using a 60% threshold 3-dimensional VOI at the 82Rb PET hot spot (secondary endpoint). The VOIs of the total prostate gland were drawn manually on the low-dose CT scan of both patients and controls. Furthermore, VOIs of the bladder, seminal vesicles, and bone were drawn for obtaining normal-tissue reference values. No kinetic analysis was performed.
Statistical Analysis
Study 1
Correlation between tumor perfusion measured by 15O-H2O K1 and 82Rb PET K1 and between 15O-H2O K1 and 82Rb PET SUV was analyzed using Spearman rank correlation, as the correlation is monotonic but nonlinear. The linear correlation between 82Rb PET K1 and 82Rb SUV was analyzed using Pearson correlation.
Study 2
The difference in tumor perfusion drawn by visual PSMA guidance and by the 60% threshold 3-dimensional VOI method in the patients, compared with normal prostate tissue in the controls, was analyzed using t testing for difference in means.
Studies 1 and 2
Correlations between tumor 82Rb SUV and PSA were analyzed using Pearson correlation. Correlations between tumor 82Rb SUV and GGG were analyzed using Spearman rank correlation, as GGG is an ordinal scale. Data were tested for normality using the Shapiro–Wilk W test. P values of less than 0.05 were considered statistically significant. Analysis was performed in STATA, version 15.1 (StataCorp LLC).
RESULTS
Dynamic 82Rb PET/CT and 82Rb SUV Measure Prostate TBF Precisely
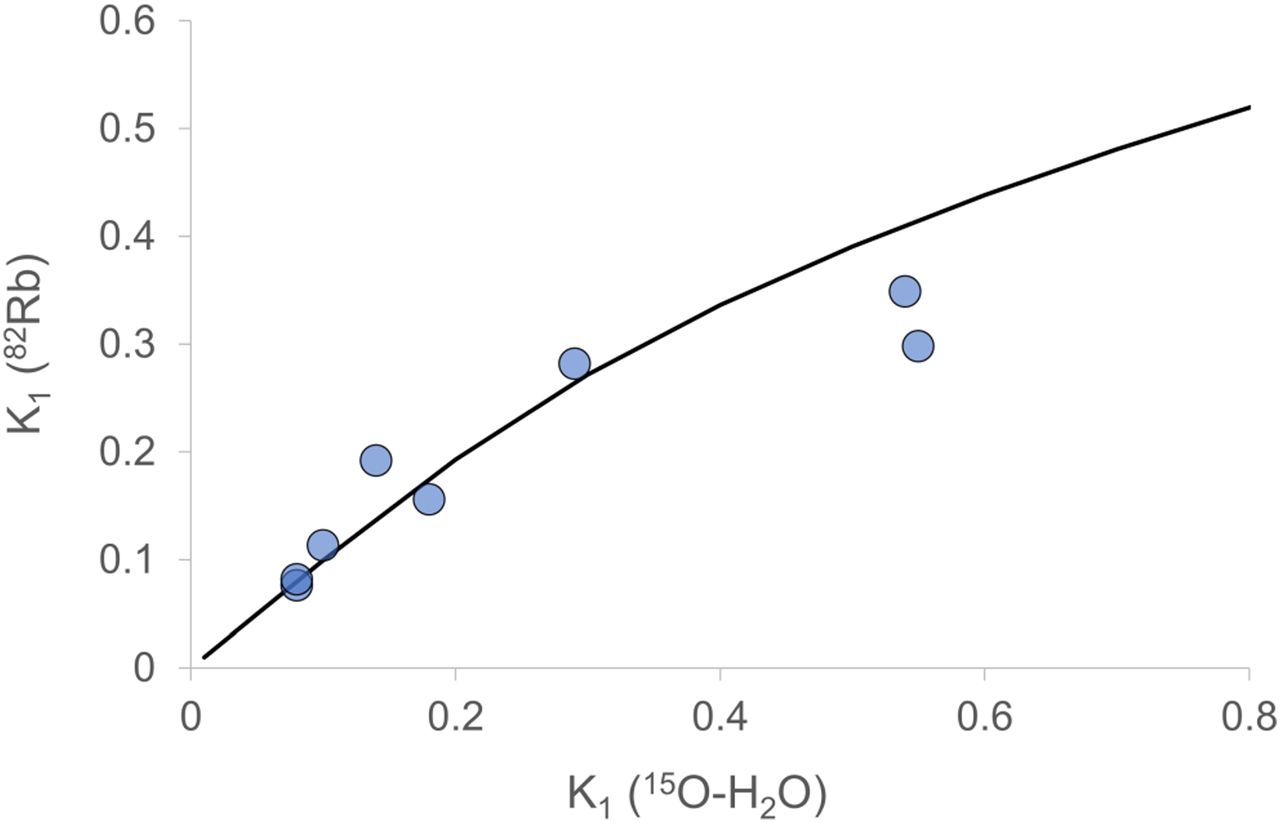
In study 1, TBF estimated from 15O-H2O K1 images and 82Rb PET K1 images was highly correlated, as shown in Figure 2 (ρ = 0.95, P < 0.001). The correlation between 15O-H2O K1 and 82Rb PET SUVmean was ρ = 0.77 (P = 0.015). The curve levels off at values above 0.3 mL/min/mL in full accordance with the known nonlinear correction for incomplete extraction of 82Rb known from myocardial blood flow measurements (18). Thus, our data match the incomplete extraction curve of 82Rb quite well.

Rubidium vs. water (tumor tissue only). ρ = 0.95, P = 0.001. Curve is extraction curve from Lortie et al. (18).
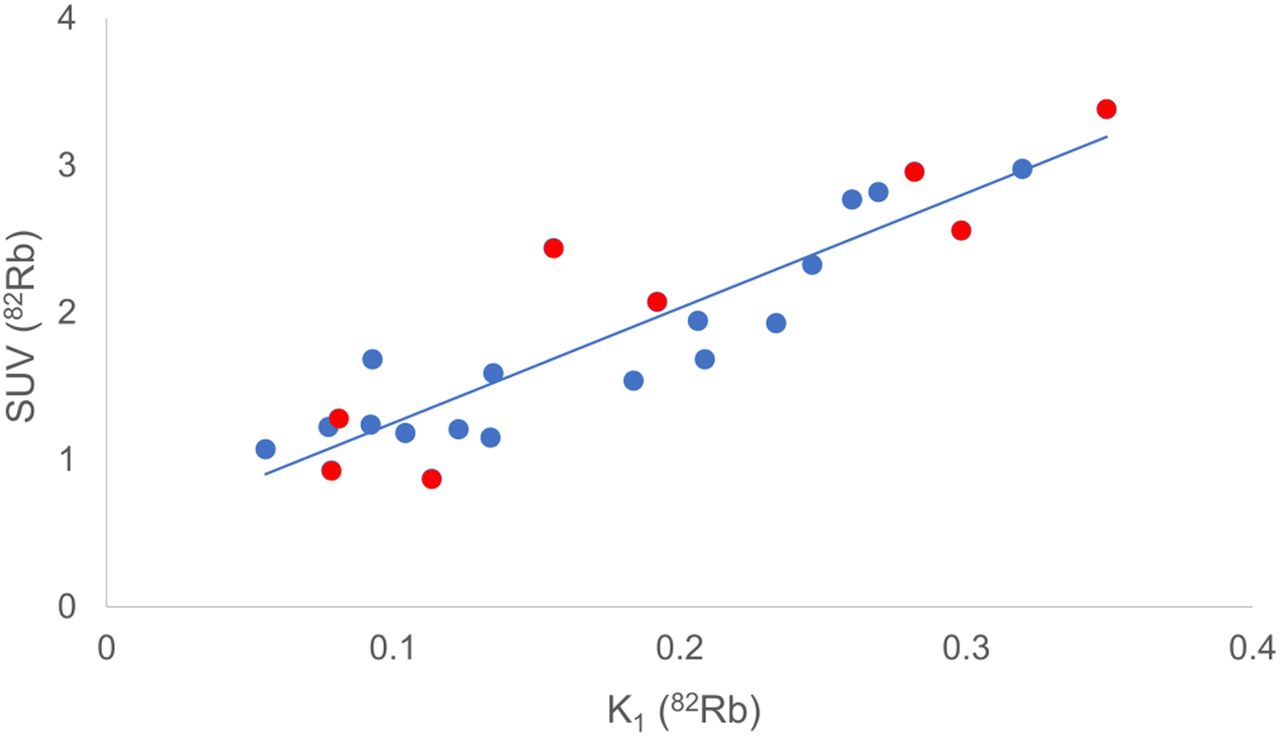
Figure 3 illustrates an excellent correlation between 82Rb blood flow measurement with K1 images using cardiac image–derived input functions and 82Rb SUVmean (r = 0.92, P = 0.001). An example of the series of images in study 1 can be found in Figure 4A (patient 3).

Rubidium: SUV vs. K1 (all tissues). Tumor is shown in red, correlation for tumor only (r = 0.92, P = 0.001).
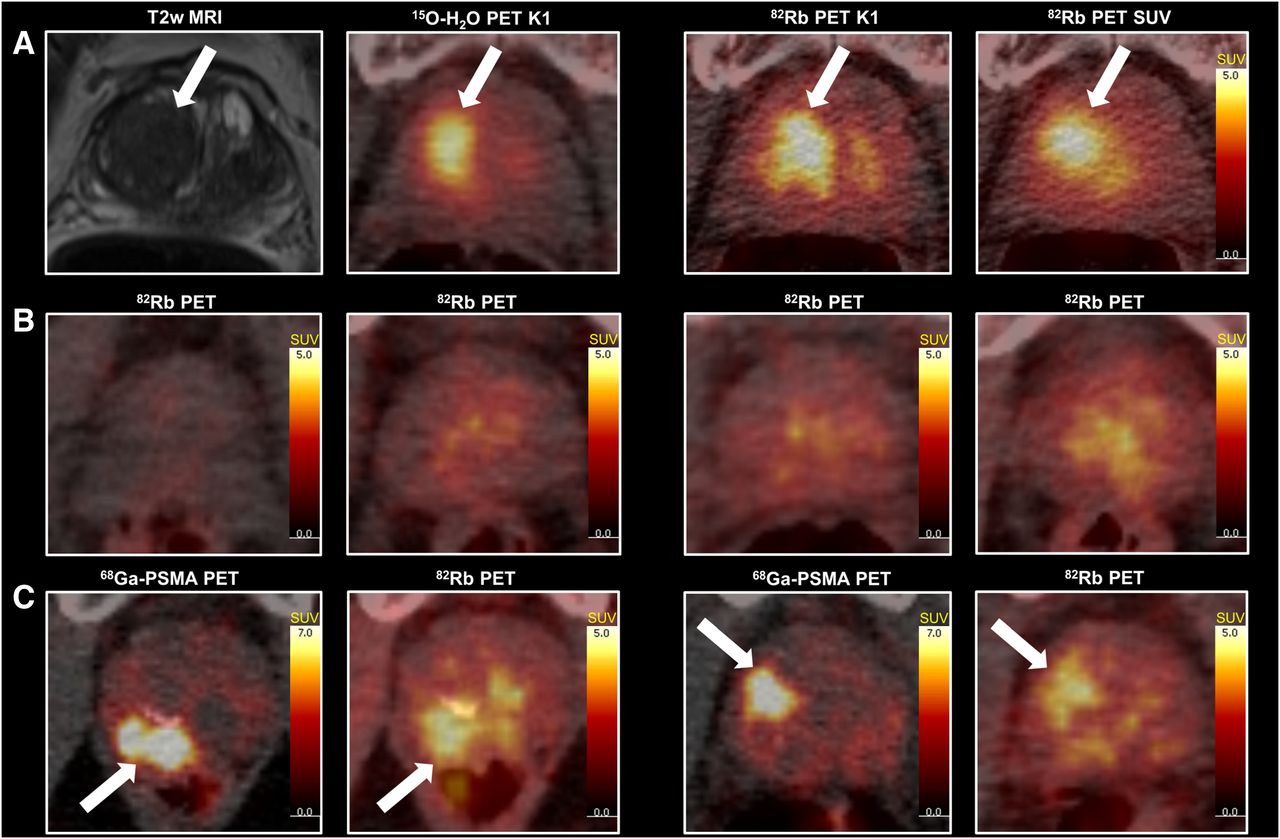
Row A shows patient 3 from study 1. From left: T2-weighted MRI, 15O-H2O PET K1 (80% of maximum), 82Rb PET K1 (80% of maximum), and 82Rb PET SUV. Row B shows 82Rb PET of 4 controls from study 2. From left: control 5 (lowest SUVmean), control 3, control 6, and control 9 (highest SUVmean). Row C shows 68Ga-PSMA PET images and 82Rb PET images of 2 patients from study 2. To left is peripheral zone tumor (patient 14), and to right is transitional zone tumor (patient 2).
Blood Flow Is Higher in PCa Than in Healthy Prostate Tissue
Figure 4B shows examples of 82Rb scans of the controls of study 2, ranging from the lowest SUVmean (left) to the highest SUVmean (right). For comparison, 2 examples of the correlation between 68Ga-PSMA PET and 82Rb PET are shown in Figure 4C. Both tumors had highly increased blood flow on 82Rb PET images.
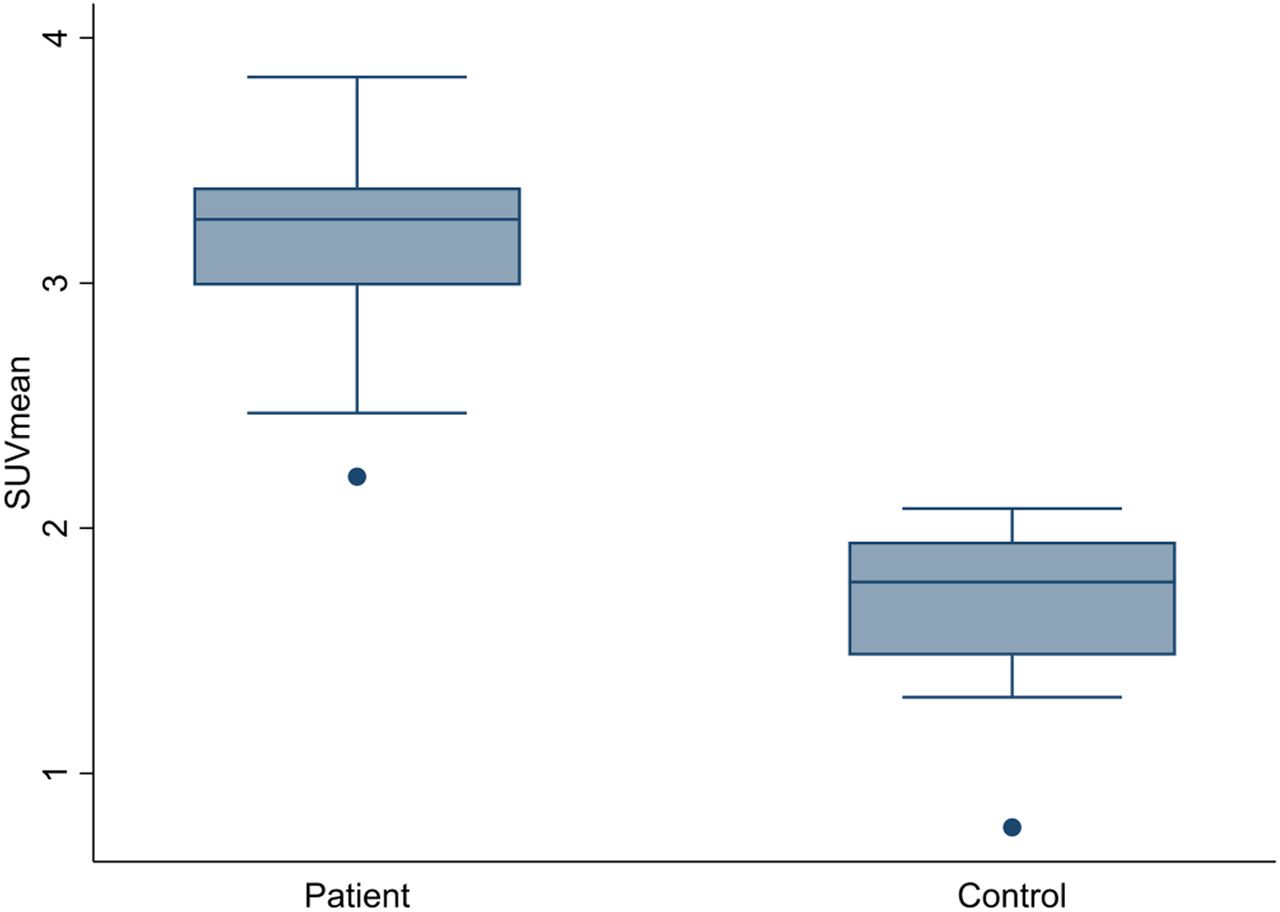
Tumor 82Rb SUVmean in the patients, drawn by PSMA guidance (3.19 [2.91–3.46]) was significantly higher (P < 0.001) than 82Rb SUVmean in healthy prostate tissue of the controls (1.68 [1.44–1.91]) (Fig. 5) (primary endpoint). The same was found for 82Rb SUVmean estimated without external guidance using the 60% threshold method on 82Rb PET hot-spot (3.85 [3.39–4.30]) (secondary endpoint).

Tumor rubidium SUVmean of patients in study 2 drawn by PSMA guidance compared with SUVmean of entire prostate gland of healthy controls.
Association Between TBF and Characteristics of Tumor Aggressiveness
Study 1
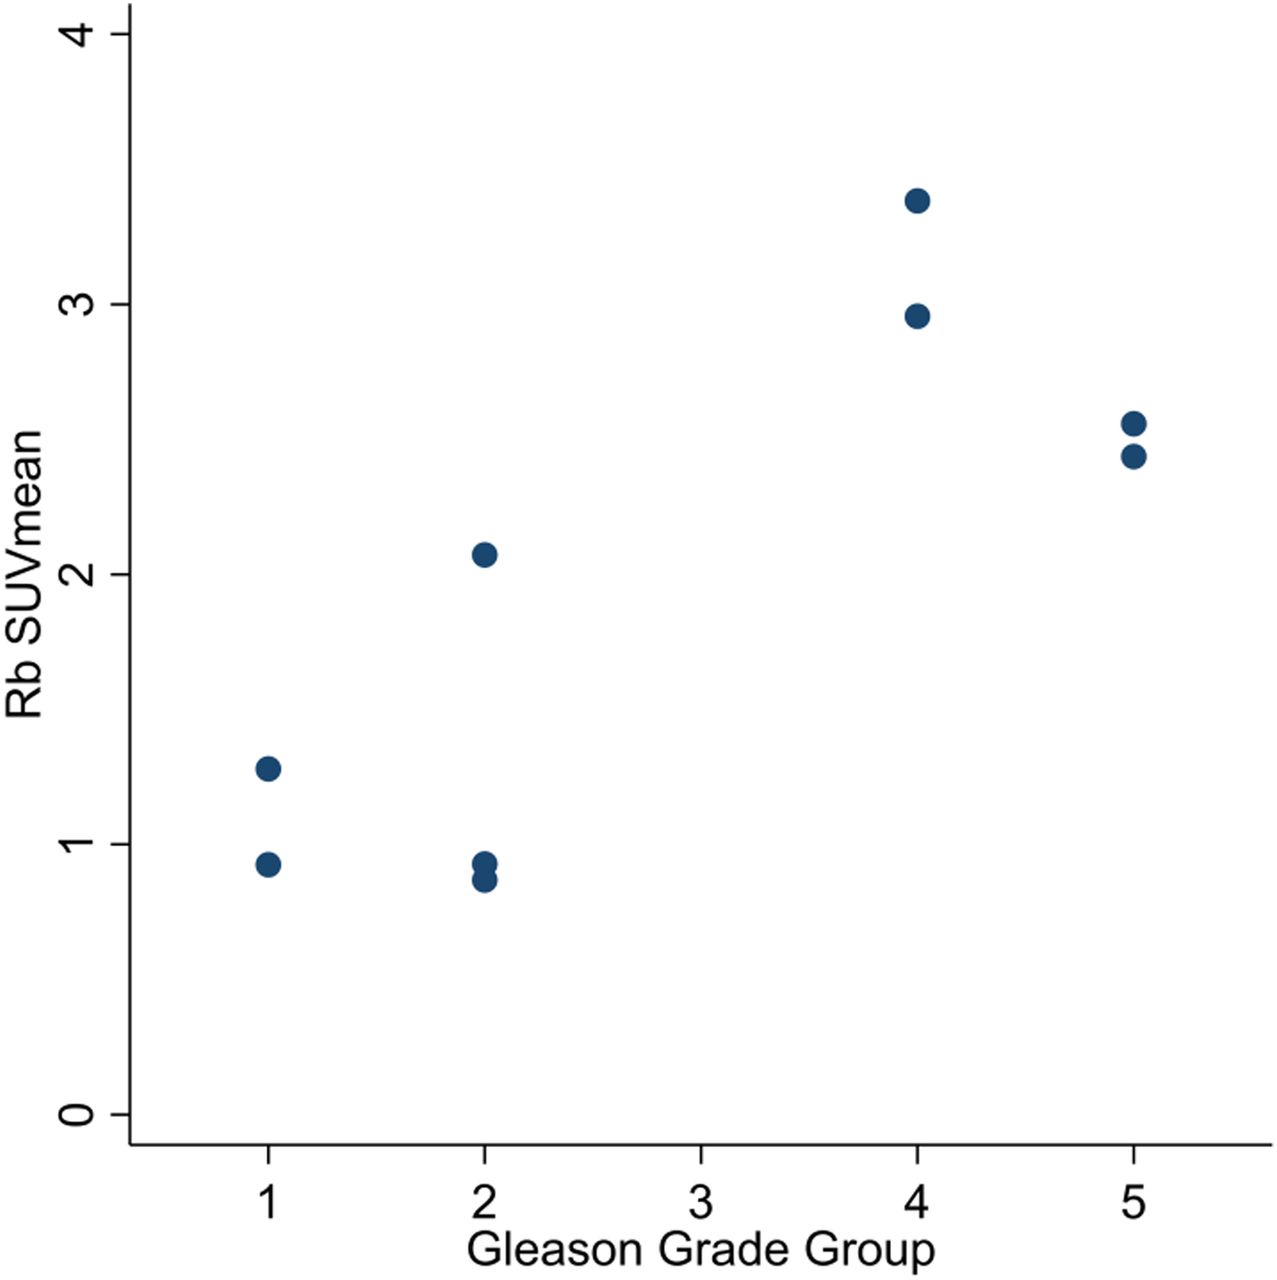
The TBF correlated with postprostatectomy GGG (ρ = 0.70, P = 0.03) (Fig. 6) and PSA (r = 0.88, P = 0.002). Additional patient characteristics are found in Table 1.

Rubidium SUVmean vs. postprostatectomy GGG (ρ = 0.70, P = 0.03).
Patient Characteristics from Study 1
Study 2
No significant correlation was found between 82Rb SUV and random biopsy GGG (ρ = 0.21, P = 0.46) or between 82Rb SUV and PSA (r = 0.28, P = 0.31). The patient characteristics are found in Table 2.
Patient Characteristics from Study 2
Blood Flow in PCa Metastases and in Normal Tissues
Two patients in study 2 (9 and 15) had bone metastases in the field of view; the SUVmean of these was 2.40, which was significantly higher than normal bone tissue (P = 0.005). One patient (patient 9) had a large lymph node metastasis in the field of view with an SUVmean of 2.61, which was markedly increased compared with soft tissue in general.
Normal-tissue reference values drawn from healthy controls for the bladder (0.57 [0.44–0.70]), seminal vesicles (1.07 [0.89–1.24]), and bone (1.12 [0.92–1.32]) are found in Table 3, along additional control characteristics.
Control Characteristics
Detection of Bilateral High-Risk PCa with 82Rb PET/CT
A 69-y-old man, recruited as a control subject in study 2, had no known prostate disease, no lower urinary tract symptoms, and normal PSA (3.1 ng/mL). The 82Rb PET/CT showed a left-side peripheral-zone focus with intense 82Rb uptake (Fig. 7A) and a small right-side peripheral-zone focus with increased 82Rb uptake (Fig. 7B). Because of the suspected prostate lesions on 82Rb PET/CT, the patient was referred for prostate MRI. The MRI revealed a correlating left-side 7 × 9 × 11 mm PI-RADS 4 peripheral zone lesion (Fig. 7C) with an apparent diffusion coefficient value of 580 × 10−6 mm2/s (Fig. 7D) and a right-side 7 × 7 × 7 mm PI-RADS 4 peripheral zone lesion (Fig. 7C) with an apparent diffusion coefficient value of 774 × 10−6 mm2/s (Fig. 7D). In-bore MRI-guided biopsies were taken (Figs. 7E and 7F), revealing Gleason 4 + 5 in 67% and 42% of the needle length from the left and right lesions, respectively.
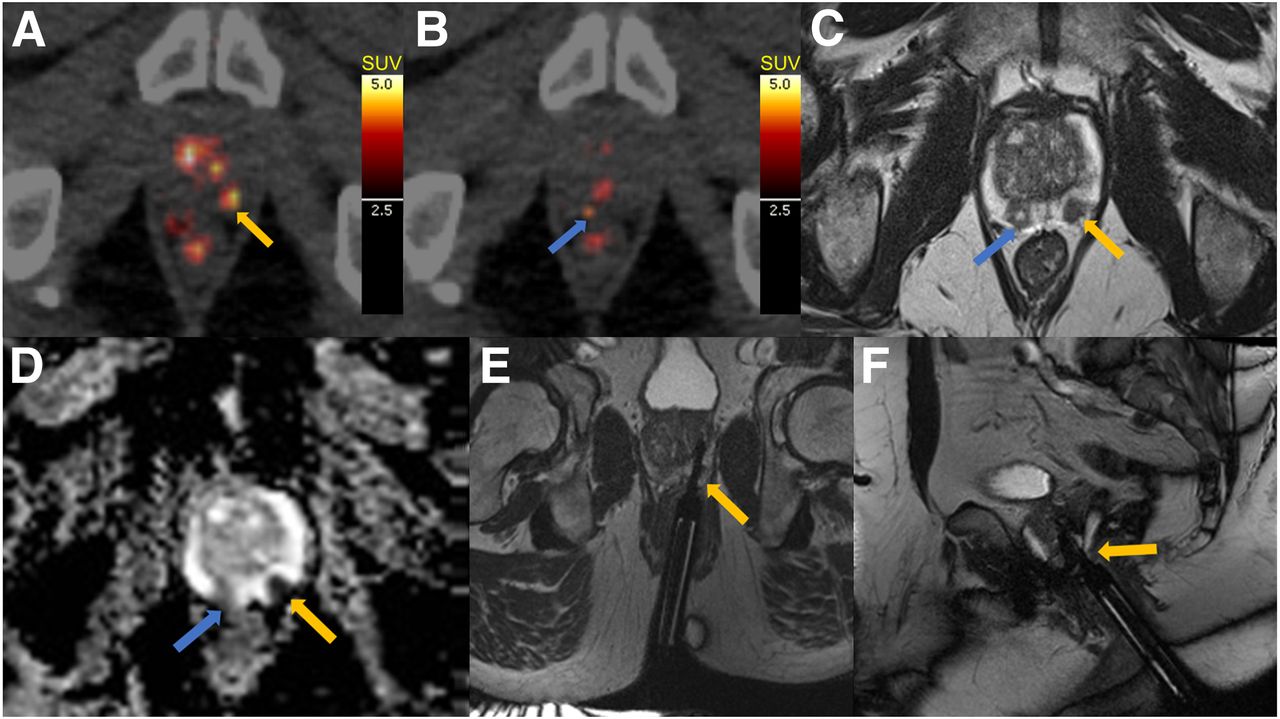
82Rb PET images (A and B) and MR images of control that turned out to have bilateral high-risk PCa. T2-weighted MRI (C), apparent diffusion coefficient map (D), and axial and sagittal MRI TRUFI (true fast imaging with steady-state free precession) sequence of left-side biopsy (E and F). Yellow arrows indicate left-side tumor, whereas blue arrows indicate right-side tumor.
Three controls were excluded: one because he had been referred for urologic examination for an elevated PSA level (exclusion criterion); one because he had bilateral metallic hip implants, causing massive scan artifacts; and, finally, the one described above, because he had high-risk PCa (exclusion criterion).
DISCUSSION
The main results of study 1 show that TBF estimated from 15O-H2O K1, 82Rb PET K1, and 82Rb PET SUV are highly correlated and that 82Rb SUV is associated with postprostatectomy GGG and, hence, cancer aggressiveness. Furthermore, study 2 showed that 82Rb uptake is higher in PCa than in normal prostate tissue.
Dynamic 82Rb PET/CT and 82Rb SUV Measure Prostate TBF Precisely
Blood flow is an underlying basis for tumor growth (12,13). Because perfusion is defined by a transcapillary flux of water, which can be measured and quantified by 15O-H2O PET/CT, this is considered the gold standard for noninvasive measurement of blood flow in humans. 15O-H2O PET perfusion is significantly higher in PCa than in normal prostate tissue or benign prostate hyperplasia (19). Absolute quantification of perfusion correlated well with PCa aggressiveness (15) and could, hence, be a valuable tool in risk evaluation and monitoring of PCa. However, 15O-H2O PET/CT remains a challenging imaging modality because of the requirement for an on-site cyclotron to produce the short-lived 15O tracer—a requirement that cannot be met in most clinical PET centers.
The present pilot study (study 1) validates 82Rb PET/CT as a diagnostic tool for quantitative measurement of TBF by demonstrating that TBF estimates from 15O-H2O PET and 82Rb PET K1 images were highly correlated. The correlation between 82Rb PET and 15O-H2O PET is not linear; the fit line flattens at high perfusion values, causing 82Rb PET to underestimate the high-perfusion areas. This observation was expected because the same relation between 82Rb PET and 15O-H2O PET is known from cardiac 82Rb PET imaging and caused by the incomplete 82Rb extraction (18).
A simple image analysis for retention tracers is the use of semiquantitative SUVs as a substitute for TBF. Because 82Rb PET K1 and 82Rb SUV were highly correlated in our study, this approach seems applicable, and it simplifies the image reconstruction and scan analysis. Because the tumor outline was known in all patients, SUVmean was selected instead of SUVmax to reduce noise bias.
Blood Flow Is Higher in PCa Than in Healthy Prostate Tissue
In study 2, TBF estimated by 82Rb PET SUV is significantly higher than the SUVmean of the presumed healthy prostate tissue of the controls, with no overlap between the groups. However, the tumor with the lowest TBF and the control with the highest mean prostate blood flow are not far from each other. This finding is explained by areas of transitional-zone benign hyperplasia in some of the healthy controls. These areas display high blood flow on 82Rb PET, whereas the healthy peripheral zone generally has homogeneous and low blood flow (Fig. 4B). Thus, the tumor-background contrast for peripheral-zone tumors is better than would seem from the statistics. This was also illustrated by the case of the control who was diagnosed with PCa on 82Rb PET (Fig. 7). On the other hand, transitional-zone tumors can be challenging to differentiate from benign hyperplasia nodules on 82Rb PET alone. However, with MRI guidance or PSMA PET/CT guidance, the tumor can be outlined. Hence, it is crucial to be familiar with prostate anatomy, including usual localization of PCa and hyperplasia for interpretation of prostate 82Rb PET.
Our finding that tumor 82Rb PET SUV is significantly higher than SUVmean of the prostate gland of healthy controls is consistent with previous SPECT studies with the radioisotope 201Tl, which was able to differentiate cancer from benign prostate hyperplasia (20,21). The uptake of 201Tl in tumor cells is mediated by the Na-K ATPase and the Na-K-2Cl cotransporter (22), and hence the biologic properties of 201Tl are similar to those of 82Rb.
Association Between TBF and Characteristics of Tumor Aggressiveness
In study 1, TBF measured by 82Rb PET correlated with postprostatectomy GGG. Postprostatectomy histopathologic evaluation with Gleason grading is the best estimate of aggressiveness and cancer growth. Because TBF illustrates the metabolic needs of the tumor, this correlation is explainable. However, there was no correlation between TBF measured by 82Rb PET and GGG from random prostate biopsies in study 2, as might be explained by the fact that random biopsy Gleason score often differs from postprostatectomy Gleason score and thus GGG (23). This might be an indication that 82Rb PET SUV is superior to random biopsies for preoperative risk assessment. However, this possibility needs to be evaluated further in large clinical studies.
The results of study 1 and study 2 differed regarding the correlation between TBF and PSA. An excellent correlation was found in study 1, and no correlation was found in study 2. Such a correlation might be rooted in the same logic as that which explained the correlation with GGG, namely that the amount of PSA produced in the tumor is related to the metabolism, as illustrated by the TBF. In study 2, the 2 patients with the highest PSA values (patients 9 and 15) both had multiple metastases and quite low blood flow in the primary prostate tumor. This characteristic might explain the lack of correlation between TBF and PSA in study 2 and demonstrate that blood flow in the primary prostate tumor alone does not correlate with PSA in metastatic PCa.
Future Perspectives
More studies are needed to determine the exact correlation between 82Rb PET and PCa aggressiveness characteristics and the predictive value of 82Rb PET regarding the long-term clinical course of the disease. Finally, further studies are needed to determine the characteristics and underlying biology of 82Rb uptake in PCa, including the indicated connection to restricted diffusion on mpMRI.
If the demonstrated correlation between quantitative 82Rb PET TBF and postprostatectomy GGG, and hence aggressiveness, is consistent in larger studies, this method may be a valuable addition to the existing risk evaluation algorithm. 82Rb PET can be merged with mpMRI and perhaps even performed in PET/MRI scanners at some departments. Even though we managed to detect and diagnose the first patient with PCa on 82Rb PET/CT, the method is not suited for initial detection of PCa but only for characterization of localized tumors. MRI is obviously a superior modality for detecting and assessing the tumor morphology and anatomy, but if quantitative measurement of TBF is further proven to be reliable for noninvasive assessment of aggressiveness, there could be powerful synergy between the modalities. It may be interesting to investigate whether this modality can be used to assess which patients are suited for active surveillance and to monitor those patients. It could also be interesting to investigate the TBF response to therapy and to evaluate whether the initial response is predictive of long-term treatment effect.
Because 82Rb uptake is associated with flow and aggressiveness in PCa, it may be relevant also to investigate the role of 82Rb uptake in other cancers.
CONCLUSION
Study 1 shows that 82Rb PET/CT is a diagnostic tool for quantitative TBF imaging by validation against the gold standard method, 15O-H2O PET/CT, and that TBF can be estimated by 82Rb PET/CT using simple SUV and suggests that 82Rb SUV is associated with postprostatectomy GGG and, hence, cancer aggressiveness. Study 2 shows that 82Rb uptake is higher in PCa than in normal prostate tissue, with no overlap between cohorts, confirming the clinical trial’s primary hypothesis. Consequently, 82Rb PET/CT may have potential as a noninvasive tool for evaluation of tumor aggressiveness and monitoring in nonmetastatic PCa.
DISCLOSURE
This work was financially supported by the Danish Cancer Society, the Health Research Fund of Central Denmark Region, and Aage og Johanne Louis-Hansens Fond. No other potential conflict of interest relevant to this article was reported.
Footnotes
Published online Jan. 25, 2019.
- © 2019 by the Society of Nuclear Medicine and Molecular Imaging.
REFERENCES
- Received for publication September 19, 2018.
- Accepted for publication December 19, 2018.


Jump to section
Related Articles
Cited By...
- No citing articles found.