


Abstract
Our purpose was to identify baseline imaging features in patients with liver cancer that correlate with 90Y distribution on postprocedural SPECT and predict tumor response to transarterial radioembolization (TARE). Methods: This retrospective study was approved by the institutional review board and included 38 patients with hepatocellular carcinoma (HCC) (n = 23; 18/23 men; mean age, 62.39 ± 8.62 y; 34 dominant tumors) and non-HCC hepatic malignancies (n = 15; 9/15 men; mean age, 61.13 ± 11.51 y; 24 dominant tumors) who underwent 40 resin-based TARE treatments (August 2012 to January 2018). Multiphasic contrast-enhanced MRI or CT was obtained before and Bremsstrahlung SPECT within 2 h after TARE. Total tumor volume (cm3) and enhancing tumor volume (ETV [cm3] and % of total tumor volume), and total and enhancing tumor burden (%), were volumetrically assessed on baseline imaging. Up to 2 dominant tumors per treated lobe were analyzed. After multimodal image registration of baseline imaging and SPECT/CT, 90Y distribution was quantified on SPECT as tumor–to–normal-liver ratio (TNR). Response was assessed according to RECIST1.1 and quantitative European Association for the Study of the Liver criteria. Clinical parameters were also assessed. Statistical tests included Mann–Whitney U, Pearson correlation, and linear regression. Results: In HCC patients, high baseline ETV% significantly correlated with high TNR on SPECT, demonstrating greater 90Y uptake in the tumor relative to the liver parenchyma (P < 0.001). In non-HCC patients, a correlation between ETV% and TNR was observed as well (P = 0.039). Follow-up imaging for response assessments within 1–4 mo after TARE was available for 23 patients with 25 treatments. The change of ETV% significantly correlated with TNR in HCC (P = 0.039) but not in non-HCC patients (P = 0.886). Additionally, Child–Pugh class B patients demonstrated significantly more 90Y deposition in nontumorous liver than Child–Pugh A patients (P = 0.021). Conclusion: This study identified ETV% as a quantifiable imaging biomarker on preprocedural MRI and CT to predict 90Y distribution on postprocedural SPECT in HCC and non-HCC. However, the relationship between the preferential uptake of 90Y to the tumor and tumor response after radioembolization could be validated only for HCC.
Hepatocellular carcinoma (HCC) is the sixth most common cancer and the third most common cause of cancer-related deaths worldwide (1). Moreover, liver is the primary metastatic site for many malignancies, especially of gastrointestinal origin such as colorectal carcinoma or neuroendocrine tumors (2). Over 70% of newly diagnosed patients with primary or secondary liver cancer present with advanced disease stages and are no longer amenable for curative therapeutic approaches (3,4). In this setting, intraarterial therapies such as transarterial chemoembolization (TACE) and radioembolization (TARE) with 90Y constitute mainstay palliative treatment options (5).
In TARE, microspheres loaded with radioactive 90Y are injected into the hepatic artery to deliver therapeutic doses of radiation to the liver lobe that contains the target tumors. The particles are trapped and remain in the tumor capillary bed, where they decay with β−-emissions (6). Radiation is the predominant therapeutic effect of TARE, whereas the embolic properties of the 20- to 60-μm microspheres remain limited and depend on the total number of administered microspheres. In fact, angiographic stasis before complete dose delivery occurs in only about 20% of treatments (7,8).
Previous studies have shown that 90Y uptake of the target tumors corresponds with tumor response to treatment (9). A clinically used tool to predict 90Y biodistribution before TARE is the preparatory 99mTc-macroaggregated albumin (99mTc-MAA) scan. However, the prognostic value of 99mTc-MAA for 90Y deposition patterns is limited mainly by different particle sizes and hemodynamics, which restricts the relevance of the 99mTc-MAA scan to the identification of hepatopulmonary shunting (10).
For post-TARE evaluation of 90Y distribution in clinical practice, deposits are visualized on Bremsstrahlung SPECT immediately after treatment to qualitatively assess 90Y distribution to the tumor and liver tissue as well as nontarget deposition and shunting to other organs. More recently, quantitative methods for SPECT analysis have been investigated for the measurement of 90Y distribution and calculation of absorbed doses and proved technically feasible in an experimental setting (11). However, as 90Y uptake of tumors and dose–response relationships are highly variable across tumors of different etiology and morphology, the use of quantitative 90Y-SPECT for the prediction of tumor response to TARE remains challenging.
Therefore, this study aimed to identify and establish baseline imaging features in patients with liver malignancies that predict 90Y distribution as seen on post-TARE Bremsstrahlung SPECT and to assess the prognostic value of 90Y distribution for early prediction of tumor response.
MATERIALS AND METHODS
Study Cohort
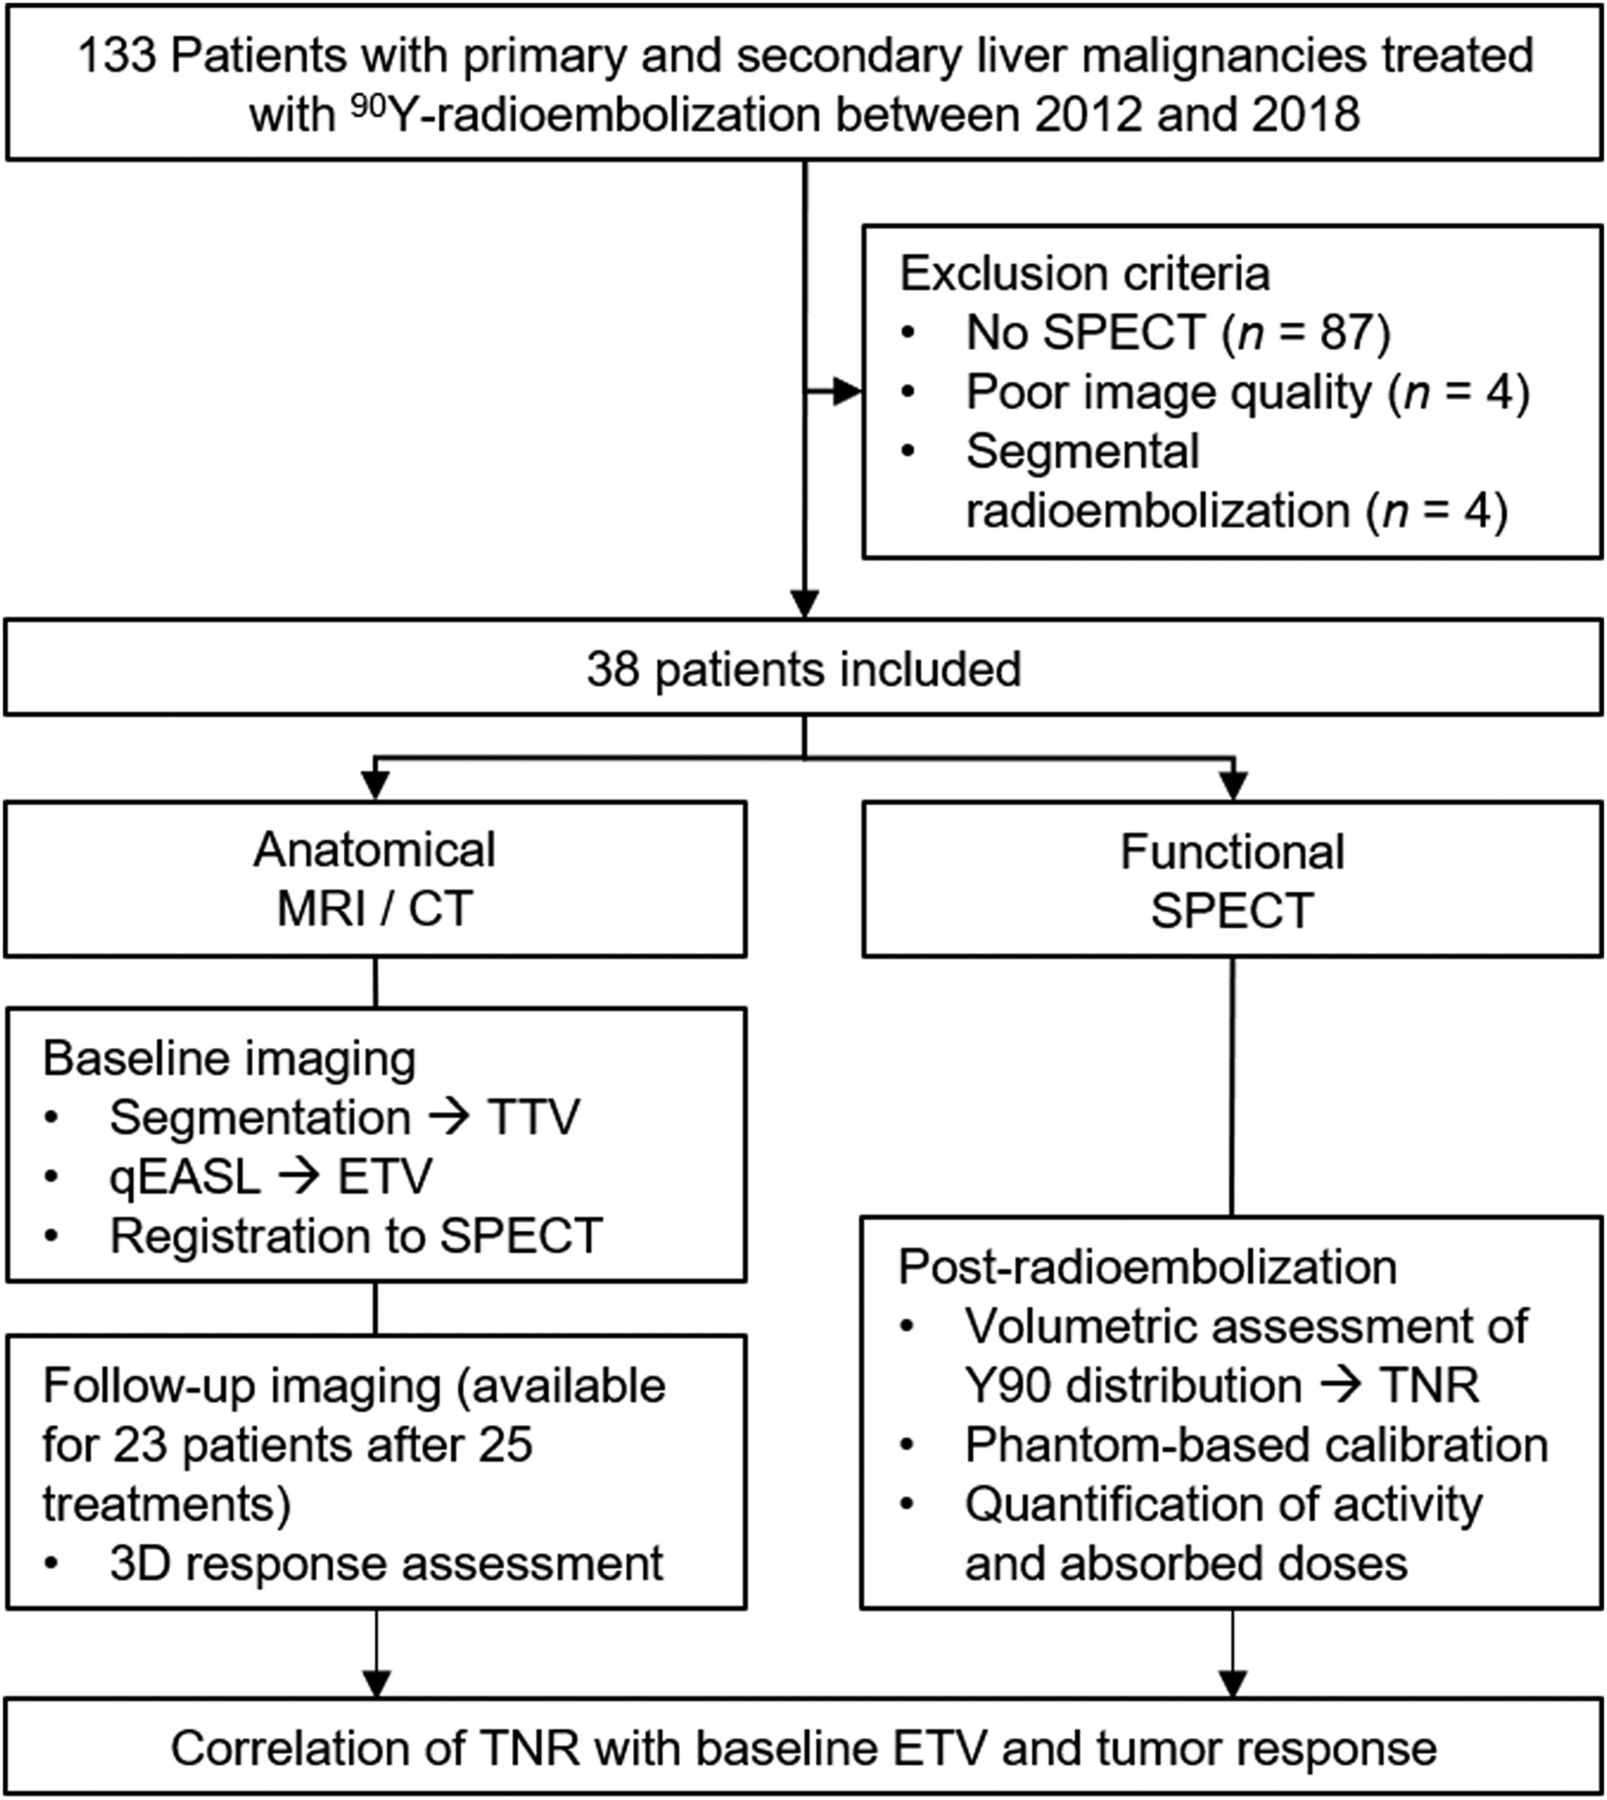
This Health Insurance Portability and Accountability Act–compliant, retrospective single-center study was approved by the institutional review board, and informed consent was waived. In total, 38 patients with 23 HCC and 15 non-HCC liver malignancies who received lobar resin-based 90Y-TARE between August 2012 and January 2018 were included. The relatively high dropout rate due to missing SPECT was related to reimbursement system regulations that stipulated planar scans instead of SPECT. Forty treated liver lobes with 58 dominant tumors were included in the final analysis. With respect to partial-volume effect and limited spatial resolution of SPECT imaging, tumors smaller than 1.5 cm in diameter were excluded from the analysis (Fig. 1) (12). Clinical parameters were also assessed.

Study workflow and exclusion criteria.
MRI and CT Imaging
All patients received either MRI or CT of the liver before (baseline) and after 25 treatments 1–4 mo after the TARE procedure (follow-up). Scans were acquired according to the respective standardized institutional protocols. Specifically, patients underwent contrast-enhanced multiphasic T1-weighted MRI with a 1.5-T scanner (Magnetom Avanto; Siemens) using a phased-array torso coil. The protocol included breath-hold unenhanced and contrast-enhanced (intravenous macrocyclic gadolinium) imaging in the hepatic arterial (20 s after administration), portal venous (70 s), and delayed phase (3 min). The multiphasic contrast-enhanced CT was performed with a multidetector scanner (Siemens) including native, arterial, portal venous, and delayed contrast-enhanced phases.
TARE
Within 2 wk before TARE, all patients underwent mesenteric angiography to identify the vascular supply of the tumor and a 99mTc-MAA scan to calculate the lung shunt fraction (LSF) and subsequent dose reduction.
For the actual treatment, a catheter was placed via transfemoral access under fluoroscopy guidance. Thereafter, a microcatheter was advanced into a proximal hepatic artery branch for lobar administration of 90Y resin-microspheres (SIR-Spheres; SIRTeX Medical Limited). For bilobar therapy, the interval between sequential treatments was 3–4 wk.
SPECT/CT
Within 2 h after completion of TARE, Bremsstrahlung SPECT/CT was performed. The dual-head scanner (Symbia TruePoint; Siemens) was equipped with a low-energy high-resolution collimator. Acquisition settings included 32 frames per camera and a 20-s acquisition time per frame. Matrix size was 128 × 128, and energy windows were 55–100 and 105–195 keV. The low-dose CT was acquired with 130 kV, 30 mAs, 0.8-s rotation time, and 512 × 512 matrix. Maximum-likelihood reconstruction based on 3-dimensional (3D) ordered-subsets expectation maximization was performed using a manufacturer-specific software (FLASH 3D).
3D Tumor Assessment on MRI and CT
Up to 2 dominant target tumors per treated lobe were determined by size and segmented in 3 dimensions on the arterial-phase T1-weighted MRI or CT scans at baseline and follow-up using a semiautomated, volumetric technique to measure the total tumor volume (TTV, cm3). Quantitative European Association for the Study of the Liver (IntelliSpace Portal; Philips Healthcare), a software-based 3D quantification tool, was used to calculate the absolute enhancing tumor volume (ETV, cm3) and the ETV in percentage of the TTV (ETV%). Briefly, the precontrast scan was subtracted from the arterial-phase scan to remove background enhancement. The 3D segmented tumor mask was applied, and a reference region was placed in healthy liver parenchyma. Tumor enhancement was defined as 2 SDs above the signal intensity of the reference region as previously described (13). In addition, the treated liver lobes were segmented, and the total and enhancing tumor burden per treated lobe were assessed (14). These parameters are referred to here as imaging biomarkers for 90Y distribution.
For volumetric tumor response assessment, changes of TTV, ETV, and ETV% between baseline and follow-up imaging were calculated and interpreted according to the established qEASL% criteria (13,14). Additionally, tumor response was assessed according to RECIST1.1. Response was categorized as complete or partial response or as stable or progressive disease.
90Y Biodistribution
90Y SPECT images were analyzed with a dedicated protocol in MIM Encore (MIM Software Inc.). Treated lobes and dominant tumors were volumetrically segmented on the baseline contrast-enhanced MRI or CT, which was nonrigidly registered to the CT of the SPECT/CT and then to the scatter- and attenuation-corrected SPECT. All remaining tumors in the treated lobe were also segmented, and the volumes were subtracted from the liver lobe volume to separate the healthy liver parenchyma from tumorous tissue. On the basis of these segmentations, the total number of counts in the dominant tumors and the nontumorous parenchyma of the treated lobe were quantified. 90Y activity per count was calculated on the basis of the administered dose, the LSF, and the total number of counts within the liver. Finally, the tumor–to–normal-liver ratio (TNR) was calculated, representing the distribution of 90Y between the dominant tumors and nontumorous liver in the treated lobe.
To convert the count-rate on the SPECT image to a measure of activity concentration, a phantom-based calibration correction factor was calculated of 4 phantom studies as previously described (11). Briefly, activity concentrations measured on SPECT were divided by the true activity concentrations measured at the time of the scan using an activity meter to obtain the calibration correction factor (Supplemental Fig. 1; supplemental materials are available at http://jnm.snmjournals.org). The 4 results were averaged and multiplied by the counts within the volume of interest. Eventually, absorbed doses were calculated using partition modeling (15).
Statistical Analysis
Descriptive results are reported as frequency (n, %), mean ± SD, or median and range. Further analyses included Pearson correlation, linear regression, Mann–Whitney U test, and Kaplan–Meier curves. Statistical analyses were performed using SPSS (IBM Corp., version 24.0) and Prism (version 7.0). A P value of less than 0.05 was considered statistically significant.
RESULTS
Study Population and Survival Analysis
Detailed characteristics of the patient population are displayed in Tables 1 and 2. Patients with HCC and non-HCC had a median survival of 14.4 (1.58–55.76) and 18.97 (1.48–55.07) months after TARE, respectively. Five patients with HCC and 10 patients with non-HCC were still alive at the end of follow-up and censored for Kaplan–Meier analysis.
Baseline HCC Patient Characteristics
Baseline Non-HCC Patient Characteristics
Imaging Findings
Baseline Imaging Features
The tumor characteristics on baseline MRI or CT are displayed in Tables 1 and 2. The dominant tumors measured 5.24 ± 2.93 cm and 4.68 ± 2.48 cm (P = 0.445) for HCC and non-HCC, respectively.
Response Assessment
Follow-up imaging was acquired within a median time of 68 (30–111) and 78 (28–143) days for HCC and non-HCC, respectively, and was available after 25 treatments. According to 3D enhancement-based qEASL%, which was further used for correlation analyses with TNR, TARE achieved no complete responses, 0 and 2 (28.57%) partial responses, 17 (94.44%) and 5 (71.43%) stable disease, and 1 (5.56%) and 0 progressive disease in HCC and non-HCC, respectively. According to RECIST1.1, there was no complete response, 2 (11.11%) and 3 (42.86%) partial responses, 15 (83.33%) and 4 (57.14%) stable disease, and 1 (5.56%) and 0 progressive disease in HCC and non-HCC, respectively.
90Y Distribution on SPECT/CT and Absorbed Dose Calculations
Patients had a mean 99mTc-MAA LSF of 6.6% ± 4.7%. The mean administered activity was 1.17 ± 0.61 GBq, and the mean absorbed tumor and healthy liver dose were 52.52 ± 31.8 and 39.94 ± 22.4 Gy, respectively. The mean 90Y distribution to the dominant tumors quantified as TNR was 1.47 ± 0.42 in HCC and 1.52 ± 0.65 in non-HCC.
Correlation Analyses
Correlation of Baseline Imaging Features with 90Y Distribution and Survival
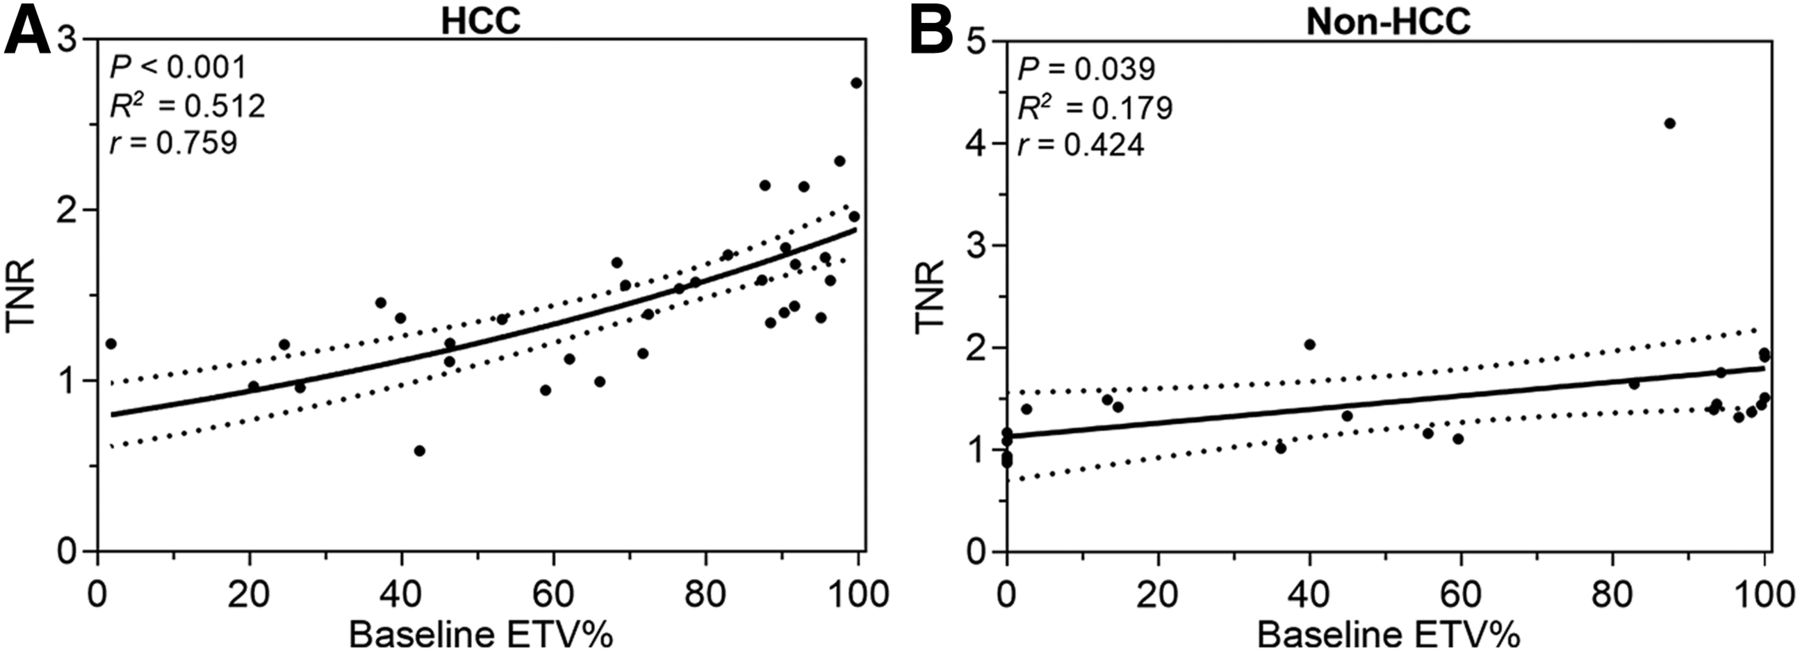
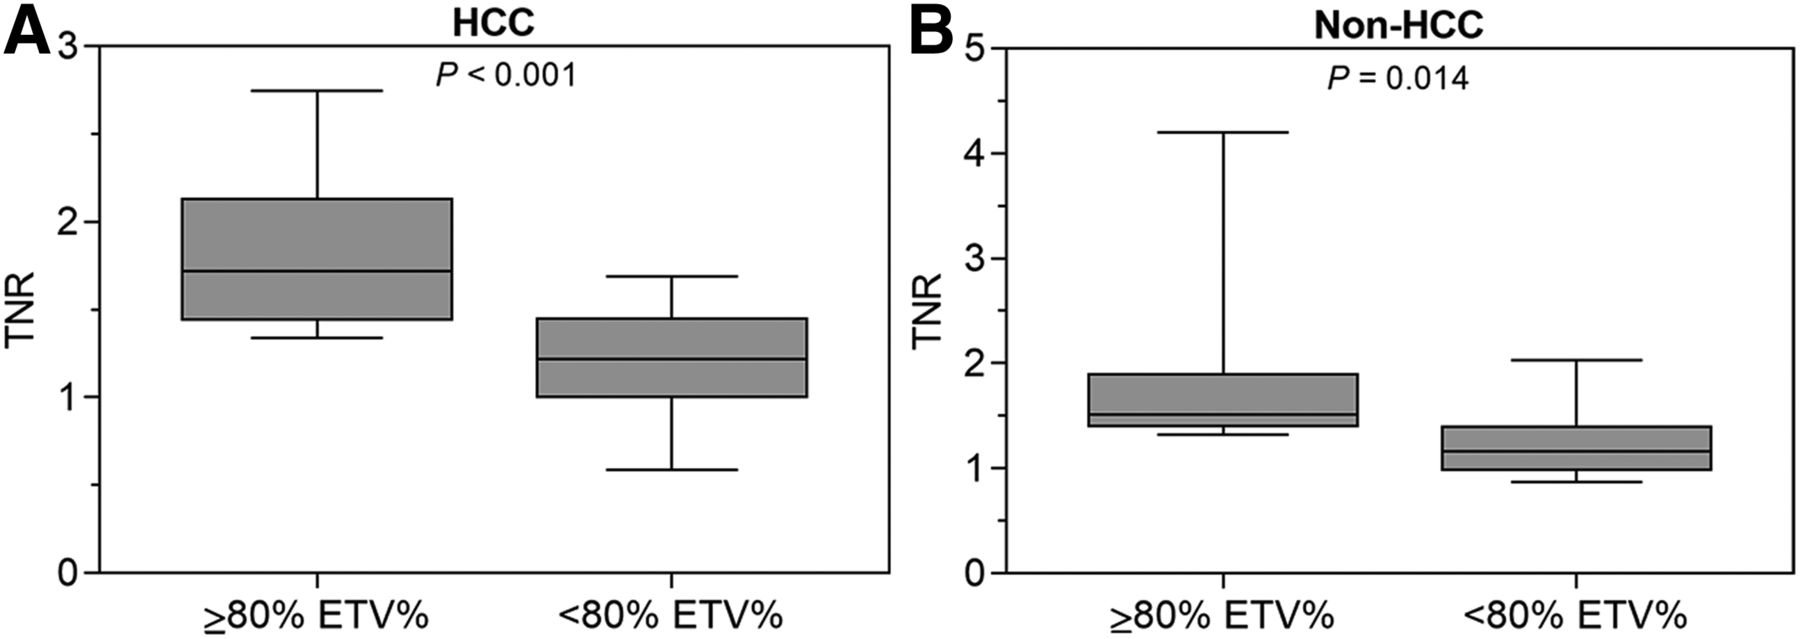
The 2-tailed Pearson analysis revealed a significant correlation between baseline ETV% and 90Y distribution on SPECT quantified as TNR, showing that more relative enhancement was associated with higher TNR in patients with HCC (P < 0.001). The correlation coefficient (r) was 0.759 and R2 was 0.516 in a linear regression model. In patients with liver cancer other than HCC, the correlation of baseline ETV% with TNR was not as strong as in HCC but still statistically significant (P = 0.039; r = 0.424; R2 = 0.179) (Fig. 2). Specifically, a baseline ETV% cutoff of 80% was empirically identified to provide the most significant separation of TNR values in HCC (P < 0.001) and non-HCC patients (P = 0.014), demonstrating higher mean TNR for patients with ETV% of at least 80% (Fig. 3). As for the remaining baseline tumor characteristics, TTV (P = 0.109 and 0.982), ETV (P = 0.43 and 0.686), diameter (P = 0.488 and 0.845), tumor burden (P = 0.498 and 0.125), and enhancing tumor burden (P = 0.852 and 0.768) did not demonstrate significant correlations with TNR. Of note, survival did not correlate with baseline ETV% in HCC (P = 0.088) and non-HCC (P = 0.172).

Correlation of baseline ETV% and 90Y distribution after TARE. This graph demonstrates that with greater ETV% on baseline imaging, 90Y uptake of tumor measured as TNR increases in HCC (n = 34, P < 0.001) (A) as well as non-HCC (n = 24, P = 0.039) (B). Intermittent lines indicate 95% confidence interval.

Stratification of 90Y distribution according to tumor enhancement thresholds. Mann–Whitney-U test reveals 80% baseline ETV% as empirically most significant cutoff value to stratify patients with HCC (P < 0.001) (A) and non-HCC (P = 0.014) (B) according to TNR. Graph shows median, range, and 25th–75th percentiles.
Correlation of Baseline Clinical Features with 90Y Distribution
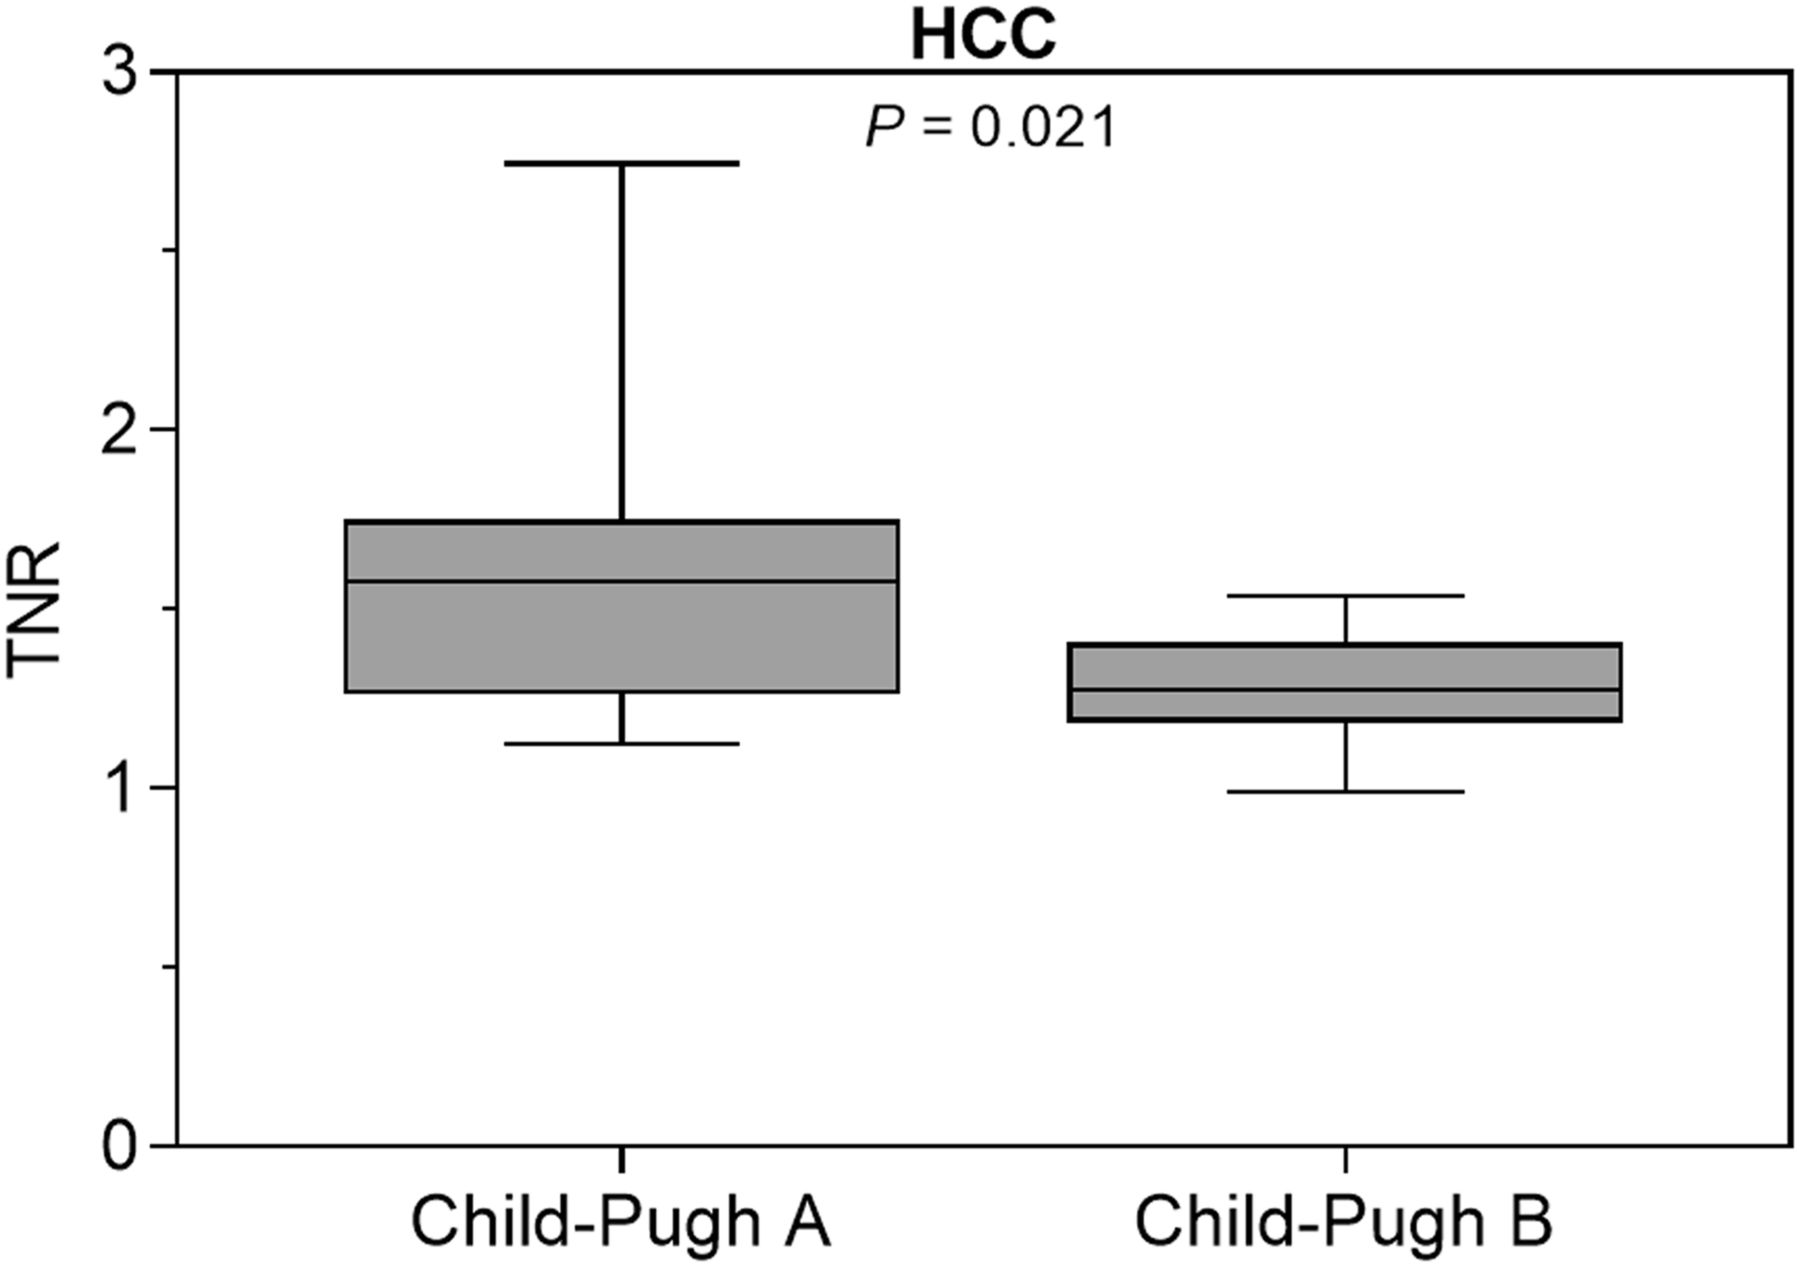
To assess the effect of liver cirrhosis on the 90Y distribution, Child–Pugh classes were correlated with TNR. In the present cohort, the mean TNR of Child–Pugh B patients was significantly lower than that of Child–Pugh A patients (P = 0.021) (Fig. 4). Furthermore, patients with Child–Pugh B had a significantly higher LSF than Child–Pugh A (P = 0.049).

Stratification of 90Y distribution according to Child–Pugh class. HCC patients with Child–Pugh B show significantly decreased TNR compared with Child–Pugh A (P = 0.021). Graph shows median, range, and 25th–75th percentiles.
Correlation of 90Y Distribution with Tumor Response
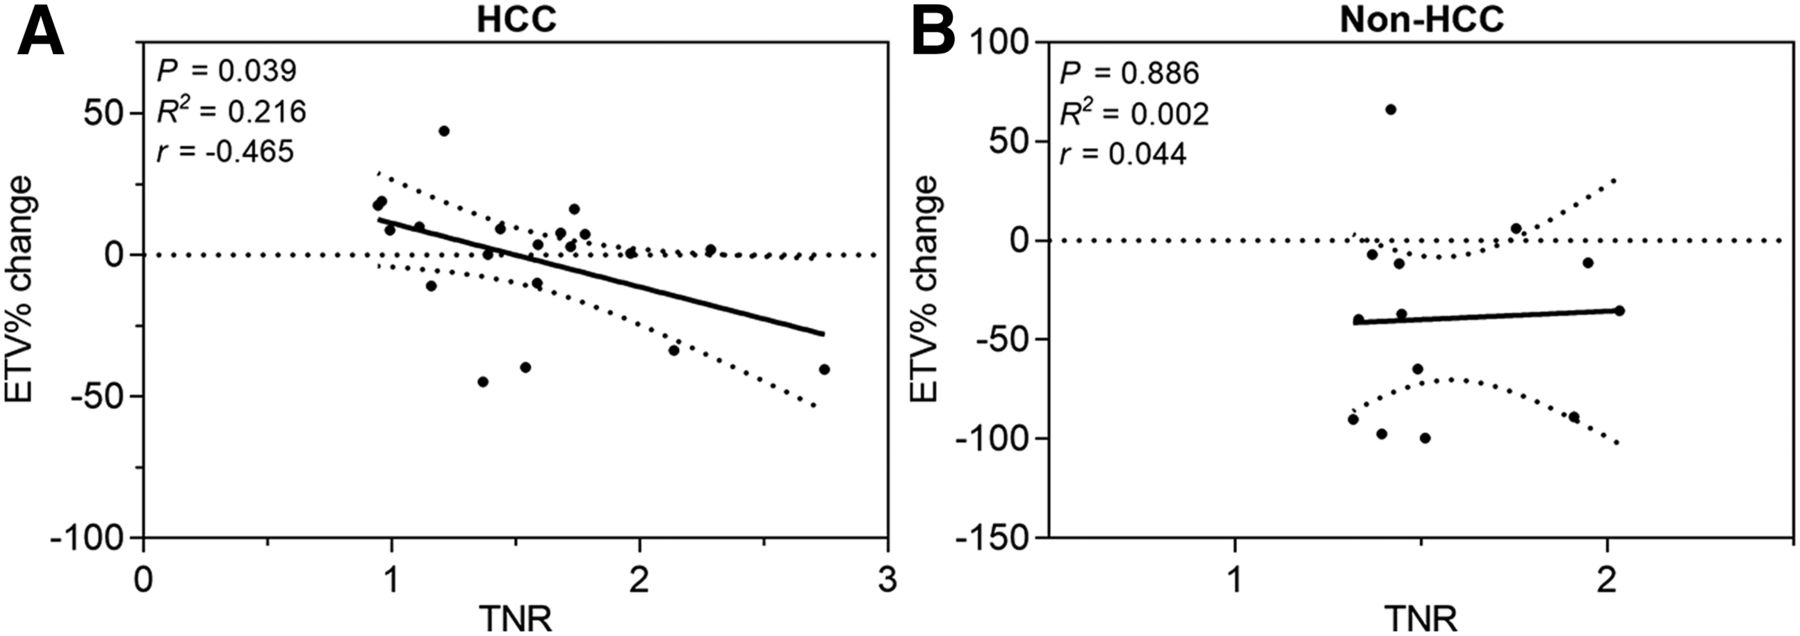
Furthermore, 90Y distribution was correlated with tumor response available in a subset of patients (n = 25). For HCC, a high TNR correlated with tumor response according to the enhancement-based volumetric qEASL% criteria (P = 0.038, R2 = 0.216, r = −0.465) (Fig. 5). However, in non-HCC, no correlation was observed between TNR and tumor response according to qEASL% (P = 0.886, R2 = 0.002, r = 0.044) (Fig. 6).

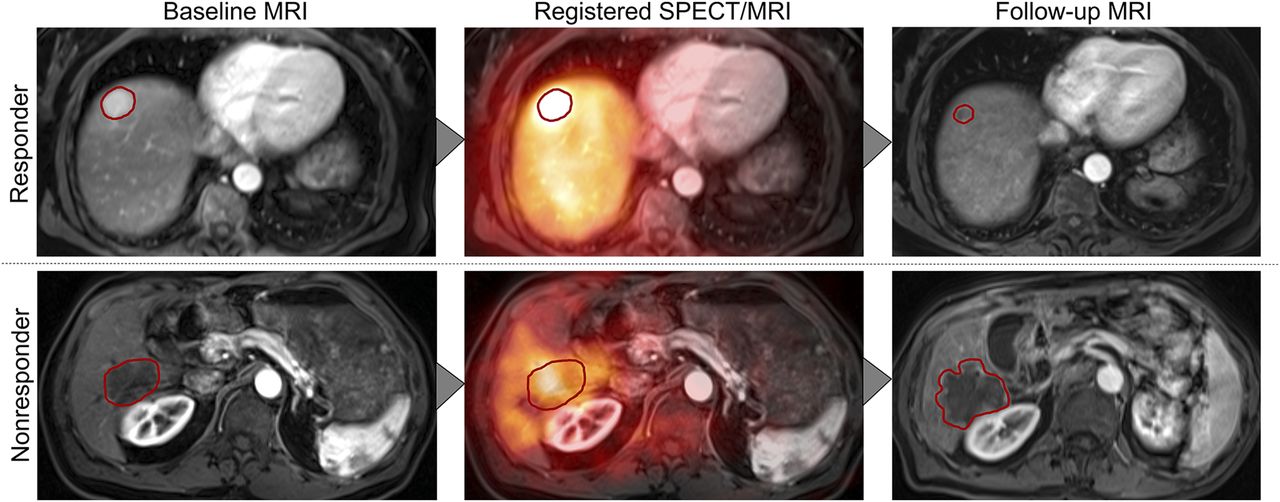
Multimodal image analysis. Postprocessing and analyses included volumetric segmentations of dominant tumors on baseline and follow-up MRI, registration of baseline MRI on postprocedural SPECT, and tumor response assessment.

Correlation of 90Y distribution and changes of tumor enhancement after TARE. This graph demonstrates that 90Y uptake in dominant tumors correlates with reduction of ETV% according to qEASL tumor response criteria (available for 25 lobar treatments) in HCC (n = 20) (A) but not in non-HCC (n = 13) (B). Intermittent lines indicate 95% confidence interval.
There was no correlation between TNR and survival in HCC (P = 0.526) or non-HCC patients (P = 0.233).
DISCUSSION
The main finding of this study is the identification of ETV% as a quantifiable imaging biomarker on preprocedural MRI and CT, which predicts 90Y distribution as measured on immediate postprocedural SPECT. Second, this study validated the relationship between the preferential uptake of 90Y activity to the tumor and tumor response after TARE in patients with HCC.
Recently, TARE was called into question when published results from prospective clinical trials comparing TARE with sorafenib as the standard of care in advanced HCC revealed no difference in survival between both treatments (16,17). However, patient selection for TARE in those studies was based mainly on general clinical evaluations rather than individual tumor characteristics. This reflects the currently immature patient selection process in clinical practice, where TARE is oftentimes performed when patients are considered ineligible or not responding to other locoregional therapies such as TACE, which underscores the need for personalized and tumor-specific treatment indications. In this study, the ETV%, reflecting on pathologic tumor viability and vascularity, was identified as a noninvasive imaging biomarker and predictor for 90Y distribution to the tumor after TARE (P < 0.001). Thus, the results of this study may help refine patient selection criteria for TARE, consolidating the role of TARE among other intraarterial therapies and improving treatment outcome with minimized toxicity by determining the patients who are most likely to benefit from TARE (18).
Previous studies have shown the feasibility and value of quantitative SPECT for the evaluation of the extra- and intrahepatic distribution of 90Y and absorbed dose quantifications after TARE (19). More recently, several studies investigating hepatic metastases found CT perfusion imaging and metabolic response assessment using PET predictive of tumor response early after TARE (20). This study introduces TNR as a quantitative surrogate on SPECT as a readily applicable predictor for enhancement-based tumor response after TARE in HCC (P = 0.038). As morphologic changes of the tumors occur gradually and become measurable on anatomic imaging as late as 2–4 mo after TARE, TNR may thus allow for the evaluation of treatment efficacy immediately after treatment (21,22). Such immediate feedback can support timely clinical decision making in rapidly evolving disease processes of liver cancer in a palliative setting.
In addition to ETV% at baseline, the findings of this study suggest that liver cirrhosis represents an additional influencing factor on intrahepatic 90Y distribution. Liver cirrhosis not only is associated with worsened liver function but also causes fundamental structural changes to the parenchyma, with portal hypertension, arterioportal, and hepatovenous shunting being frequently encountered features (23). Such conditions may possibly explain why patients with Child–Pugh B demonstrated increased rates of nontarget 90Y delivery (P = 0.021) and higher LSF (P = 0.049), while, in parallel, demonstrating decreased uptake in tumors, when compared with Child–Pugh A. The reduced dose delivered to the tumor necessarily results in lower response rates while simultaneously increasing the risk of radiation-induced injury to nontumorous parenchyma (24,25).
The goal of high and tumor-specific dose delivery provided the rationale for the development of new therapeutic strategies with TARE (6). Among others, the concept of radiation segmentectomy was introduced, which represents a possibly curative approach applying high radiation doses to singular tumors restricted to a single or a few segments (26). Another approach, called boosted selective internal radiation therapy, targets patients with large HCC with or without portal vein thrombosis for personalized treatment intensification that entails increased amounts of administered 90Y activities (27). Patients were selected on the basis of their 99mTc-MAA scan, quantifications of doses to the tumor and liver, and total injected dose. Boosted selective internal radiation therapy was found to achieve significantly higher tumor doses resulting in improved response rates without compromising patient safety. Although conducted with glass spheres containing higher activity per microsphere, this approach proves the potential and underscores the need for surrogate markers predicting 90Y distribution to achieve better outcomes after TARE.
Hepatic metastases usually show different contrast uptake and washout behavior than HCC (28,29). As the vascular density in metastatic tumors such as colorectal cancer metastases is usually lower than for HCC, metastases may lack contrast enhancement on baseline imaging and distinct alterations of contrast uptake dynamics throughout the course of TARE (22,28). In the present cohort, a high baseline ETV% was predictive of 90Y distribution to the tumor (P = 0.039), but 90Y distribution did not correlate with tumor response (P = 0.886). Thus, ETV% as an imaging biomarker for tumor-specific 90Y uptake and the dependent tumor response may be applied only for HCC.
This study had several limitations. This is a retrospective study with a relatively small sample size and relatively wide range of imaging intervals. Additionally, tumors of different entities were included in the non-HCC cohort, with potentially varying physiology and enhancement patterns that may affect the 90Y uptake behavior and response to TARE.
Finally, as compared with SPECT, PET may generally provide more advanced quantification techniques and superior spatial resolution (30). However, SPECT is currently still more widely available, with higher cost efficiency than PET, which provided the rationale to develop a quantitative SPECT approach in this study (31).
CONCLUSION
This study showed the feasibility and prognostic value of ETV% as a quantifiable imaging biomarker on preprocedural MRI and CT, which predicts the relative 90Y distribution on postprocedural SPECT in HCC and non-HCC. However, the relationship between the preferential uptake of 90Y to the tumor and tumor response after TARE could be validated only for HCC. Overall, this study introduces an easily clinically applicable surrogate marker to refine and personalize patient selection for TARE.
DISCLOSURE
Outside the submitted work, Lynn Savic reports grants from a Leopoldina Postdoctoral Fellowship and the Society of Interventional Oncology (SIO); Julius Chapiro reports grants from the German–Israeli Foundation for Scientific Research and Development, Philips Healthcare, Boston Scientific, Guerbet, and SIO; MingDe Lin is a Visage Imaging employee; Lynn Savic, Julius Chapiro, and MingDe Lin report grants from the National Institutes of Health (NIH/NCI R01 CA206180); Isabel Schobert reports grants from the Biomedical Education Program (BMEP). No other potential conflict of interest relevant to this article was reported.
Acknowledgments
We thank Chi Liu, Brian Letzen, Sophie Antonia Stark, Paula Marie Oestmann, Clinton Wang, Adam Nelson, Neil Whiteside, Matt Gregory, Brian Patchell, Yanhong Deng, and Geliang Gan for their support and technical and statistical advice.
Footnotes
Published online Jan. 17, 2019.
- © 2019 by the Society of Nuclear Medicine and Molecular Imaging.
REFERENCES
- Received for publication September 5, 2018.
- Accepted for publication December 19, 2018.


Jump to section
Related Articles
Cited By...
- No citing articles found.