


Article Figures & Data
Figures
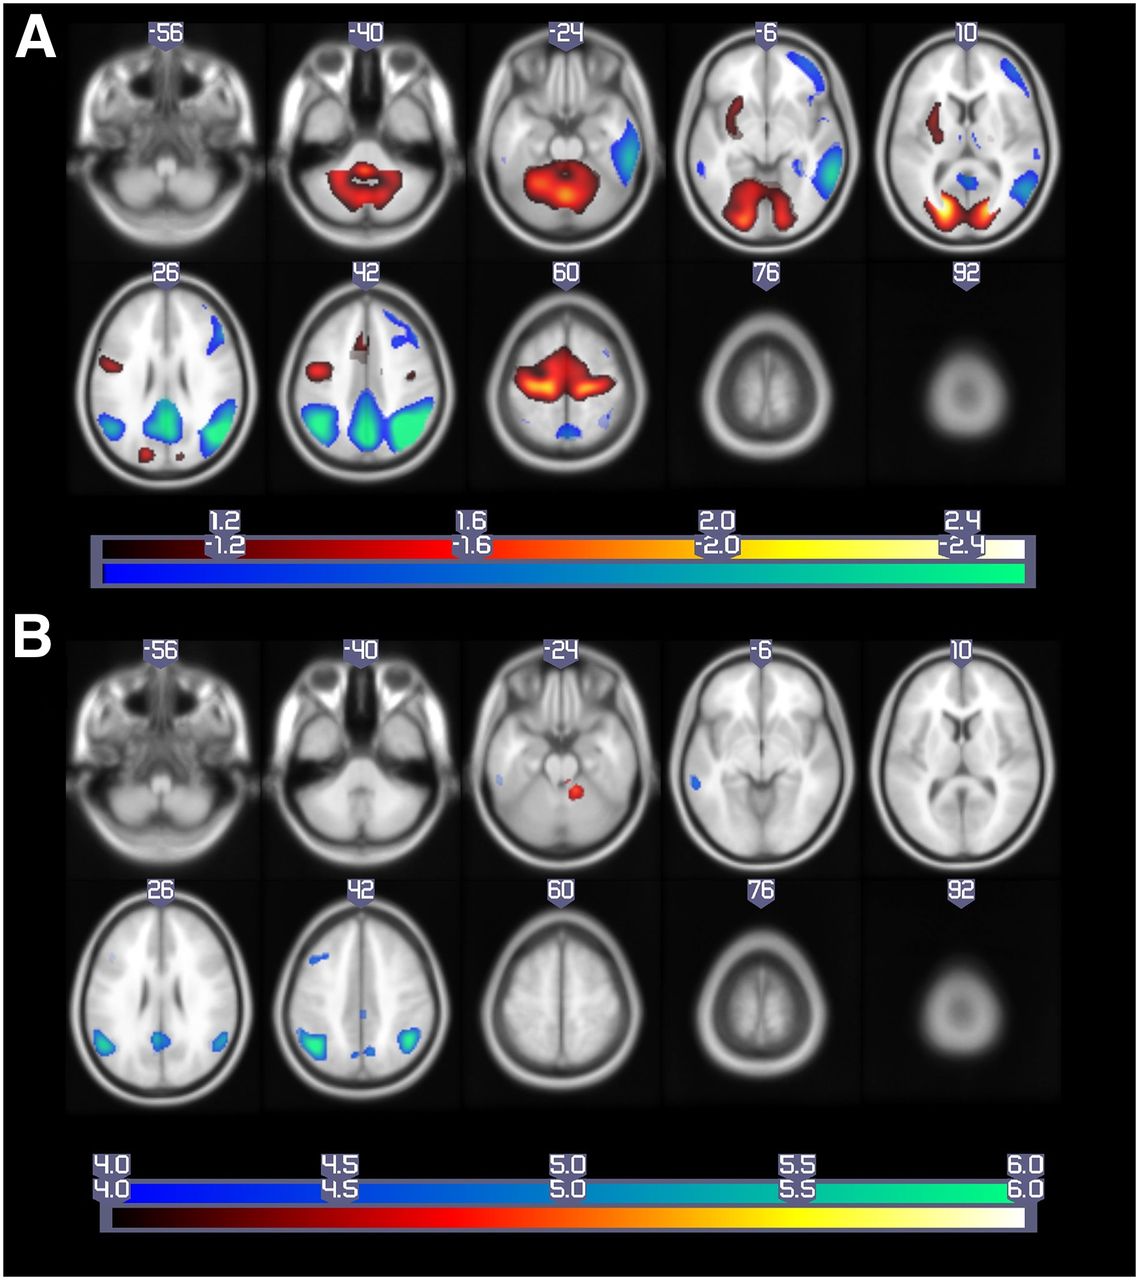
- FIGURE 1.
Patterns of regional brain metabolism. (A) ADCRP derived by PCA (P < 0.05) and (B) significant regions derived by SPM t test (familywise error–corrected P < 0.05), overlaid on MRI template image. Voxels with negative region weights and hypometabolism are shown in “cool” colors, and regions with positive region weights and hypermetabolism are depicted in “hot” colors. Data are presented in neurologic orientation.
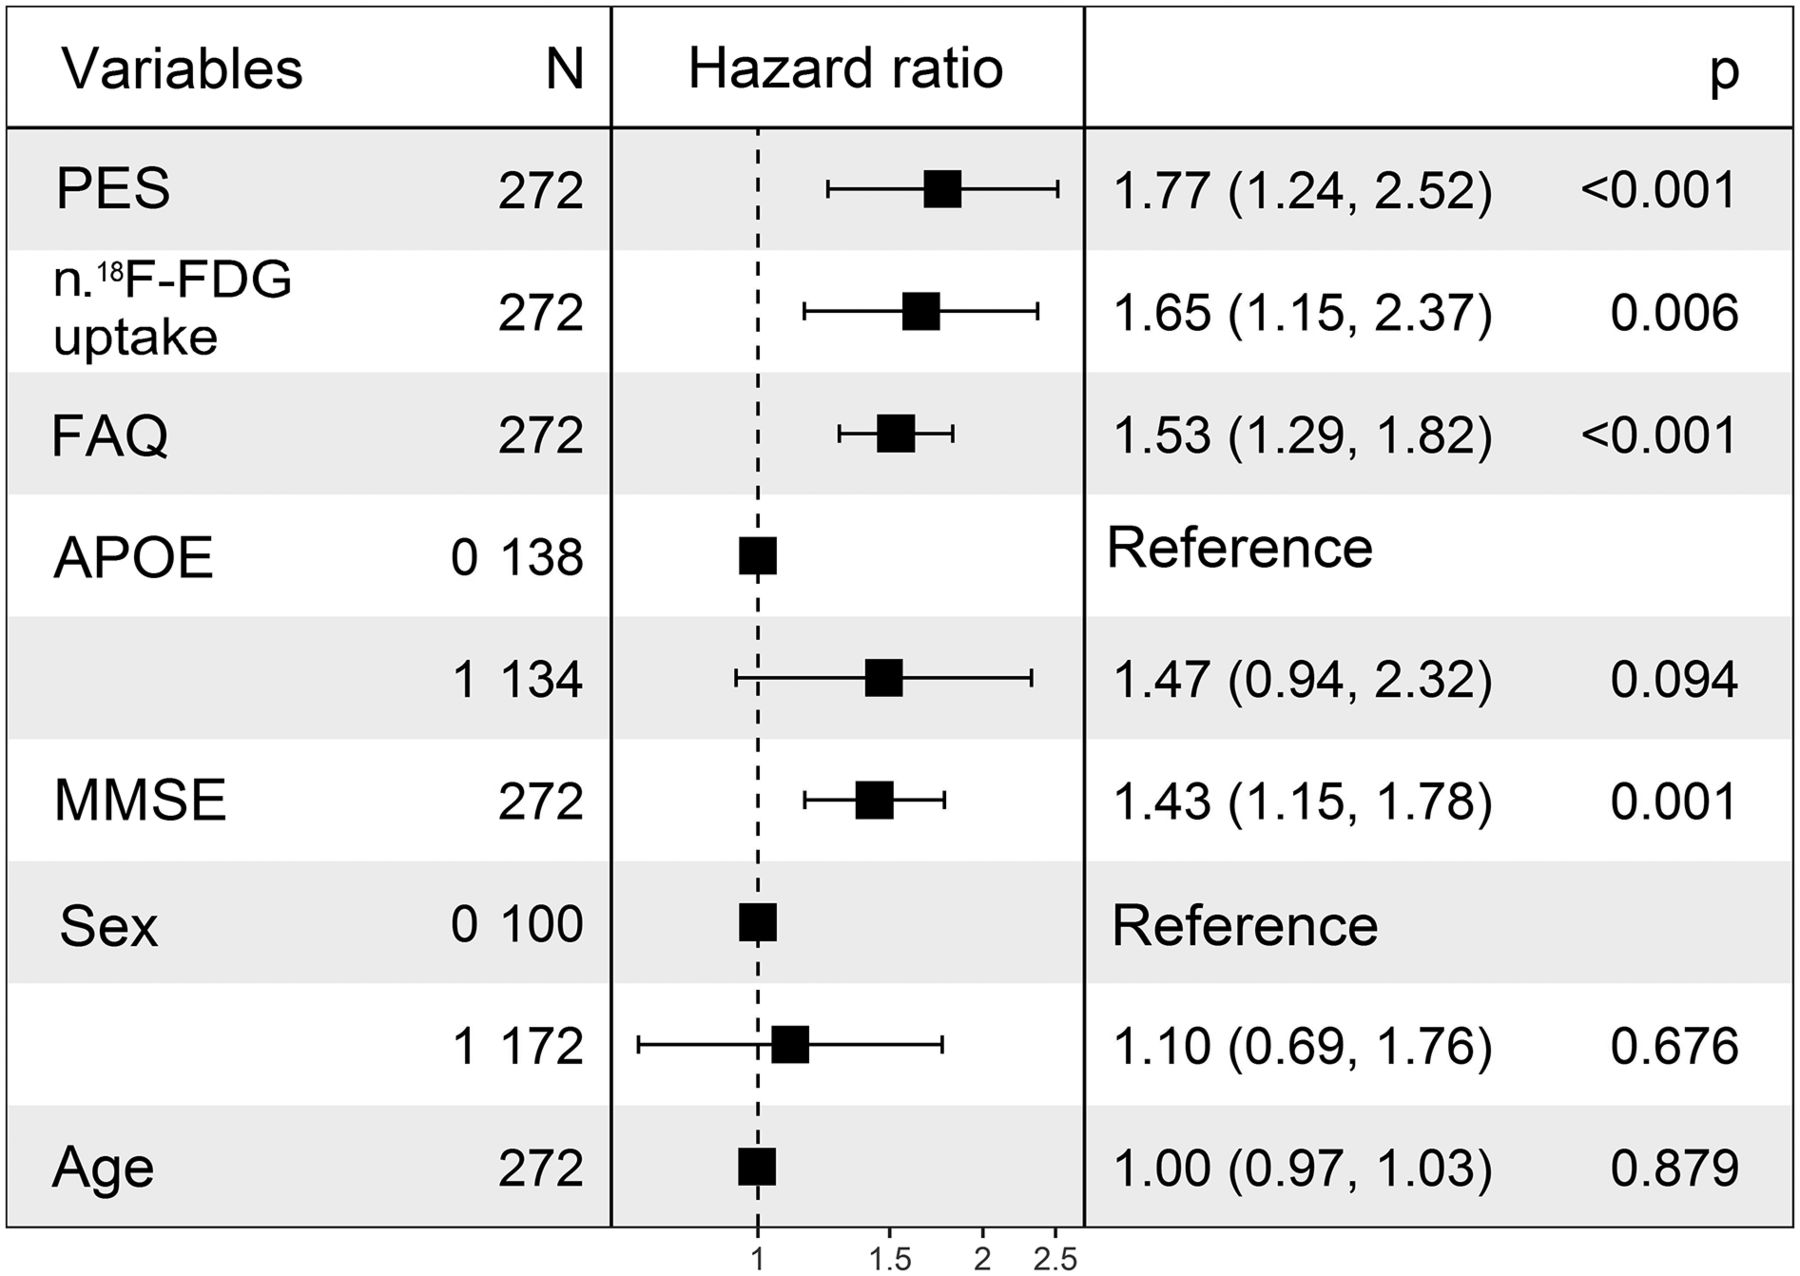
- FIGURE 2.
Hazard ratios for different predictors, penalized by ridge regression to suppress effects of multicollinearity among them. Normalized 18F-FDG uptake stems from linear combination of normalized 18F-FDG uptake in VOIs with significant hypometabolism and that in VOIs with significant hypermetabolism. APOE reference: APOE positive; sex reference: female. FAQ = FAQ total score; N = number of subjects; n. = normalized. All continuous variables were z transformed.
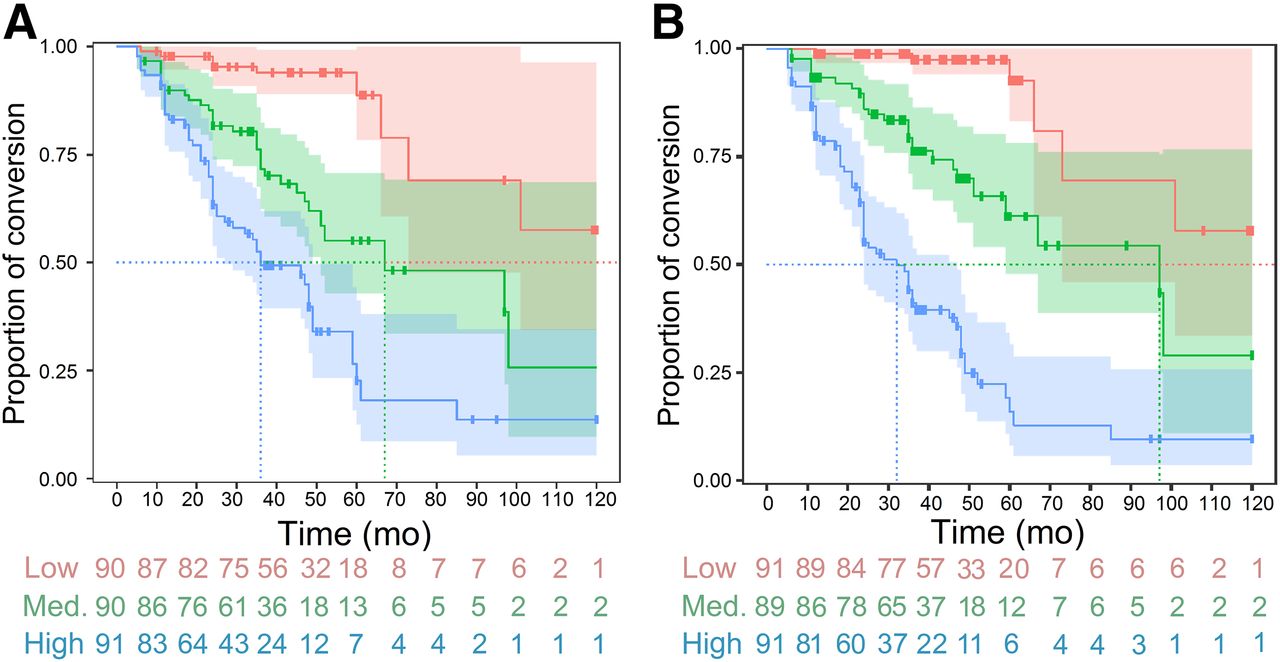
- FIGURE 3.
Kaplan–Meier curves for test dataset. (A) Risk strata determined using PES values alone. (B) Risk strata determined using PI derived from combined model (including PES values). Med. = medium.

Tables
Training dataset (n = 272) Test dataset (n = 272) Characteristic MCI-c (n = 87) MCI-nc (n = 185) MCI-c (n = 94) MCI-nc (n = 178) Age in y (mean ± SD) 75 ± 7 74 ± 8 73 ± 7 73 ± 8 Sex (no. of men/no. of women) 56/31 116/69 54/40 108/70 MMSE score (mean ± SD) 27 ± 2 28 ± 2 27 ± 2 28 ± 2 APOE ε4 positive (%) 63 43 70 42 FAQ score (mean ± SD) 1.74 ± 3.1 4.44 ± 4.7 1.70 ± 3.0 4.97 ± 4.7 Follow-up time (mo) Median 48 47 47 47 95% CI 47–49 47–49 46–48 46–48 Interquartile range 21.3 26.5 29.0 18.0 Harrell C index for: Model Predictor Hazard ratio P value AIC Training dataset Test dataset Imaging PES 2.96 2 × 10⁻¹⁶ 783.3*,† 0.76 0.73 Age 1.01 0.87 Sex 0.98 0.93 Clinical Age 1.00 0.95 797.2†,‡ 0.80 0.77 Sex 1.18 0.48 FAQ 1.66 2.0 × 10⁻¹⁰ APOE 1.85 0.007 MMSE 1.54 3.5 × 10⁻⁵ Combined PES 2.46 7.1 × 10⁻¹³ 749.6*,‡ 0.84 0.81 Age 1.01 0.90 Sex 1.08 0.72 FAQ 1.49 2.2 × 10⁻⁶ APOE 1.36 0.18 MMSE 1.51 0.0001 Hazard ratio Median time to conversion (mo) Pairwise log-rank P value Parameter Low risk Medium risk High risk Low risk Medium risk High risk Low vs. medium Medium vs. high Low vs. high PES values alone 1 4.62 9.70 120 68 36 1.2 × 10⁻⁵ 0.0007 3.0 × 10⁻¹³ PI derived from combined model (including PES values) 1 4.75 15.92 120 96 32 8.3 × 10⁻⁸ 1.2 × 10⁻⁵ 2.0 × 10⁻¹⁶
Supplemental Data
Files in this Data Supplement:


Jump to section
Related Articles
Cited By...
- Artificial intelligence for diagnosis and prognosis in neuroimaging for dementia; a systematic review
- Principal-Component Analysis-Based Measures of PET Data Closely Reflect Neuropathologic Staging Schemes
- Validation of the Alzheimer Disease Dementia Conversion-Related Pattern as an ATN Biomarker of Neurodegeneration
- Brain amyloid {beta}, cerebral small vessel disease, and cognition: A memory clinic study
- Predictive Value of 18F-Florbetapir and 18F-FDG PET for Conversion from Mild Cognitive Impairment to Alzheimer Dementia