


Abstract
Voxel-based principal-component analysis allows for an identification of patterns of glucose metabolism and amyloid deposition related to the conversion from mild cognitive impairment (MCI) to Alzheimer disease (AD). The present study aimed to validate these AD conversion-related patterns (ADCRPs) against neuropathologic findings. Methods: We included patients from the Alzheimer’s Disease Neuroimaging Initiative who underwent autopsy and for whom 18F-FDG PET (30 AD, 6 MCI, 2 cognitively normal) and amyloid-β (Aβ) PET (17 AD, 3 MCI, 2 cognitively normal) were available. Pattern expression scores (PESs) of the 18F-FDG- and Aβ-ADCRP were compared with Braak tangle stage and Thal amyloid phase, respectively. Mean 18F-FDG uptake and mean 18F-AV-45 SUV ratio (SUVr) in regions of hypometabolism and elevated amyloid load typical of AD, respectively, were used as volume-of-interest–based PET measures. The diagnostic performance for identifying none-to-low vs. intermediate-to-high AD neuropathologic change (ADNC) was assessed for all biomarkers. Results: We observed significant associations between PES of 18F-FDG-ADCRP and Braak stage (ρ > 0.48, P < 0.005) and between PES of Aβ-ADCRP and Thal phase (ρ > 0.66, P < 0.001). PES of 18F-FDG-ADCRP, PES of Aβ-ADCRP, and their combination identified intermediate-to-high ADNC with an area under the receiver-operating-characteristic curve (AUC) of 0.80, 0.95, and 0.98 (n = 22), respectively. Mean 18F-FDG uptake and mean 18F-AV-45 SUVr in AD-typical regions were also significantly associated with Braak stage (|ρ| > 0.45, P < 0.01) and Thal phase (ρ > 0.55, P < 0.01), respectively. Volume-of-interest–based PET measures discriminated between ADNC stages with an AUC of 0.79, 0.88, and 0.90 for mean 18F-FDG uptake, mean 18F-AV-45 SUVr, and their combination (n = 22), respectively. Contemplating all subjects with available 18F-FDG PET and neuropathology information (n = 38), PES of 18F-FDG-ADCRP was a significant predictor of intermediate-to-high ADNC (AUC = 0.72), whereas mean 18F-FDG uptake was not (AUC = 0.66), although the difference between methods was not significant. Conclusion: PES of 18F-FDG-ADCRP, a measure of neurodegeneration, shows close correspondence with the extent of tau pathology, as assessed by Braak tangle stage. PES of Aβ-ADCRP is a valid biomarker of underlying amyloid pathology, as demonstrated by its strong correlation with Thal phase. The combination of ADCRPs performed better than 18F-FDG-ADCRP alone, although there was only negligible improvement compared with Aβ-ADCRP.
A definite diagnosis of Alzheimer disease (AD) requires autopsy and neuropathologic assessment (1). According to the guidelines of the National Institute on Aging and the Alzheimer Association for the neuropathologic assessment of AD, the presence of neurofibrillary tangles (NFTs) and neuritic plaques is considered essential for the AD diagnosis (2). The recently introduced AT(N) classification scheme (amyloid-β [Aβ] deposition, pathologic tau, and neurodegeneration) (3) shifted the diagnostic landscape from clinical symptomatology toward in vivo biomarkers for lifetime diagnosis of AD. Still, the gold standard, against which in vivo assessments must be validated, is neuropathologic examination.
There are only a limited number of studies that assessed the quantitative relationship between the AD pathology and antemortem PET imaging (4–7). We recently applied principal-component analysis (PCA) to Aβ and 18F-FDG PET data to identify the AD conversion-related patterns of regional glucose metabolism (18F-FDG-ADCRP) and amyloid load (Aβ-ADCRP), which significantly predict conversion to AD in patients with mild cognitive impairment (MCI) (8,9). Thus, incorporation of ADCRPs into research diagnostic criteria may allow identifying high-risk individuals already at prodromal stages of the disease. For further validation, confirmation with neuropathology data is of high importance. Therefore, we investigated the relationship between 18F-FDG- and Aβ-ADCRP and neuropathology findings as expressed by Braak stage of NFTs (10) and Thal amyloid phase for neuritic plaques (11), respectively, and the value of individual and combined measures to identify the AD neuropathologic change (ADNC) stages (12).
MATERIALS AND METHODS
Patient Cohort
As of October 2019, 64 patients from the Alzheimer’s Disease Neuroimaging Initiative (ADNI, ClinicalTrials.gov identifier NCT00106899) had undergone autopsy. For this analysis, we included 38 patients with available 18F-FDG PET data (all male; mean age ± SD, 79 ± 8 y). Thirty patients were clinically diagnosed with AD and 6 with MCI; 2 were cognitively unimpaired. Additionally, for 22 of these patients, 18F-AV-45 amyloid PET data were present (17 AD, 3 MCI, and 2 cognitively normal). For most patients, PET imaging was performed within 2 y before the autopsy (18F-FDG PET, n = 21/38; amyloid PET, n = 12/22). Mini-mental state examination score significantly differed between diagnostic groups, whereas sex, age, and years of education were matched between groups. Antemortem-imaging, demographic, and clinical information for the patients was downloaded from the ADNI database (Table 1). The study protocol was approved by the ADNI Institutional Review Board, and the ADNI obtained written informed consent from all subjects before protocol-specific procedures were performed.
Demographic Characteristics of ADNI Subcohort with Available Neuropathology Data According to Antemortem Clinical Diagnostic Groups
Neuroimaging
PET acquisitions and data preprocessing were performed as previously described (8). For 18F-FDG PET (acquired 30–60 min after injection), we assessed the pattern expression score (PES) of the previously validated 18F-FDG-ADCRP (8), which was constructed by voxelwise PCA (13). The 18F-FDG-ADCRP is characterized by a metabolic decrease that is most prominent in the right and left temporoparietal cortex and in the precuneus and posterior cingulate cortex, whereas the metabolism of the sensorimotor and occipital cortices and cerebellum is relatively increased (preserved) (Supplemental Fig. 1A; supplemental materials are available at http://jnm.snmjournals.org). Similarly, for 18F-AV-45 PET (acquired 50–70 min after injection) the PES of the Aβ-ADCRP (9) was obtained by PCA on the amyloid PET data. The Aβ-ADCRP is characterized by the most prominently elevated amyloid load in the right and left precuneus, the posterior cingulate cortex, the mesial frontal cortex, the insular region, and the ventral striatum, whereas the cerebellum is spared (Supplemental Fig. 1B). Additionally, volume-of-interest (VOI)–based measures of cerebral 18F-FDG uptake and 18F-AV-45 Aβ binding were used. Mean normalized 18F-FDG uptake was calculated in regions of significant hypometabolism in MCI subjects who converted to AD, compared with stable-MCI subjects (obtained from a voxelwise 2-sampled t test performed in a previous study (8)). These regions comprised bilateral temporoparietal regions and the precuneus/posterior cingulate cortex (Supplemental Fig. 1C). The mean SUV ratio (SUVr) of 18F-AV-45 in regions with the highest Aβ burden in AD (14) (bilateral middle frontal, middle occipital, temporal, and superior parietal regions, with cerebellar cortex as the reference; Supplemental Fig. 1D) was used as a VOI-based Aβ PET measure.
Neuropathology
Autopsies were performed at participating centers according to the established neuropathologic procedures (15). Formalin-fixed paraffin-embedded brain tissue blocks were sent to the ADNI Neuropathology Core for analysis. The diagnosis was established following the criteria for the pathologic diagnosis of AD (16). Braak NFT stage (10), Thal amyloid phase (11), and ADNC (12) were selected for comparison to neuroimaging data.
Statistical Analyses
The relationship among neuroimaging biomarkers (PCA- and VOI-based) and the relationship of these with neuropathologic schemes were assessed with Spearman correlation coefficients (zero-order correlation). To account for the delay from PET examination to death (scan-to-death time), the partial Spearman correlation between neuroimaging and neuropathology data was calculated while controlling for the scan-to-death time (partial correlation).
To explore the possible additive value of combining biomarkers in predicting none-to-low vs. intermediate-to-high ADNC stage, we used logistic regressions to construct optimal combinations of biomarkers (separately for PCA- and VOI-based biomarkers). The diagnostic performance of PCA- and VOI-based biomarkers and their combinations (weighting defined by logistic regression) for classifying none-to-low versus intermediate-to-high ADNC stages was assessed and compared by receiver-operating-characteristic (ROC) analyses and the test of DeLong et al. (17). The optimal cutoffs were defined on the basis of the Youden index criterion, and respective values for sensitivity and specificity were calculated. Of note, we did not correct for scan-to-death time as a covariate, as the effect of this covariate was small and only inconsistently observed. All statistical analyses were conducted in R (R Foundation for Statistical Computing) and MedCalc (version 12.7.8.0).
RESULTS
PES of ADCRP Versus NFT and Aβ Stages
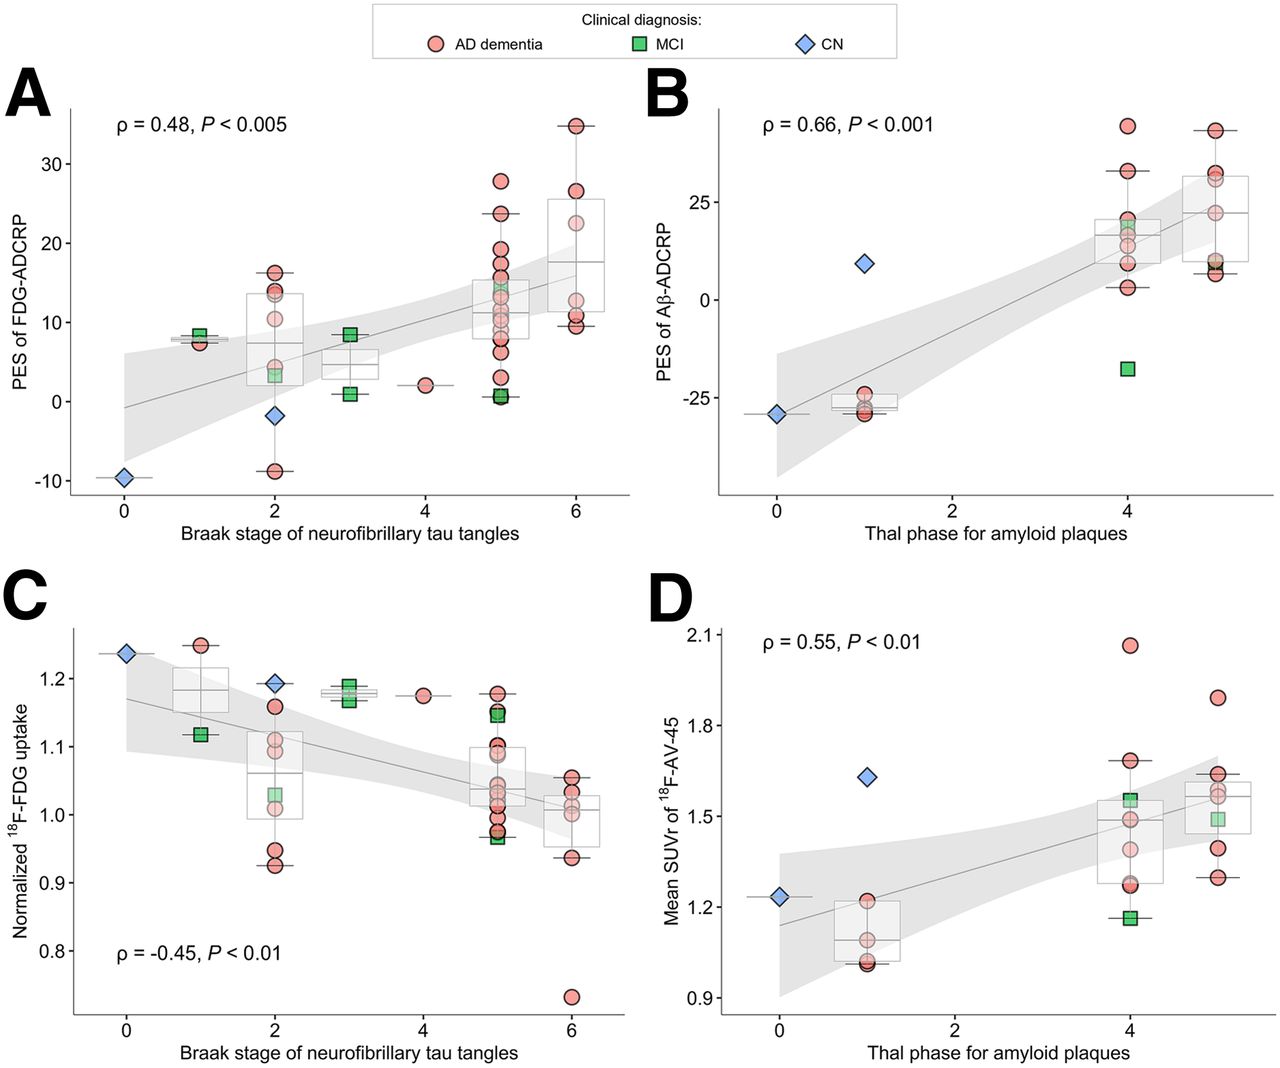
We observed a significant association between PES of 18F-FDG-ADCRP and Braak stages of NFTs (ρ = 0.48, P = 0.002, Fig. 1A). This relationship was slightly strengthened by taking into account scan-to-death time (ρ = 0.50, P = 0.001).

(A and B) Associations between PCA-based ADCRPs and neuropathologic stages: PES of 18F-FDG-ADCRP and Braak stage of tau tangles (A) and PES of Aβ-ADCRP and Thal phase of amyloid plaques (B). (C and D) Association between VOI-based measures and neuropathologic stages: mean normalized 18F-FDG uptake and Braak stage of neurofibrillary tau tangles (C) and mean SUVr of 18F-AV-45 and Thal phase of Aβ plaques (D). Spearman correlation coefficients and P values reflect strength and significance of association between variables. CN = cognitively normal.
The PES of Aβ-ADCRP was significantly correlated with the Thal amyloid phase (ρ = 0.66, P = 8 × 10⁻⁴; Fig. 1B). This correlation was slightly stronger when accounting for scan-to-death time (ρ = 0.71, P = 3 × 10⁻⁴).
VOI-Based Measures Versus NFT and Aβ Stages
Mean normalized 18F-FDG uptake in regions of AD-typical hypometabolism showed a moderate association with the PES of 18F-FDG-ADCRP (ρ = −0.64, P = 2 × 10⁻⁵). Mean normalized 18F-FDG uptake in regions of AD-typical hypometabolism was also significantly associated with Braak stage (ρ = −0.45, P = 0.005; Fig. 1C). The relationship between measures was not strengthened when we also accounted for the scan-to-death time (ρ = −0.45, P = 0.005).
Mean SUVr in AD-typical regions as derived from 18F-AV-45 PET was strongly correlated with PES of Aβ-ADCRP (ρ = 0.86, P = 1 × 10⁻⁶). Mean SUVr was significantly associated with the Thal phase (ρ = 0.55, P = 0.008; Fig. 1D). Although these associations were slightly improved when scan-to-death time was considered (ρ = 0.58, P = 0.006), the correlations between PES of Aβ-ADCRP and pathology (ρ = 0.71) remained slightly higher.
Prediction of AD Pathology
PCA-Based Measures
Logistic regression was used to establish a diagnostically optimal combination of the PES of 18F-FDG- and Aβ-ADCRPs to predict none-to-low versus intermediate-to-high ADNC (combined score = 0.11 × PES of 18F-FDG-ADCRP + 0.20 × PES of Aβ-ADCRP – 1.62; yielding 95% correct predictions). The combined PES score exhibited a moderate to strong correlation with the 4-step ADNC score (ρ = 0.73, P = 0.0001; Fig. 2A), which was not improved when accounting for the scan-to-death time (ρ = 0.73, P = 0.0001). PES of 18F-FDG- and Aβ-ADCRPs and their combination were significant predictors of none-to-low versus intermediate-to-high ADNC stage, with areas under the ROC curve (AUCs) of 0.80 (0.72 in all available 18F-FDG PET/neuropathology datasets, n = 38), 0.95, and 0.98, respectively (Table 2; Fig. 3A). The combined PES yielded a significantly higher AUC than PES of 18F-FDG-ADCRP (P = 0.04; n = 22 overlapping datasets), whereas the differences between the PES of 18F-FDG- and Aβ-ADCRPs and between the PES of Aβ-ADCRP and the combined PES score was not significant (P = 0.13 and P = 0.25, respectively).
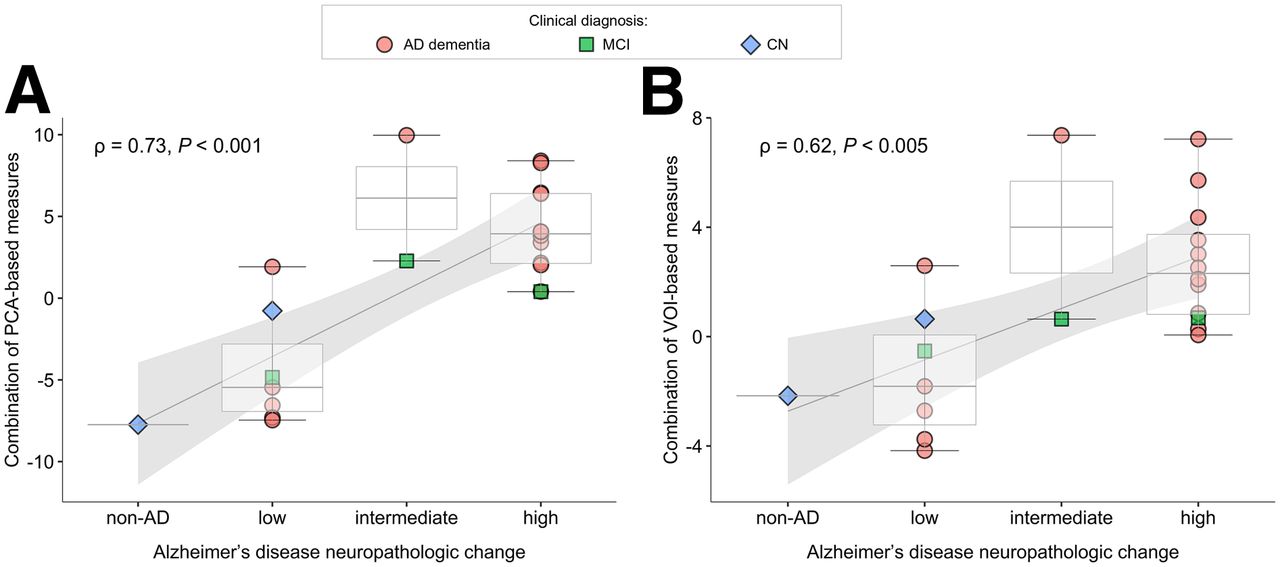
Associations between combinations of 18F-FDG and amyloid PET measures and ADNCs: PCA-based (A) and VOI-based (B). Spearman correlation coefficients and P values reflect strength and significance of association between variables. CN = cognitively normal.
Diagnostic Utility in Detecting None-to-Low vs. Intermediate-to-High ADNC
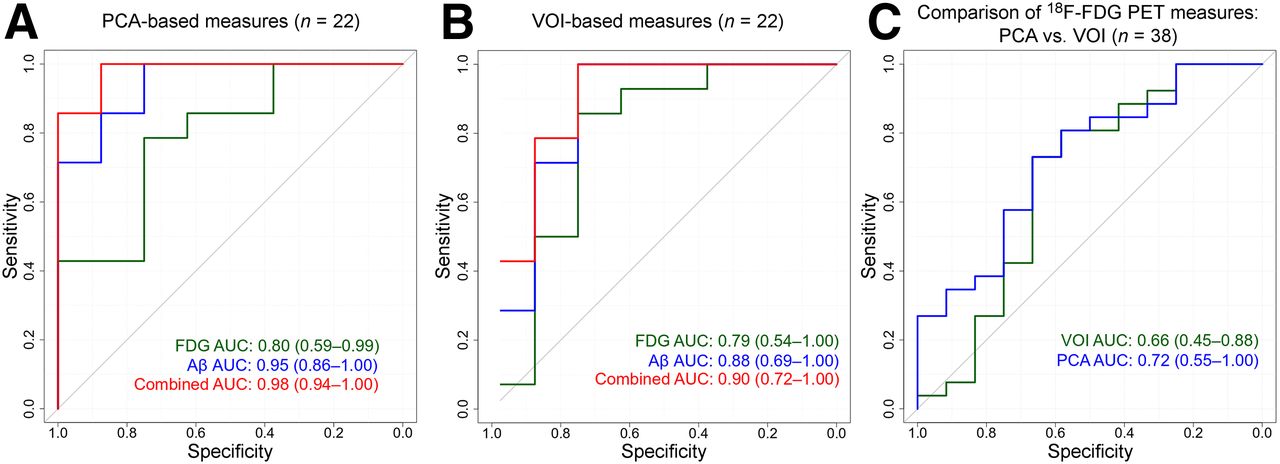
ROC analyses for classifying none-to-low vs. intermediate-to-high ADNCs. (A and B) AUCs are given for respective 18F-FDG PET, Aβ PET, and combined-outcome measures for PCA-based (A) and VOI-based (B) biomarkers (n = 22 patients). (C) Comparison between PCA- and VOI-based 18F-FDG PET measures when contemplating all subjects with available 18F-FDG PET/neuropathology information (n = 38).
VOI-Based Measures
The optimal combination of VOI-based mean normalized 18F-FDG uptake and mean SUVr in AD-typical regions to predict none-to-low versus intermediate-to-high ADNC was as follows: combined score = −13.75 × mean 18F-FDG uptake + 8.63 × mean 18F-AV-45 SUVr + 3.58 (91% correct predictions). The combined VOI-based measure showed a moderate correlation with the 4-step ADNC score (ρ = 0.62, P = 0.002; Fig. 2B), which was not improved when accounting for the scan-to-death time (ρ = 0.62, P = 0.002). Mean 18F-AV-45 SUVr and the combined VOI-based measure were significant predictors of none-to-low versus intermediate-to-high ADNC (AUC of 0.88 and 0.90, respectively), whereas the predictive value of mean normalized 18F-FDG uptake in AD-typical regions was only different from chance (AUC = 0.50) when the restricted dataset (n = 22; AUC = 0.79) but not all available 18F-FDG PET/neuropathology datasets (n = 38; AUC = 0.66) were contemplated (Table 2; Figs. 3B–3C). Differences in AUC between single and combined VOI-based measures were not significant (all P > 0.17).
Likewise, exploratory pairwise comparison of the OC AUC between overlapping (n = 22) 18F-FDG PET, Aβ PET, and combined measures yielded no significant differences (all P > 0.2). Cases that were misclassified by both methods (VOI- and PCA-based) are summarized in Supplemental Table 1.
DISCUSSION
The PES of 18F-FDG-ADCRP and the PES of Aβ-ADCRP have previously proven their usefulness in the prediction of conversion from MCI to AD (8,9). In this study, we compared these PCA-based PET biomarkers to neuropathologic data in patients who underwent autopsy. We demonstrated significant associations between PET data (PES of 18F-FDG-ADCRP and PES of Aβ-ADCRP) and neuropathologic findings (Braak stage and Thal phase, respectively). Furthermore, a combination of PES of 18F-FDG- and Aβ-ADCRPs showed a moderate to strong correlation with ADNC and was highly accurate in predicting intermediate-to-high ADNC stages. Further exploratory analyses suggest that the combined PES of 18F-FDG- and Aβ-ADCRP is a predictor superior to 18F-FDG-ADCRP alone but only marginally better than Aβ-ADCRP (n = 22 with 18F-FDG and Aβ PET). These analyses yielded no significant differences between PCA- and VOI-based methods. However, PES of 18F-FDG-ADCRP was a significant predictor of intermediate-to-high ADNC stages, whereas mean 18F-FDG uptake was not when contemplating all subjects with available 18F-FDG PET/neuropathology information (n = 38).
The delay from scan to death and autopsy may crucially affect the relationship of PET measures to neuropathology, particularly for biomarkers of ongoing neurodegeneration, whereas amyloid accumulation decelerates during the dementia phase of AD (18). Thus, the scan-to-death delay was included in the analyses because some patients underwent an autopsy more than 2 y after 18F-FDG PET, a fact that may bias the results toward relatively weaker neurodegeneration on 18F-FDG PET. However, this correction had only little effect. Neurodegeneration is not a direct measure of, even though it closely reflects, the Braak stage of NFTs (19). Likewise, 18F-FDG PET as a marker of neurodegeneration (3) only indirectly reflects tau pathology assessed by ADNC. In contrast, amyloid PET directly reflects Thal phases (20), as may well explain why amyloid PET provides a considerably better prediction of none-to-low versus intermediate-to-high ADNC stages and why the actual benefit of adding 18F-FDG PET is small. The present results also agree well with the study of La Joie et al. (6) in which intermediate-to-high ADNC was predicted by 11C-Pittsburgh compound B PET (centiloid measure; n = 179 patients) with an AUC of 0.90.
Although we primarily investigated the value of PCA as an advanced method for the PET data analysis, conventional measures based on preselected VOIs that are frequently used in clinical and research settings were also evaluated. PCA applied to amyloid PET data led to some improvement of the relationship between amyloid PET and neuropathologic staging (ρ = 0.66–0.71, without and with correction for scan-to-death time) compared with conventional amyloid PET analysis (ρ = 0.55–0.58) and the ability to predict intermediate-to-high ADNC stages (AUC = 0.95 vs. 0.88), although this difference failed to reach statistical significance in the present small study cohort.
Likewise, the overall correlation between the mean 18F-FDG uptake in regions with AD-typical hypometabolism and Braak tangle stage (ρ = −0.45) was slightly weaker than that for the PES of 18F-FDG-ADCRP (ρ = 0.48–0.50). Despite the different VOIs and reference region used in our study, the correlation between mean normalized 18F-FDG uptake in regions of AD-typical hypometabolism and Braak tangle stage was similar to the correlation reported by Lowe et al. (ρ = −0.36 to −0.45) (4). For amyloid PET measures, we observed a slightly weaker correlation to Thal phase than was found in the study using Pittsburgh compound B PET (ρ = 0.55–0.58 for mean SUVr and ρ = 0.66–0.71 for PES of Aβ-ADCRP vs. ρ = 0.75–0.76 in Lowe et al. (4)), as might be explained by methodologic factors (e.g., different PET tracers, multiple sites or scanners in the case of ADNI data) and the much smaller cohort (n = 22 vs. n = 100), among other factors.
Not all subjects had MCI or AD in cases of dementia (Table 1). We did not exclude cases with a non-AD diagnosis (n = 6/38) to reflect the clinical situation and estimate specificity. This method allowed us to contemplate a wider range of ADNCs for validation of PET measures. However, the study was still limited by the overall low number of cases (including cases without pathologic results), and the distribution of the Thal phase in the present cohort was biased toward low and high phases with no intermediate-range diagnosis present. Thus, particularly the comparison between analysis methods has to be viewed as preliminary, warranting further evaluation in larger datasets.
CONCLUSION
PES of 18F-FDG-ADCRP, a measure of neuronal injury and neurodegeneration, shows a close correspondence with the extent of tau pathology, as assessed by Braak tangle stage. PES of Aβ-ADCRP is a valid biomarker of underlying amyloid pathology, as demonstrated by its strong correlation with Thal amyloid phase. The combined score of 18F-FDG- and Aβ-ADCRP performed better than 18F-FDG-ADCRP alone in predicting intermediate-to-high ADNC stages, although there was only negligible improvement compared with Aβ-ADCRP. Further studies of sufficient sample sizes are needed to explore possible performance differences between PCA- and VOI-based methods.
DISCLOSURE
Data collection and sharing for this project were funded by the ADNI (National Institutes of Health grant U01 AG024904) and DOD ADNI (Department of Defense award W81XWH-12-2-0012). Philipp Meyer received honoraria from GE (presentation and consultancy) and Philips (presentation). No other potential conflict of interest relevant to this article was reported.
KEY POINTS
QUESTION: Do advanced methods of PET data evaluation reflect neuropathologic staging schemes, and if so, do they perform better than conventional methods of PET data evaluation?
PERTINENT FINDINGS: In this cohort study, 18F-FDG-ADCRP and Aβ-ADCRP significantly correlated with Braak tangle stage (ρ > 0.48) and Thal amyloid phase (ρ > 0.66) and allowed for predicting severe ADNCs with high AUCs of 0.80 and 0.95, respectively. VOI-based measures of 18F-FDG and amyloid PET were also significantly associated with Braak stage (|ρ| > 0.45) and Thal phase (ρ > 0.55) and discriminated between ADNC stages with an AUC of 0.79 and 0.88, respectively.
IMPLICATIONS FOR PATIENT CARE: These results are of high relevance by opening the opportunity to accurately predict underlying AD pathology based on the PET measures.
ACKNOWLEDGMENTS
The use in this work of ScAnVP software, copyright © 2020 The Feinstein Institute for Medical Research, is hereby acknowledged.
Footnotes
Published online Oct. 23, 2020.
- © 2021 by the Society of Nuclear Medicine and Molecular Imaging.
REFERENCES
- Received for publication June 30, 2020.
- Accepted for publication September 18, 2020.


