


Abstract
The LFER 150 PET/CT device (large–field-of-view extreme-resolution portable research imager) is a system for nonhuman primate (NHP) imaging. The objective of this study was to evaluate the performance of the system using the National Electrical Manufacturers Association NU 4-2008 standard protocol. As a preliminary in vivo evaluation of the system, a PET measurement in an NHP was also performed. Methods: Resolution, sensitivity, image quality, and noise-equivalent count rate (NECR) were measured. NECR measurement was performed with a ratlike phantom and a monkeylike phantom. A Derenzo phantom experiment was performed to test the resolution using 3-dimensional ordered-subset expectation maximization reconstruction. One cynomolgus monkey (4.5 kg, intravenous ketamine/xylazine anesthesia) was examined with the dopamine transporter radioligand 18F-FE-PE2I (94 MBq) to evaluate the in vivo performance of the system. List-mode PET data acquired for 93 min were reconstructed into 38 frames with the Tera-Tomo 3-dimensional engine. Binding potential for caudate nucleus, putamen, and substantia nigra was evaluated using the simplified reference tissue model. Results: Radial full-width half-maximum resolution using Fourier rebinning and a 2-dimensional filtered backprojection algorithm was less than 2.2 mm and less than 3.2 mm in the central 60-mm-diameter and 140-mm-diameter regions, respectively. Maximum sensitivity in the 400- to 600-keV and 250- to 750-keV energy windows was 30.03 cps/kBq (3.3%) and 49.11 cps/kBq (5.4%), respectively. The uniformity in the image-quality phantom was 3.3%, and the spillover ratio for air and water was 0.1. The peak of the NECR curve was 430 kcps (at 115 MBq) with the ratlike phantom and 78 kcps (at 139 MBq) with the monkeylike phantom. Rods of the Derenzo phantom with 1-mm diameter could be distinguished by eye. In the NHP experiment, binding potentials in the caudate, putamen, and substantia nigra (4.9, 4.9, and 1, respectively) were similar to those previously reported using the same radioligand and a high-resolution research tomograph. Conclusion: The results obtained from phantom experiments and 1 representative PET measurement in an NHP confirm that the LFER 150 is a high-resolution PET/CT system with suitable performance for brain imaging in NHPs.
An important step in translational research from rodents to humans is the examination and validation of molecular imaging targets in nonhuman primates (NHPs) (1). Because of the similarity of target distribution and metabolism between NHPs and humans, PET imaging in NHPs provides us with several advantages. First, examination of the whole-body distribution of novel PET tracers provides estimates of radiation dose that can help the transition to human applications. Second, NHP imaging can be useful to examine the brain exposure of new drugs developed for the central nervous system. Third, PET studies in NHPs can help examine the occupancy of drugs to receptor systems in the brain or in the rest of the body, thus lending support to drug development programs. Fourth, examination of the kinetic properties and in vivo metabolism of a novel PET tracer in NHPs can provide important information for future applications in humans. For these reasons, the development of a dedicated PET system for imaging NHPs is an important step in translational imaging research. Compared with clinical PET/CT systems, a dedicated PET system for NHPs has the advantage of higher resolution due to a smaller gantry bore, combined with a lower weight and smaller footprint requiring limited space for installation.
To the best of our knowledge, the LFER 150 PET/CT device (large–field-of-view [FOV] extreme-resolution portable research imager), manufactured by Mediso Ltd., is currently the only commercially available dedicated NHP PET system (Fig. 1). It consists of 18 panels sorted into 3 rings. On each panel are 29 × 29 lutetium yttrium oxyorthosilicate crystals 1.51 × 1.51 × 10 mm in size. The PET system has a transaxial FOV of 20 cm and an axial FOV of 15 cm. The gantry bore diameter is 26 cm. The electronics inside the camera detect events, calculate coordinates, measure energy, and select coincidences. The processed data are sent to a personal computer, where they are saved in list-mode format. List-mode format allows for flexible postprocessing of the data—for example, definition of dynamic time frames—as well selection of different energy or coincidence windows. The system supports 2-dimensional filtered backprojection with single-slice rebinning or Fourier rebinning and fully 3-dimensional reconstructions with Mediso’s own Tera-Tomo engine (2,3). The engine uses Monte Carlo system matrix modeling (4) and has elaborate functions taking into account depth of interaction (5,6) and positron range (7). The intended main role of the CT imaging component is to provide data for attenuation and scatter correction (8) of the PET reconstruction. CT acquisitions with circular, semicircular, and helical trajectories are supported. The energy of the 80-W x-ray tube is adjustable between 40 and 80 kVp. The CT FOV that is covered in a single rotation matches that of the PET component. Default settings for exposure time are 50 and 90 ms using binning and 200 and 300 ms for the native resolution of the detector, which should enable single–breath-hold lung scans in NHPs. The number of projections is easily customizable with 360, 480, and 720 as defaults. The reconstruction method for this modality is filtered backprojection, with several filters and an adjustable cutoff. The CT portion can achieve less than a 200-μm resolution at 10% modulation transfer function. Besides conventional acquisitions of the NHP in a recumbent position under anesthesia, the gantry of the LFER 150 can be tilted, enabling PET studies to be performed while properly trained NHPs are awake and sitting.

LFER 150 with MobilCell (Mediso Ltd.) docking station and carbon bed designed for whole-body NHP measurements. On bed lies monkeylike phantom that was used for NECR measurement.
The purpose of this study was to evaluate the performance parameters of the LFER 150 system, based mainly on the National Electrical Manufacturers Association (NEMA) NU 4-2008 standard (9). The NEMA standard includes measurements of spatial resolution, scatter fraction, count losses, random coincidence rate, sensitivity, image quality, accuracy of attenuation, and scatter corrections. We also performed a PET measurement on a NHP to make a preliminary examination of the performance of the system for in vivo molecular brain imaging.
MATERIALS AND METHODS
NEMA NU 4-2008 Methods
Data were acquired and evaluated using the methodology of the NEMA NU 4-2008 standard for resolution, sensitivity, image quality, and noise-equivalent count rate (NECR). In addition, a Derenzo phantom scan was performed to evaluate the resolution visually using 3-dimensional ordered-subset expectation maximization reconstruction.
Resolution and sensitivity were measured using a 22Na point source (MMS09; Eckert and Ziegler), with an active-dimension sphere of less than 0.3 mm centered in a capsule. Its activity was 125 kBq and 102 kBq at the time of the measurements, respectively. The time window was 5 ns for all experiments if not stated otherwise.
Spatial Resolution with Point Source
The source was carefully placed in the prescribed positions. Data were acquired for 5 min with a 400- to 600-keV energy window and with the following coincidence modes: 1:3 for 0, 5, 10, 15, and 20-mm; 1:5 for 25, 30, and 40-mm; 1:7 for 50- and 60-mm; and 1:9 for 70-mm radial positions. The coincidence mode is an acquisition parameter that defines the possible line of responses during acquisition. In 1:1 coincidence mode, each detector module is in coincidence with only the one directly opposite. In 1:3 or 1:9 coincidence mode, each detector module is in coincidence with 3 or 9 opposite detector modules, respectively. A higher coincidence mode increases the FOV and, hence, the amount of raw data stored and processed.
Data were sorted into sinograms using Fourier rebinning and were reconstructed using 2-dimensional (2D) filtered backprojection. The voxels had a thickness of 0.79 mm and an in-plane edge of 0.3 mm.
Spatial Resolution with Small-Animal Derenzo Phantom
The phantom was filled with 11.05 MBq of 18F-FDG mixed with water. Data were acquired for 2 h with a 400- to 600-keV energy window and reconstructed with 3-dimensional (3D) ordered-subset expectation maximization using 11 iterations and 9 subsets.
Scatter Fraction, Count Losses, and Random Coincidence Measurements in Ratlike and Monkeylike Phantoms
Measurements were performed with a ratlike phantom (150-mm length, 50-mm diameter) and a monkeylike phantom (400-mm length, 100-mm diameter) made of a high-density polyethylene cylinder. Both phantoms have an off-centered axial bore 3.2 mm in diameter containing a plastic tube filled with activity.
The ratlike phantom was filled with a water solution containing 18F-fluoride. The radioactivity was 247 MBq at the beginning of the PET measurement and 50 kBq at the end. One minute of data was acquired every 30 min. The measurement was performed in 1:5 coincidence mode. Data were binned with a 400- to 600-keV energy window and sorted into 2D sinograms using single-slice rebinning.
The monkeylike phantom was also filled with a water solution containing 18F-fluoride. The radioactivity was 588 MBq at the beginning of the PET measurement and 97 kBq at the end. One minute of data was acquired every 30 min. The measurement was performed in 1:7 coincidence mode. Data were binned with a 400- to 600-keV energy window and sorted into 2D sinograms using single-slice rebinning.
Sensitivity
The point source was mounted on the animal bed and moved axially with it. We performed measurements at 86 points; the step size varied between 0.8 and 2.4 mm. Data were binned both in 400- to 600-keV and in 250- to 750-keV energy windows with single-slice rebinning.
Image-Quality Phantom
The standard NEMA phantom was filled with 3.7 MBq of water solution containing 18F-FDG, and PET data were acquired for 20 min. A CT image was acquired after the PET scan and used to generate attenuation maps for the PET reconstruction. We used maximum-likelihood expectation maximization with 25 iterations; the isovoxel edge was 0.2 mm.
Postreconstruction Filtering
Reconstructed images were not filtered afterward because regularization filters are integrated into the iterative reconstruction. A so-called spike filter was used to erase outlier voxels (point noises) at the edge of the FOV to ensure an optimal dynamic range for the DICOM image.
NHP Experiment
The NHP study was approved by the Animal Ethics Committee of the Swedish Animal Welfare Agency and was performed according to Guide for the Care and Use of Laboratory Animals. A cynomolgus monkey (Macaca fascicularis, 4.5 kg) underwent PET using the dopamine transporter radioligand 18F-FE-PE2I (18F-(E)-N-(3-iodoprop-2-enyl)-2β-carbofluoroethoxy-3β-(4′-methylphenyl)nortropane) (10). Anesthesia was induced by intramuscular injection of ketamine hydrochloride (12 mg/kg) and maintained by intravenous infusion of ketamine hydrochloride (4 mg/kg/h) and xylazine hydrochloride (0.4 mg/kg/h). The head of the monkey was immobilized using the specifically designed NHP bed of the LFER 150 (Fig. 2). 18F-FE-PE2I (90 MBq) was injected intravenously, and list-mode data were acquired for 93 min. PET images were reconstructed with a series of frames of increasing duration (10 s × 10, 15 s × 2, 20 s × 3, 30 s × 4, 60 s × 4, 180 s × 4, and 360 s × 12) with a voxel size of 1.2 × 1.2 × 1.2 mm. The reconstruction was performed using the Tera-Tomo 3D algorithm (with 10 iterations and 9 subsets), including detector modeling with attenuation and scatter correction based on a 3-component material map. Volumes of interest were manually delineated on an MR image of the animal, which was manually coregistered with the average PET image using the FUSION tool in PMOD software (version 3.7; PMOD Technologies). Radioactivity concentration was expressed as SUV. Binding potential was obtained with the simplified reference tissue model using the cerebellum as the reference region (11).

Monkey bed with head holder specifically designed for brain imaging.
RESULTS
PET Performance Measurements
Spatial Resolution with Point Source
The full width at half maximum and the full width at tenth maximum obtained with 2D filtered backprojection ranged between 1.76 and 3.15 mm and between 3.7 and 4.99 mm, respectively (Table 1).
NEMA NU 4-2008 FWHM and FWTM Resolutions at Different Radial Positions
Spatial Resolution with Small-Animal Derenzo Phantom
The rods with 1-mm diameter could just be distinguished by eye when the data were reconstructed with 3D ordered-subset expectation maximization (Fig. 3).
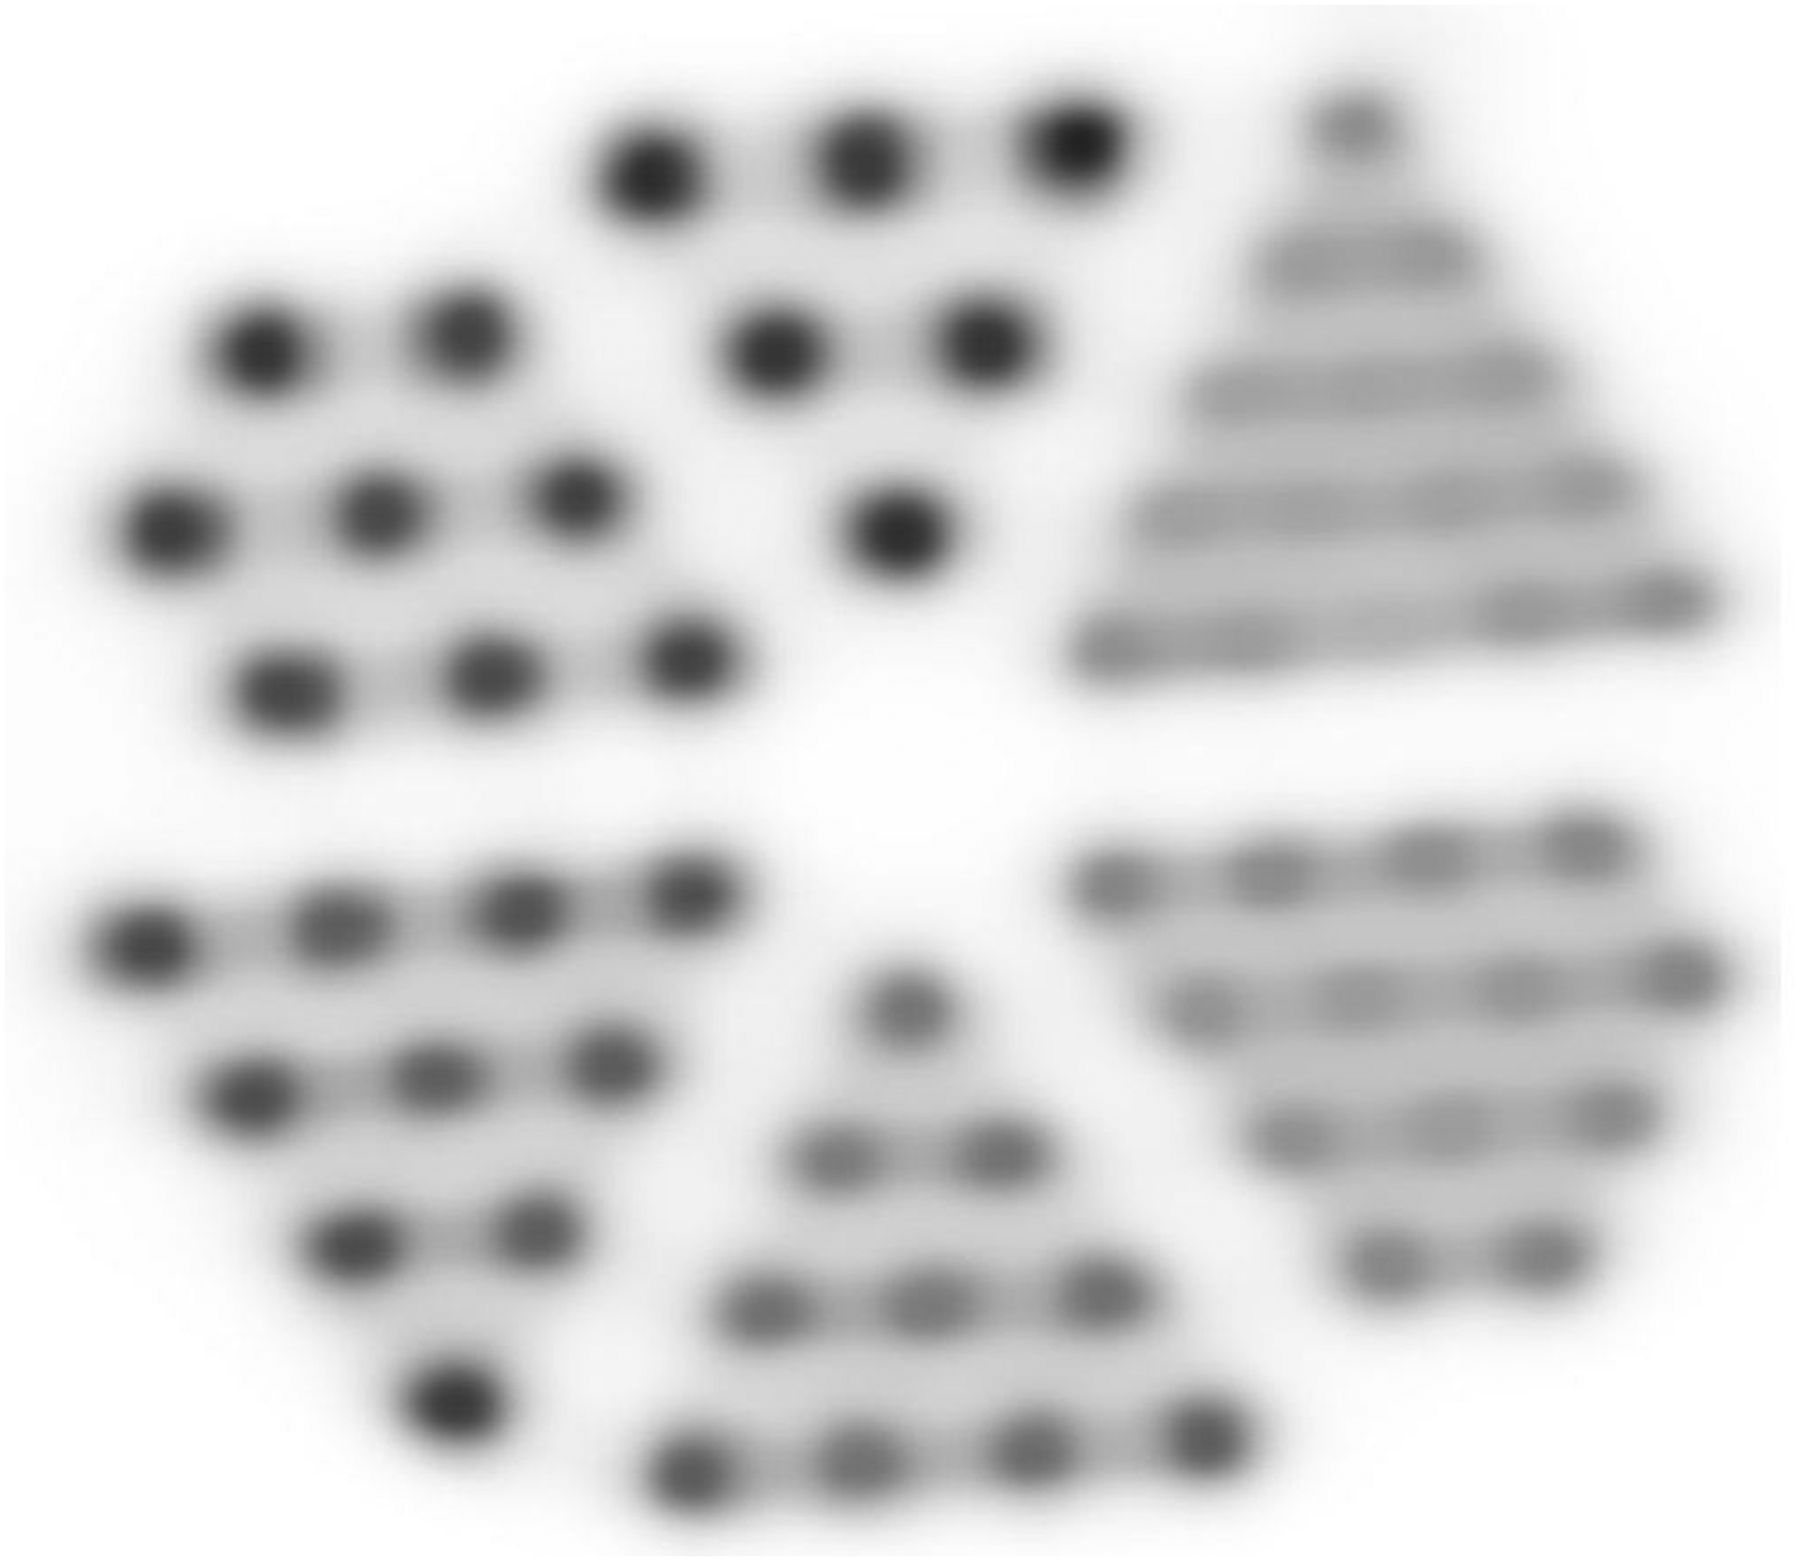
Derenzo phantom filled with 11.05 MBq of 18F-FDG. Diameters of rods in sections are 1, 1.1, 1.2, 1.3, 1.4, and 1.5 mm clockwise starting at 1-o’clock direction.
Sensitivity
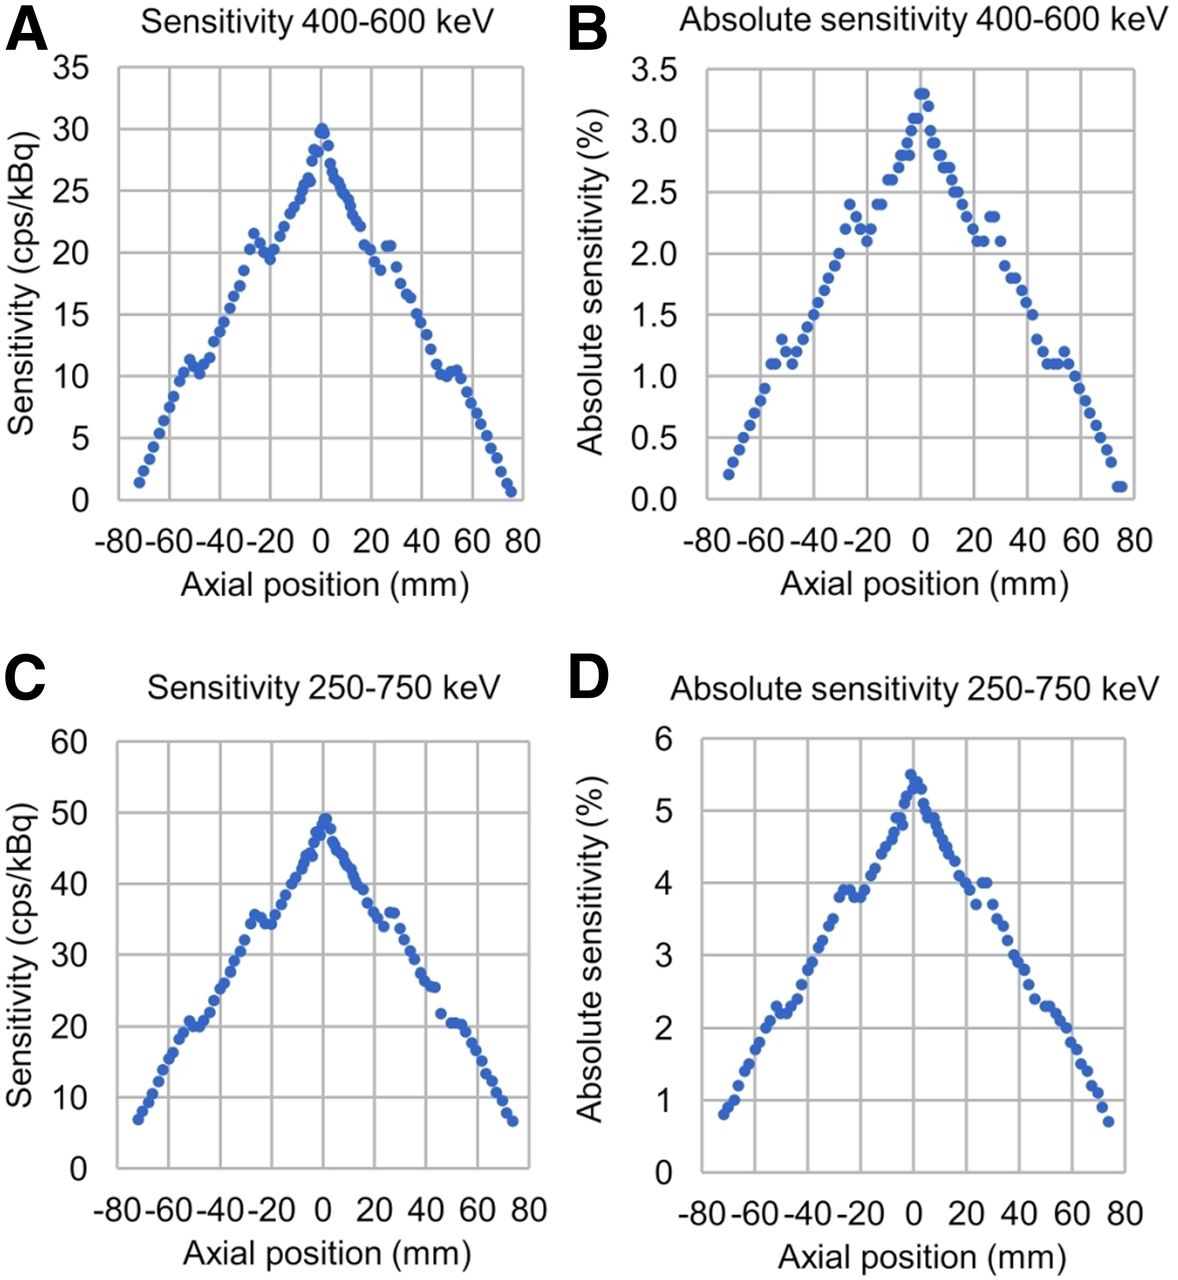
Maximum sensitivity in the 400- to 600-keV and 250- to 750-keV energy windows was 30.03 cps/kBq (absolute value, 3.3%) and 49.11 cps/kBq (absolute value, 5.4%), respectively (Fig. 4).

Sensitivity and absolute sensitivity profiles with 400- to 600-keV energy window (A and B) and with 250- to 750-keV energy window (C and D).
Image-Quality Phantom
The recovery coefficients ranged between 0.08 and 1.07 (Table 2). The uniform-activity region had an SD of 3.3%. The spillover ratio for water and air was 0.1, with an SD of 15.9% and 12.6%, respectively.
PET Recovery Coefficients
System Total, True, Random, and Scattered Event Rates
The scatter fraction was 0.14 and 0.27 for the ratlike and monkeylike phantoms, respectively. The system NECR was first evaluated with the standard 5-ns time window of the system, resulting in a peak NECR of 398 kcps at 149 MB and of 64.7 kcps at 128 MBq for the ratlike and monkeylike phantoms, respectively (Fig. 5). Next, we investigated whether it was advantageous to reduce the time window. The data were thus rebinned with various time window settings. We found that the true rate at the activity of the peak NECR was not affected by reducing the time window to 2.5 ns. The peak NECR was improved to 430 kcps at 115 MBq and 78 kcps at 139 MBq for the ratlike and monkeylike phantoms, respectively.

NEMA NU 4-2008 system total, true, random, and scattered event rates and system NECR as function of average effective activity concentration for ratlike (A) and monkeylike (B) phantom, with indication of NECR peak.
Brain PET Imaging in NHP
Brain PET images and time–activity curves for 18F-FE-PE2I in the cynomolgus monkey showed high uptake in the caudate and putamen, moderate uptake in the substantia nigra, and negligible uptake in the cerebellum, consistent with the known distribution of the dopamine transporter in the brain (Fig. 6). The binding potential of 18F-FE-PE2I in caudate, putamen, and substantia nigra was 4.9, 4.9, and 1.0.

(A and B) Representative horizontal, sagittal, and coronal PET images of 18F-FE-PE2I (average between 0 and 93 min) in 1 NHP at level of striatum (A) and substantia nigra (B). PET images are also overlaid on coregistered MRI scan (bottom row of A and B). (C) Time–activity curves of 18F-FE-PE2I in target (caudate, putamen, and substantia nigra) and reference (cerebellum) regions.
DISCUSSION
Brain PET imaging in NHPs is a key translational step for the development of central nervous system drugs and molecular brain imaging markers. Accurate quantification of neuroreceptors and brain imaging targets in NHPs requires high resolution, considering the relatively small size of the NHP brain. The estimated brain volume for a cynomolgus or rhesus monkey is 70–90 cm3, approximately 15 times smaller than the volume of the human brain (12,13). Therefore, the development of a dedicated PET system for brain imaging in NHPs is an important component of the translational chain from small animals to humans. The LFER 150 is a PET/CT system developed for imaging NHPs with special focus on the brain.
The main objective of this study was to examine the performance of the LFER 150 according to the NEMA standard protocol. In addition, a preliminary in vivo evaluation of the system for brain PET measurements was performed on a NHP using the dopamine transporter radioligand 18F-FE-PE2I.
Although high-resolution small-animal and human PET systems are available, no brain-dedicated PET system for NHP imaging has yet been developed, to our knowledge. Therefore, to objectively assess the capability of the LFER 150, it can be compared only with small-animal PET systems and brain-dedicated human PET systems, such as the high-resolution research tomograph (HRRT; Siemens Medical Imaging), the NeuroPET/CT (Photo Diagnostic Systems), and the Focus 220 (Siemens Medical Imaging). Different NEMA standard protocols are applied for small-animal and human PET systems. The performance characteristics of clinical PET systems were conventionally evaluated according to some edition of the NEMA NU 2 standard (2001, 2007, or 2012), whereas those of small-animal PET systems are usually investigated in accordance with the NEMA NU 4-2008 standard. To assess the performance of the LFER 150, the NEMA NU 4-2008 standard was used as in the case of other preclinical systems.
For comparative purposes, sensitivity and resolution measurements of the LFER 150 and those reported for other clinical and preclinical systems are shown in Tables 3 and 4. The values reported in Table 3 are expressed as absolute system sensitivity that takes into account the sensitivity measurements of the point source at different axial positions of the FOV. According to the NEMA NU-2 standard, the sensitivity measurement has to be performed with a 70-cm-long line source. For the comparability with the NEMA NU-4 absolute sensitivity, we normalized the NU-2 sensitivity results for the axial FOV of the clinical scanners. Considering that the sensitivity measurements were obtained with different NEMA standards, energy, and time windows, the LFER 150 seemed to perform similarly to or better than other preclinical systems. The recent clinical systems can have nearly the same or higher sensitivity (normalized for 1 axial FOV), but the spatial resolution differs significantly.
Comparison of Absolute System Sensitivity for Different PET Scanners
Comparison of In-Plane Resolution (RFWHM × TFWHM) for Different PET Scanners
The in-plane resolution of the LFER 150 measured with the point source reconstructed with 2D filtered backprojection was slightly better than the resolution reported for the HRRT (14) and the Focus 220 (15) and was much better than the resolution reported for the NeuroPET/CT (16). Using the small-animal Derenzo phantom, rods with 1-mm diameter can just be distinguished by eye with the LFER 150, indicating that high-resolution images can be obtained using an iterative 3D reconstruction method. The diameter of rods that could be visualized using the Focus 220, the NeuroPET/CT, and the HRRT were 1.25, 6.4, and 2.4 mm, respectively (15,16,17). These results were achieved using 2D filtered backprojection reconstruction in the case of the Focus 220 and the HRRT and using 3D maximum-likelihood expectation maximization with the NeuroPET/CT. Using 2D ordered-subset expectation maximization with the Focus 220, rods with 1.6-mm diameter were visualized (17).
The NECR obtained with the LFER 150 was slightly higher than the one reported for the Focus 220 (18) and corresponded to a lower radioactivity in the FOV because of the higher sensitivity of the system.
The measurements of the recovery coefficients using the image-quality phantom showed that the LFER 150 can be used for quantification with high precision, even for regions only 3 mm in diameter. Finally, the results of in vivo PET measurement conducted on an NHP using the dopamine transporter radioligand 18F-FE-PE2I showed that the time–activity curves and the binding potentials obtained for different brain regions were consistent with previous results obtained using the HRRT system (19). These preliminary findings suggest that the LFER 150 can be used for quantitative brain imaging studies in NHPs. However, a thorough evaluation of the quantitative performance of the system requires a larger number of experiments comparing the LFER 150 and the HRRT using radioligands for different neurotransmitter systems. The specific design of the gantry and the bed of the LFER 150 permits use of the system for other possible applications, such as whole-body PET/CT studies on NHPs or simultaneous PET/CT measurements of multiple rodents using specifically designed animal holders.
CONCLUSION
The LFER 150 PET/CT device is a high-resolution system for brain imaging of NHPs. The performance of the system is similar to other high-resolution PET systems for small animals or humans, making the LFER 150 a potential multipurpose molecular imaging system for preclinical research. Ongoing studies are currently examining the quantitative performance of the system with regard to brain and whole-body imaging in NHPs and to simultaneous imaging of multiple rodents.
DISCLOSURE
The study was supported by funds from Stockholm Brain Institute and Vinnova. The research group at Karolinska Institutet has research collaboration with Mediso Ltd., the company that has developed the system described in this article. The present study was a joint project, and 4 of the authors are employees of the company. Dr. Andrea Varrone has been a consultant for Mediso Ltd. No other potential conflict of interest relevant to this article was reported.
KEY POINTS
QUESTION: What is the performance of the LFER 150 PET/CT system for NHP imaging according to the NEMA NU 4-2008 standard?
PERTINENT FINDINGS: The performance of the LFER 150 PET/CT device was similar to other high-resolution PET systems for small animals or humans. The system is suitable for high-resolution brain imaging of NHPs.
IMPLICATIONS FOR PATIENT CARE: The development of a PET/CT system for imaging of NHPs is of great value for translational research, facilitating the development of new molecular imaging markers and providing support to drug development programs.
Acknowledgments
We thank the staff of the PET Centre at Karolinska Institutet for excellent technical support. Part of the data has been previously presented at the EANM Congresses in 2016 and 2017 and at the PSMR Conference in 2018.
Footnotes
Published online Jul. 13, 2019.
- © 2019 by the Society of Nuclear Medicine and Molecular Imaging.
REFERENCES
- Received for publication December 7, 2018.
- Accepted for publication May 7, 2019.


Jump to section
Related Articles
Cited By...
- Markov Field network model of multi-modal data predicts effects of immune system perturbations on intravenous BCG vaccination in macaques
- Transiently boosting V{gamma}9+V{delta}2+ {gamma}{delta} T cells early in Mtb coinfection of SIV-infected juvenile macaques does not improve Mtb host resistance
- Intravenous BCG induces a more potent airway and lung immune response than intradermal BCG in SIV-infected macaques1
- CD4 T cells and CD8{alpha}+ lymphocytes are necessary for intravenous BCG-induced protection against tuberculosis in macaques
- Host Immunity to Mycobacterium tuberculosis Infection is Similar in Simian Immunodeficiency Virus (SIV)-infected, Antiretroviral Therapy-treated and SIV-naïve Juvenile Macaques