


Abstract
Prostate-specific membrane antigen (PSMA) PET/CT has a high diagnostic accuracy for lesion detection in metastatic prostate cancer, including bone metastases. Novel therapeutic approaches require valid biomarkers for standardized disease staging and for evaluation of progression and therapy response. Here, we introduce EBONI (Evaluation of Bone Involvement), a software tool to automatically quantify the bone metastasis load in PSMA PET/CT. Lesion quantity, mean and maximum lesional SUV, z score, and percentage of affected bone volume are determined. EBONI is open source and freely available. Methods: To validate EBONI, the results of automated quantification of 38 PSMA PET/CT scans with different levels of bone involvement were compared with visual expert reading. The influence of SUV threshold and Hounsfield unit thresholds was analyzed. Results: A high correlation between bone lesion quantity as determined visually and automatically was found (SUVmax, r2 = 0.97; SUVmean, r2 = 0.88; lesion count, r2 = 0.97). The Hounsfield unit threshold had no significant influence, whereas an SUV threshold of 2.5 proved optimal for automated lesion quantification. The systematic error of false-positive tissue misclassification was low, occurred mainly around the salivary and lacrimal glands, and could easily be corrected. There were no false-negative ratings. Conclusion: EBONI analysis is robust, quick (<3 min per scan), and 100% reproducible. It allows rater-independent quantification of bone metastasis in metastatic prostate cancer. It provides lesion quantification equivalent to that of visual assessment, as well as providing complementary information. It can be easily implemented as an add-on to visual analysis of PSMA PET/CT scans and has the potential to reduce turnaround time.
Prostate-specific membrane antigen (PSMA), also known as glutamate carboxypeptidase II, is a transmembrane glycoprotein that is highly expressed in prostate cancer cells (1). With the recent advent of radioligands binding to PSMA, it has become obvious that molecular imaging with PSMA PET/CT is a diagnostic tool with high sensitivity and specificity for detecting tumor lesions of prostate cancer (2–5). Thus, PSMA PET/CT bears great potential for early detection of recurrence and for disease staging and follow-up.
There is an obvious need for biomarkers for accurate disease staging and for longitudinal diagnostic assessment of prostate cancer, such as for monitoring disease progression or the effects of a therapeutic intervention. Although overall survival as a parameter represents a most important endpoint, particularly in studies investigating later disease stages, its value is limited. It potentially requires long follow-up periods to allow judgment of therapeutic efficacy and, thus, is not suitable in earlier disease stages, and it may be strongly affected by the baseline stage of disease and the pattern of disease distribution (i.e., the affected organ systems). Thus, biomarkers are required allowing precise disease staging at baseline for patient selection and classification, including identification of affected organ systems and assessment of the true extent of disease, as well as quantitative follow-up of disease progression and therapy monitoring. Whereas several methods are used in this context, such as serum levels of the prostate-specific antigen and different imaging procedures, validation is incomplete and no uniform response criteria are established (6–9).
Over 85% of patients in late stages of prostate cancer have tumor involvement of the bone (10). Conventional bone scintigraphy represents the current gold standard to measure metastasis load, but it has only a limited sensitivity, especially in cases with low prostate-specific antigen levels (11). Thus, also regarding inclusion in therapy trials, patients with existent bone metastases may be missed or the extent of disease may be underestimated by means of bone-scan assessment. PSMA PET/CT may represent a more promising imaging biomarker for this purpose because of its high sensitivity and specificity in detecting metastases after biochemical relapse of prostate cancer (12,13) and the increasing availability of the method. Consistently, a recent study indicated the superiority of PSMA PET/CT over conventional bone scintigraphy in the detection of bone metastases (14).
However, PSMA PET/CT ratings based on visual readings or observer-dependent region-of-interest–based approaches (deriving categoric or numeric values to approximate the metastatic load) is hampered by the limited inter- and intrarater reliability (e.g., based on arbitrary or nonstandardized definition of size or location of regions of interest) (15), the limited information on the true extent of disease (e.g., underestimation of actual tumor load by exclusive assessment of lesion number), and the need for time-consuming effort.
It has already been shown that automated software–based scan interpretation of conventional planar bone scintigraphy improves the assessment of disease progression in patients with metastatic prostate cancer (16–18). This software-based interpretation makes use of the so-called bone-scan index, a well-introduced tool originally developed for manual scoring allowing quantification of total bone metastasis load as a percentage (19,20). Likewise, in the diagnosis of pulmonary nodules or liver lesions with CT (21,22), and in the field of neuroscience, semiautomated and automated approaches toward image rating are currently being evaluated as well (23–26). Moreover, automated lesion delineation has been applied in a unimodal PET study imaging the National Electrical Manufacturer Association phantom (27).
Here, we present EBONI (Evaluation of Bone Involvement), a software tool for fully automated quantification of bone metastasis load in PSMA PET/CT scans, using bimodal information from PET and CT. EBONI is a tool developed only for scientific purposes and has not been approved for clinical use. The software creates a standardized report that can be used for longitudinal intrasubject comparison of PET/CT-derived parameters and for scientific use in the evaluation of the prognostic value of these parameters. Total bone volume, total bone metastasis volume, percentage of affected bone tissue, SUVmean and SUVmax in the affected tissue, and total metastasis count are determined. The software and its source code are freely available at https://github.com/jochenhammes/PSMA_Analysis/.
MATERIALS AND METHODS
All procedures in studies involving human participants were in accordance with the ethical standards of the institutional research committee and with the 1964 Helsinki declaration and its later amendments or comparable ethical standards. Written informed consent was obtained from all participants included in this study. Analyses were performed according to the Standards for Reporting Diagnostic Accuracy Studies, as described in the supplemental material (available at http://jnm.snmjournals.org).
Patients
Twenty 68Ga-PSMA PET/CT scans of patients with metastatic prostate cancer that was clinically rated as containing at least 1 bone metastasis and 18 bone-negative scans were selected. The patient characteristics are in Table 1.
Patient Characteristics
Imaging
PET was performed at the Department of Nuclear Medicine, University Hospital Cologne, Germany, with a Biograph mCT Flow 128 Edge scanner (Siemens). A low-dose CT scan was acquired before all PET scans and used for attenuation correction (voxel size, 1.5 × 1.5 × 3 × 0 mm). A whole-body scan was acquired 76 min (±17 min) after intravenous injection of 68Ga-PSMA HBED-CC (where HBED-CC is N,N′-bis[2-hydroxy-5-(carboxyethyl)benzyl]ethylenediamine-N,N′-diacetic acid) (average dose, 170 MBq; SD, 40.3 MBq). Images were iteratively reconstructed (3-dimensional ordered-subsets expectation maximization; 4 iterations; 12 subsets; 200 × 200 matrix; voxel size, 4.1 × 4.1 × 3.0 mm) and smoothed by a gaussian filter (5 mm in full width at half maximum).
Software Development
The software is implemented in the operating system–independent MATLAB environment (The MathWorks, Inc.). Essential functions can also be run in Octave (https://www.gnu.org/software/octave), a freely available open-source implementation of the MATLAB programming language.
Prerequisites
Image data must be available in DICOM format (28). A 3-dimensional PET/CT dataset consists of slices representing axially aligned planar images stacked along the z-axis. Separate DICOM stacks exist for CT and PET datasets. To ensure the functionality of EBONI, the CT and PET datasets must comprise a similar number of slices and the data need to be represented in a common anatomic space so that a definite mapping of each CT voxel to a corresponding PET voxel is possible (similar in-plane resolutions are not required).
Algorithmic Design
Automated PET/CT analysis comprises 7 steps, which are depicted in Figure 1. The first step is loading of the DICOM header of the PET and CT images to determine the image acquisition parameters (injected activity, interval between injection and image acquisition, patient weight, physical half-life of the nuclide, in-plane resolution, slice number). The second step, importing of the image matrices into the MATLAB workspace, uses the “dicm2nii Toolbox” by Li (29) and the “Tools for NIfTI and ANALYZE Image” by Shen (30). In the third step, a binary bone mask is created by applying a Hounsfield unit threshold (HUT) to the CT image matrix. All below-threshold vales are set to 0, and all above-threshold values to 1. The total bone volume is calculated by multiplication of the voxel volume by the number of nonzero voxels in the bone mask. The fourth step is application of the bone mask to the PET image to set all nonbone voxels to 0. The fifth step is segmentation of the PET image matrix by application of an SUV threshold (SUVT) to eliminate all values below the SUVT. SUVmean and SUVmax in the above-threshold voxels and total above-threshold volume are calculated. If means and SDs of SUVmean in a group of healthy controls are present, Z-transformed deviations of individual SUVmean from control group average SUVmean are calculated. The sixth step is cluster analysis to identify contiguous above-threshold voxels with voxelwise application of a 3-dimensional flood fill algorithm (modified from Dinath (31)). For each contiguous lesion, volume, SUVmean, SUVmax, and xyz-position are determined. The final step is to save the results in .csv files and in a graphic report sheet with a maximum-intensity projection displaying the anatomic distribution of above-threshold voxels. Sample images of 4 patients depicting maximum-intensity projections of unprocessed input PET datasets and the respective EBONI output are displayed in Figure 2. The generated report contains information on total bone volume, total bone metastasis volume, percentage of affected bone tissue, SUVmean and SUVmax in the affected tissue, Z-transformed deviation of SUV in the affected tissue from average SUV in nonaffected tissue, and total metastasis count.

Algorithmic design of automated PSMA PET/CT analysis software. csv = comma-separated values; HC = healthy controls.

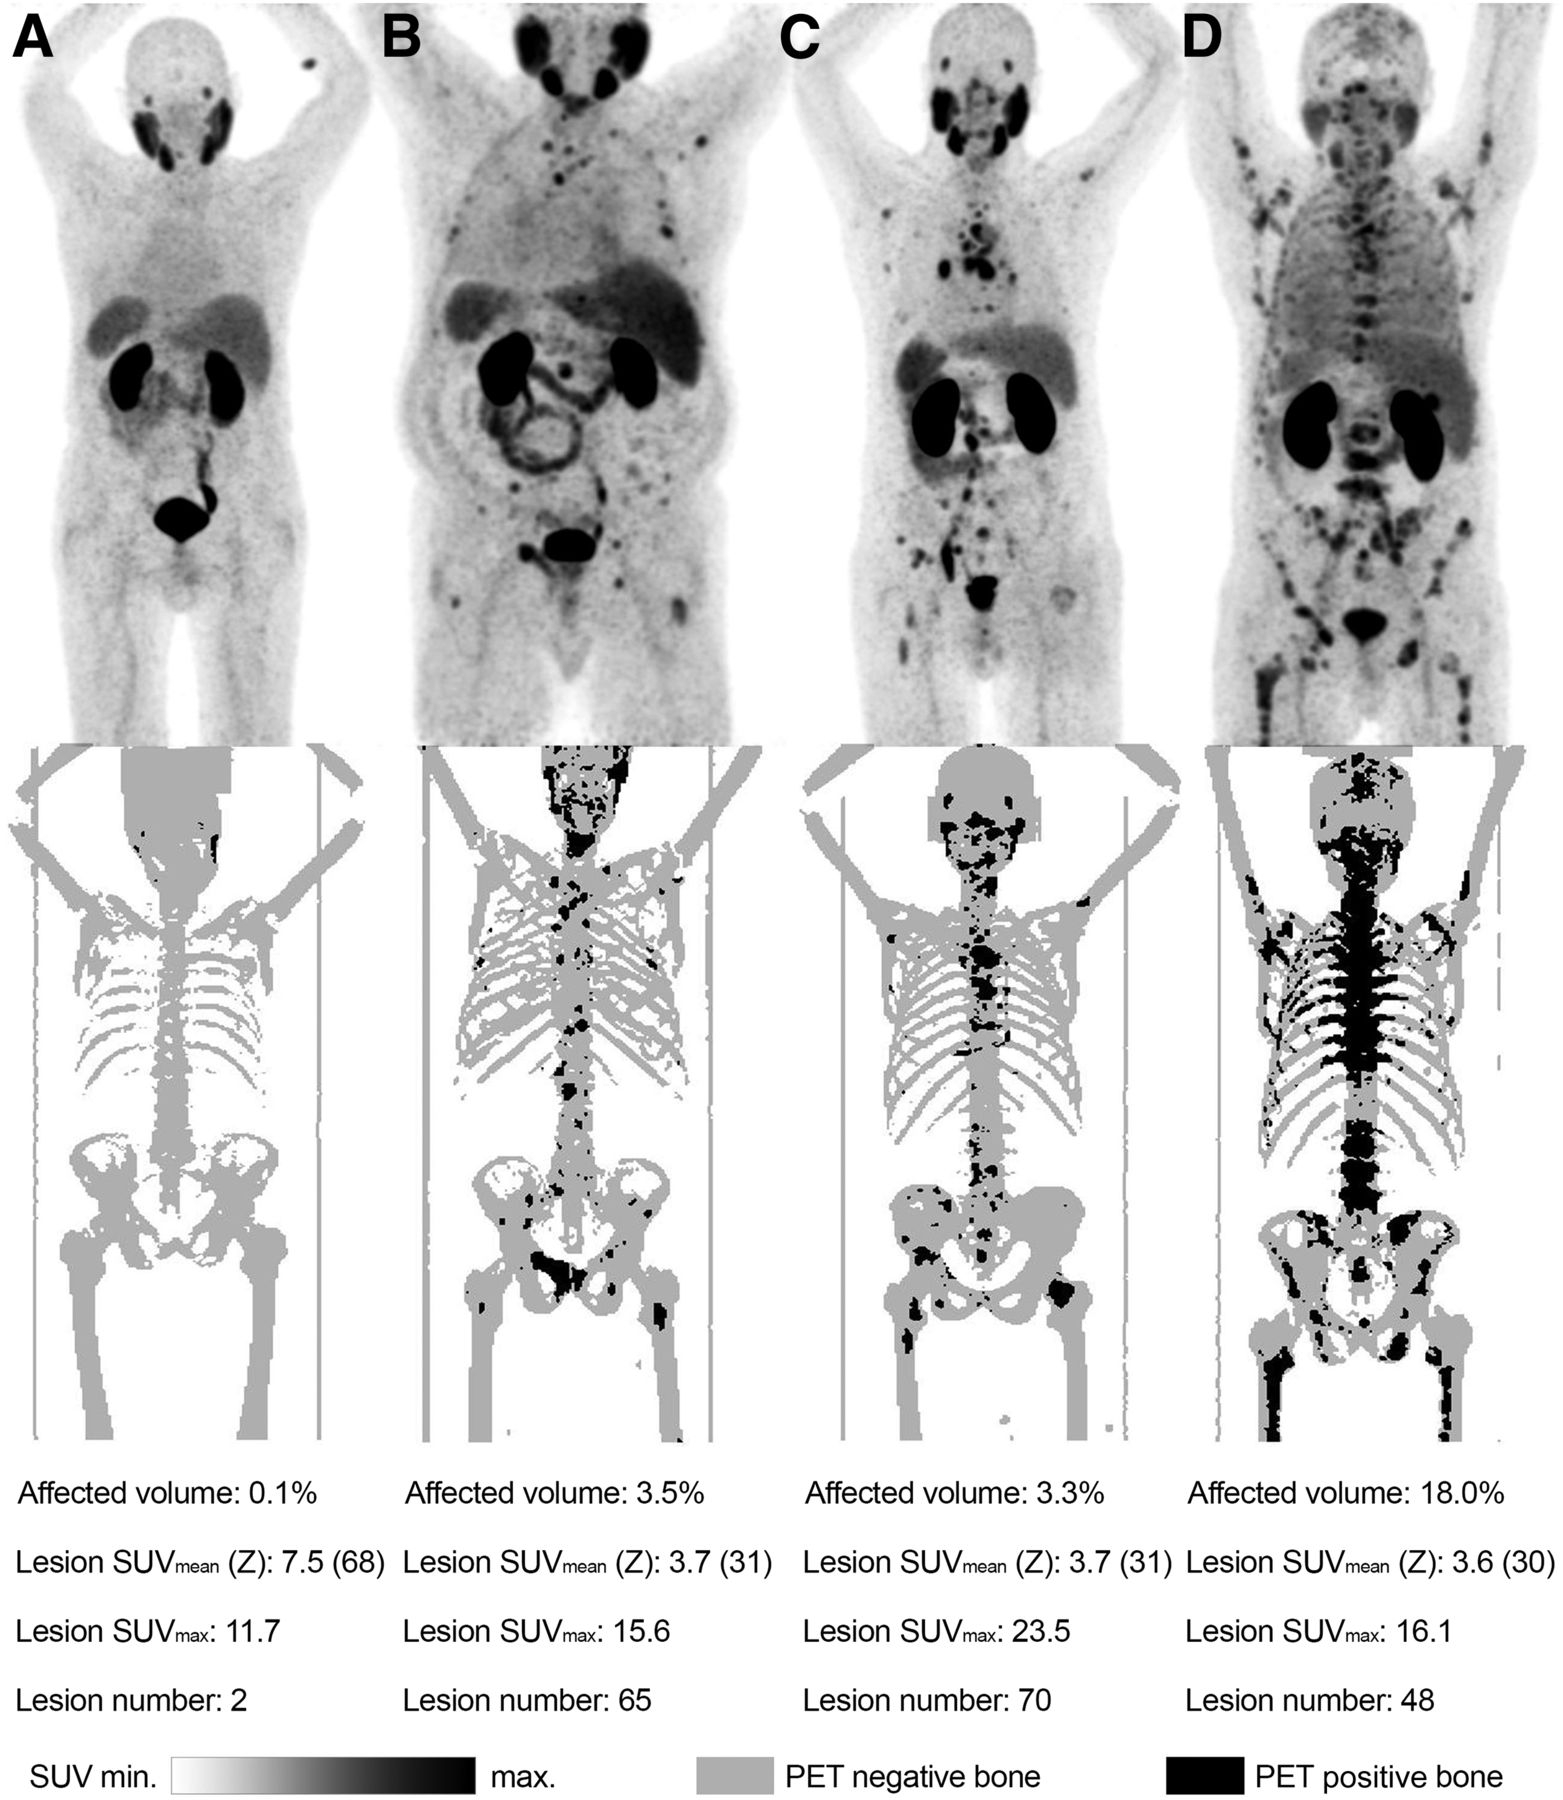
Four subjects who underwent PSMA PET/CT. (A) Subject showing no bone metastasis in visual rating. (B and C) Subjects showing moderate bone metastasis load. (D) Subject showing high number of PET-positive osseous lesions. Maximum-intensity projections of unprocessed input data are shown at top, and automatically segmented bone tissue (gray) and PET-positive osseous lesions (black) are shown at bottom. Systematic elimination of nonspecific uptake can be seen in, for example, abdominal organs and urinary tract.
Validation
A visual rating of the bone metastasis load in the 38 PSMA PET/CT datasets of patients was performed by 2 expert readers. The bone tumor burden was determined in analogy to PERCIST (32). The number of osseous lesions was determined independently by each rater, and the arithmetic mean was used for later analysis. The readers reached a consensus on the 5 most prominent osseous lesions in each scan, and the SUVmean and SUVmax in the lesions was determined. To determine SUVmean, the lesion volume was segmented automatically, delineating consecutive voxels around the hottest voxels down to a threshold of 0.4 × SUVmax.
The bone-positive datasets were then analyzed automatically by EBONI, and the reports were compared with the results of the visual rating. Different values for SUVT and HUT were applied in the automated analysis: SUVT ranged from 1.5 to 10, and HUTs of 270, 300, 330, 360, and 400 were used. To evaluate the influence of different HUTs, a 1-way ANOVA of SUVmean in the PET-positive tissue was performed for all SUVTs. To estimate the influence of the selected SUVT and overall metastasis load on PET-positive volume, a multiple-regression model was calculated with PET-positive volume as a dependent variable and with metastasis count and the selected SUVT as independent variables. The visually determined numbers of lesions (arithmetic mean between ratings of the 2 readers) were compared with the automated lesion count for different SUVTs. For each SUVT, a correlation analysis was performed between the visually determined lesion number and the number derived from automated analysis. Additionally, summed squared deviations between these measures were calculated. The average concordance between visual and automated ratings for SUVmean and SUVmax was determined by correlation analysis for different SUV thresholds. To determine the mean and SD of SUVmean in nonaffected bone tissue and to quantify the percentage of voxels falsely classified as positive, EBONI analysis was also performed on the bone-negative PSMA PET/CT datasets.
RESULTS
The average run time per scan was 2.9 min (±1.3 min). SUVmean in bone tissue in the bone-negative scans was 0.55, with an SD of 0.10. The average relative amount of tissue falsely classified as positive in bone-negative scans was 0.03% for an SUVT of 10, 0.05% for an SUVT of 8, 0.1% for an SUVT of 6, 0.22% for an SUVT of 4, and 1.1% for an SUVT of 2. In the bone-positive scans, no false-negative classification of bone metastasis selected by the raters occurred in the EBONI analysis.
The selected HUT did not have a significant influence on group average SUVmean in PET-positive tissue for any of the SUVTs, as confirmed by ANOVA, whereas total segmented bone volume naturally showed a strong negative correlation with the selected HUT (R2 > 0.98, P < 0.01 for every scan). Furthermore, metastasis count was a fair predictor of total PET-positive volume as described by a multiple linear regression model with the selected SUVT as the covariate (multiple R2 = 0.59, P < 0.001 for metastasis count, P = 0.59 for SUVT).
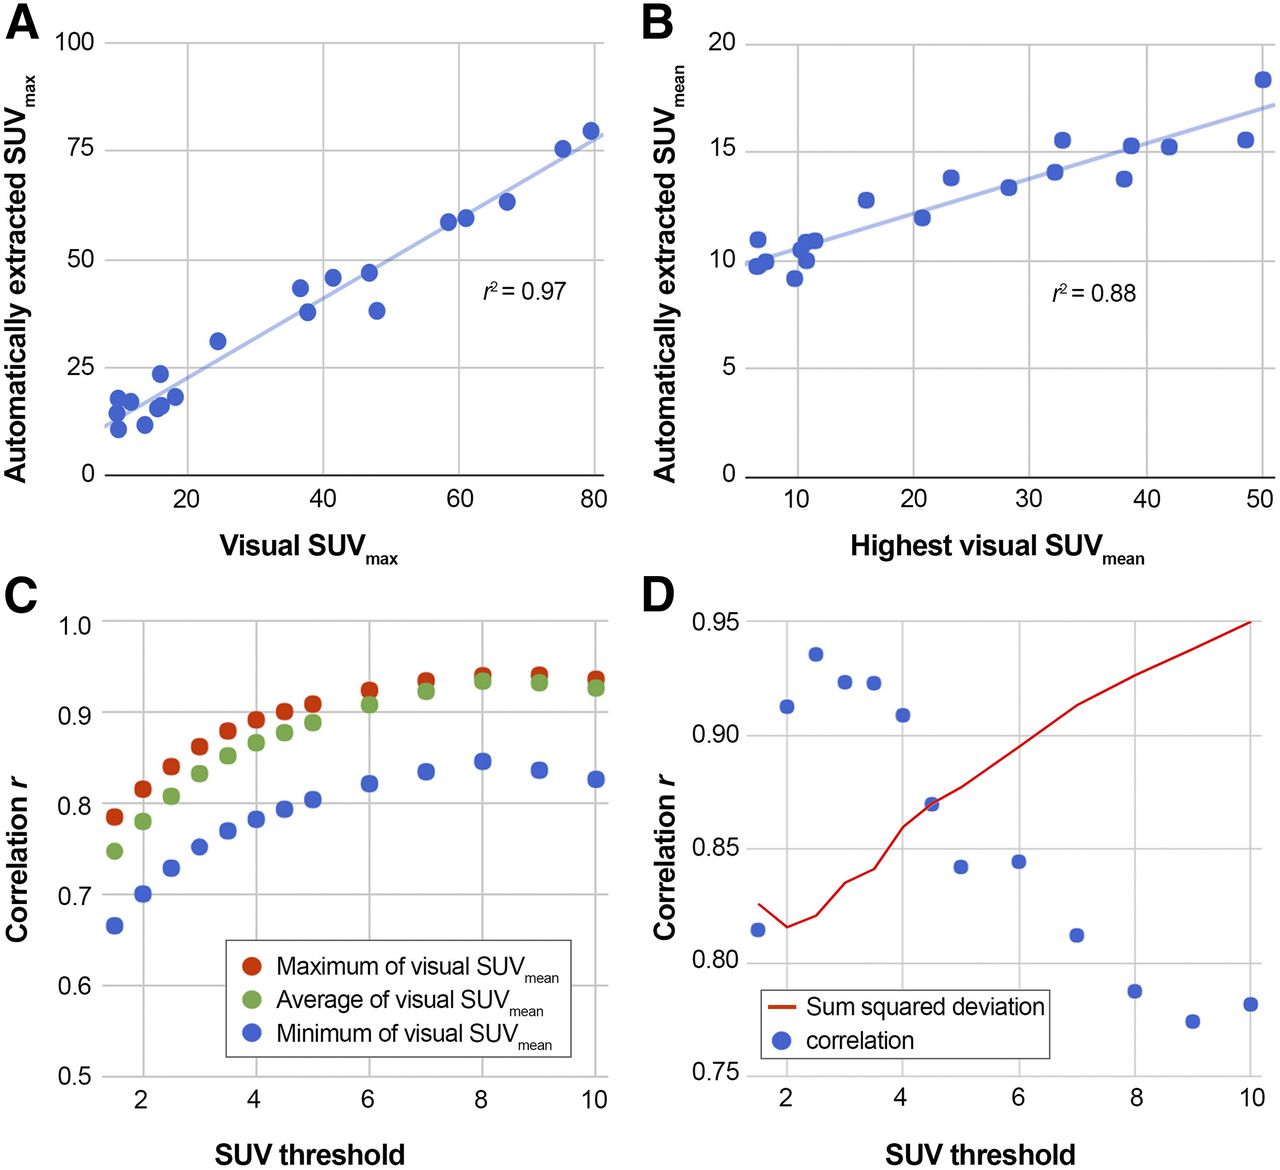
We observed a strong concordance between manually and automatically extracted SUVmax (R2 = 0.97, Fig. 3A) independent of SUVT. Correlation strengths between visually and automatically determined SUVmean depend on the selected SUVT (Fig. 3C). The strongest correlation was observed for an SUVT of 8 (R2 ≤ 0.88, Fig. 3B). The number of visually counted lesions correlated strongly between the expert readers (r = 0.97). The concordance between visually and automatically determined lesion counts was best for an SUVT of 2.5 (Fig. 3C).

Results of correlation analysis between manually and automatically extracted values. (A) Correlation of SUVmax determined visually and automatically with SUVT of 5. (B) Correlation of highest mean SUV in visual rating and SUVmean in PET-positive volume (SUVT of 8). (C) Dependence of correlation strength between visually and automatically determined SUVmean and SUVT. (D) Dependence of correlation between visually and automatically determined lesion count on selected SUVT, and summed squared deviation between visually and automatically determined lesion count.
DISCUSSION
Here, we have presented EBONI, a software tool that can perform a fully automated, observer-independent quantification of bone metastasis load in PSMA PET/CT scans. Total bone volume, total bone metastasis volume, percentage of affected bone tissue, SUVmean and SUVmax in the affected tissue, Z-transformed deviation of SUVmean in the affected tissue from SUVmean of bone-negative controls, and total metastasis count are included in a standardized report. The software is freely available on the Internet.
Because of the algorithmic nature of the automated quantification, it is 100% reproducible and observer-independent. A systematic comparison of the rating results of 38 PSMA PET/CT scans revealed a good concordance between the standardized visual rating by expert readers and the EBONI output. The overall performance of bone segmentation was good. Spillover from extraosseous activity from salivary and lacrimal glands to bone voxels caused the only systematic misclassification of bone tissue near these areas (i.e., false-positive findings). However, the relative amount of misclassified tissue was small in comparison to the total bone volume and was well below 1% for SUVTs of 3 and above. If the software tool were to be applied in a clinical setting, the average percentage of misclassified voxels would have to be considered. One possible method of error correction might be to decrease the determined volume by the expected relative misclassified volume for the respective Hounsfield and SUV parameters.
No statistically significant influence of initial HUT was found in an ANOVA comparing automatically extracted SUVmean in PET-positive tissue. This effect is understandable, because final delineation of lesions is dominated by SUVT. Only lesions located at the border of bone tissue having a low x-ray density would be excluded by a low HUT. Since the cortical lamina of the bone usually has higher x-ray densities than the bone marrow (33), and typical bone metastases of prostate cancer tend to be sclerotic, the probability of falsely excluding voxels belonging to a metastasis because of too-low Hounsfield values is small. In turn, it is feasible to set a rather low HUT to take into account the possibly reduced x-ray densities of the typically elderly patients, possibly also with osteoporosis (34), and to ensure that bone voxels are not artificially excluded from the analysis.
The CT datasets used in this validation were all low-dose CT scans acquired immediately before the PET acquisition without use of an intravenous contrast agent. Because Hounsfield unit density influences SUV via attenuation correction, EBONI SUVT might have to be adjusted when CT contrast agent is used. We do not expect a strong influence on bone tissue classification, because the Hounsfield unit densities of blood vessels in a venous contrast agent phase are typically well below the threshold we used here.
Lesions with intense tracer uptake might lead to errors in estimations of the total affected bone volume, because the area of tracer uptake might exceed the true anatomic borders of the lesion, causing overestimation of the affected bone volume. On the other hand, other than visual rating, the bone-limited approach of EBONI would at least lead to the exclusion of extraosseous spillover. Consequently, although such effects cannot be completely eliminated with our tool, we believe that the standardized approach presented here would probably average out some of the corresponding fluctuations and still be less susceptible to this source of error than visual rating.
SUVmax did not alter when the SUVT was changed, as is easily explained by the fact that the hottest lesion is naturally included in every analysis. On the other hand, we observed an increase in correlation strength between automatically extracted and visually determined SUVmean with higher SUVTs. This phenomenon is driven by the fact that the lesions included in the visual rating were picked as being among the 5 visually hottest in the whole scan, in accordance with PERCIST (32). This circumstance also causes the numeric difference between visually extracted and automatically determined SUVmean. Because no lesions with lower SUVs were picked in the visual analysis, their average SUVmean naturally is higher than the average SUVmean derived by an algorithm that will include any above-threshold voxel in its analysis.
Concordance between visual and automated lesion counts was best for the rather low SUVTs (Fig. 3D), because only in this way can lesions with a low signal be considered by the algorithm. This finding comes with a caveat, as low SUVTs cause higher probabilities of tissue misclassification due to spillover from regions with high PET signal near bone tissue, such as the lacrimal glands.
In addition to providing more standardized and fully reproducible information on number of metastases, for example, as compared with visual assessment, EBONI allows the visual assessment to be complemented by several additional quantitative output parameters on the extent of disease. These values may potentially become established as novel measures for a more standardized and accurate quantification of bone disease, for example, for staging and therapy monitoring.
Automated software has been developed for quantifying the total skeletal tumor burden in planar scintigraphy (18,35), and a study recently proved that software-based determination of the bone-scan index improves the assessment of disease progression in patients with metastatic prostate cancer (16). Automated analysis of PSMA PET/CT with the software we present here also provides additional valuable information about the individual bone metastasis load in patients with metastatic prostate cancer. The diagnostic and prognostic value of the parameters derived from automated analysis need to be validated in larger cohorts and in a longitudinal setup.
The algorithmic design of this software is not limited to the analysis of PSMA PET/CT but can also analyze other molecular radiotracers specific for different tumor entities. Furthermore, an automated assessment of bone marrow activation in 18F-FDG PET could also be performed with only slight modifications to the code. Additionally, because the software should also be able to load SPECT/CT datasets, automated interpretation and scoring of 3-dimensional scans with 99mTc-labeled bisphosphonates might also be a future application. The application of machine-learning algorithms might also improve the quality of tissue classification in a future version of the software.
This study had some limitations. Some of the typical problems in visual assessment of PSMA-positive bone lesions also affect automated analysis by the software tool. In a clinical setting, it is sometimes unclear whether a PET-positive lesion is really caused by a metastasis or is instead due to a different process independent of prostate cancer cells—for example, solitary lesions in the thoracic cage that are unlikely to be bone metastases. Furthermore, to date there is no established standard threshold for the definition of a PET-positive lesion in PSMA PET/CT. In addition, EBONI cannot detect metastases with no or low PSMA expression, which can occur in some cases, such as after radiotherapy or as a consequence of dedifferentiation of tumor cells. In the case of hypersclerotic metastases with rather low tracer uptake, a future version of EBONI could include a function to dynamically adjust the SUVT for every voxel depending on its Hounsfield unit density. Moreover, visual rating, even by expert readers, may not represent a 100% reliable gold standard for the evaluation of a software tool. Human raters may even show performance inferior to an automated approach, and the malignancy of a lesion cannot be determined without biopsy (which is not feasible for multiple lesions). Also, to standardize visual rating, PERCIST were applied in this study, however, PERCIST have not yet been validated for PSMA PET/CT.
Lesion quantity is a marker that comes with a caveat. In longitudinal approaches to evaluating disease progression or response to a therapy, a possible increase in lesion load might be masked if only lesion number is used as the parameter. Growing confluent lesions might lead to a decrease in lesion number while the actual affected bone volume increases. This effect is demonstrated in Figure 2: although the patient shown in part D had a higher bone metastasis load than the patient in part C, the number of lesions was lower in the former. Therefore, lesion quantity should always be interpreted together with other parameters.
We believe that these limitations do not fundamentally question the demonstrated value and functionality of EBONI. The software can easily be adjusted regarding novel insights and the predefined settings (e.g., on SUVTs of bone metastases and HUT), and the limitations do not affect the salient advantages of the automated procedure, such as standardization and reproducibility.
CONCLUSION
Automated bone scoring with EBONI produces robust results that correlate strongly with visual rating, are 100% reproducible, eliminate interrater variability, and add new statistical measures for quantifying the extent of bone disease. The tool provides highly standardized, observer-independent, reproducible information that may be valuable for the interpretation of PSMA PET/CT scans, such as for staging and therapy monitoring. Because of its graphical user interface and platform independence, it is easy to implement as an add-on to the visual analysis of PSMA PET/CT scans and has the potential to distinctly reduce turnaround time.
DISCLOSURE
Alexander Drzezga received consulting and speaker honoraria and research support from Siemens Healthcare, AVID Radiopharmaceuticals, Lilly, Piramal, and GE Healthcare. No other potential conflict of interest relevant to this article was reported.
Footnotes
Published online Dec. 14, 2017.
- © 2018 by the Society of Nuclear Medicine and Molecular Imaging.
REFERENCES
- Received for publication October 5, 2017.
- Accepted for publication November 23, 2017.


Jump to section
Related Articles
Cited By...
- PSMA PET/CT and Therapy Response Evaluation in Metastatic Prostate Cancer: Is It Time to Surpass the Old Way?
- PSMA PET/CT and Therapy Response Evaluation in Metastatic Prostate Cancer: Is It Time to Surpass the Old Way?
- Novel Framework for Treatment Response Evaluation Using PSMA PET/CT in Patients with Metastatic Castration-Resistant Prostate Cancer (RECIP 1.0): An International Multicenter Study
- The VISION Forward: Recognition and Implication of PSMA-/18F-FDG+ mCRPC
- Semiautomatically Quantified Tumor Volume Using 68Ga-PSMA-11 PET as a Biomarker for Survival in Patients with Advanced Prostate Cancer
- qPSMA: Semiautomatic Software for Whole-Body Tumor Burden Assessment in Prostate Cancer Using 68Ga-PSMA11 PET/CT