
Main menu

  • Home
  • Content
    • Current
    • Ahead of print
    • Past Issues
    • JNM Supplement
    • SNMMI Annual Meeting Abstracts
    • Continuing Education
    • JNM Podcasts
  • Subscriptions
    • Subscribers
    • Institutional and Non-member
    • Rates
    • Journal Claims
    • Corporate & Special Sales
  • Authors
    • Submit to JNM
    • Information for Authors
    • Assignment of Copyright
    • AQARA requirements
  • Info
    • Reviewers
    • Permissions
    • Advertisers
  • About
    • About Us
    • Editorial Board
    • Contact Information
  • More
    • Alerts
    • Feedback
    • Help
    • SNMMI Journals
  • SNMMI
    • JNM
    • JNMT
    • SNMMI Journals
    • SNMMI

User menu

  • Subscribe
  • My alerts
  • Log in
  • Log out
  • My Cart

Search

  • Advanced search
Journal of Nuclear Medicine
  • SNMMI
    • JNM
    • JNMT
    • SNMMI Journals
    • SNMMI
  • Subscribe
  • My alerts
  • Log in
  • Log out
  • My Cart
Journal of Nuclear Medicine

Advanced Search

  • Home
  • Content
    • Current
    • Ahead of print
    • Past Issues
    • JNM Supplement
    • SNMMI Annual Meeting Abstracts
    • Continuing Education
    • JNM Podcasts
  • Subscriptions
    • Subscribers
    • Institutional and Non-member
    • Rates
    • Journal Claims
    • Corporate & Special Sales
  • Authors
    • Submit to JNM
    • Information for Authors
    • Assignment of Copyright
    • AQARA requirements
  • Info
    • Reviewers
    • Permissions
    • Advertisers
  • About
    • About Us
    • Editorial Board
    • Contact Information
  • More
    • Alerts
    • Feedback
    • Help
    • SNMMI Journals
  • View or Listen to JNM Podcast
  • Visit JNM on Facebook
  • Join JNM on LinkedIn
  • Follow JNM on Twitter
  • Subscribe to our RSS feeds
Research ArticleNeurology

Spatiotemporal Distribution of β-Amyloid in Alzheimer Disease Is the Result of Heterogeneous Regional Carrying Capacities

Alex Whittington, David J. Sharp and Roger N. Gunn; for the Alzheimer’s Disease Neuroimaging Initiative
Journal of Nuclear Medicine May 2018, 59 (5) 822-827; DOI: https://doi.org/10.2967/jnumed.117.194720
Alex Whittington
1Division of Brain Sciences, Imperial College London, Hammersmith Hospital Campus, London, United Kingdom
  • Find this author on Google Scholar
  • Find this author on PubMed
  • Search for this author on this site
David J. Sharp
1Division of Brain Sciences, Imperial College London, Hammersmith Hospital Campus, London, United Kingdom
  • Find this author on Google Scholar
  • Find this author on PubMed
  • Search for this author on this site
Roger N. Gunn
1Division of Brain Sciences, Imperial College London, Hammersmith Hospital Campus, London, United Kingdom
2Imanova Ltd., London, United Kingdom; and
3Department of Engineering Science, Institute of Biomedical Engineering, University of Oxford, Oxford, United Kingdom
  • Find this author on Google Scholar
  • Find this author on PubMed
  • Search for this author on this site
  • Article
  • Figures & Data
  • Supplemental
  • Info & Metrics
  • PDF
Loading

Article Figures & Data

Figures

  • Tables
  • Additional Files
  • FIGURE 1.
    • Download figure
    • Open in new tab
    • Download powerpoint
    FIGURE 1.

    Logistic growth model describing Aβ PET imaging signal over time as function of PET NS, K, T50, and r.
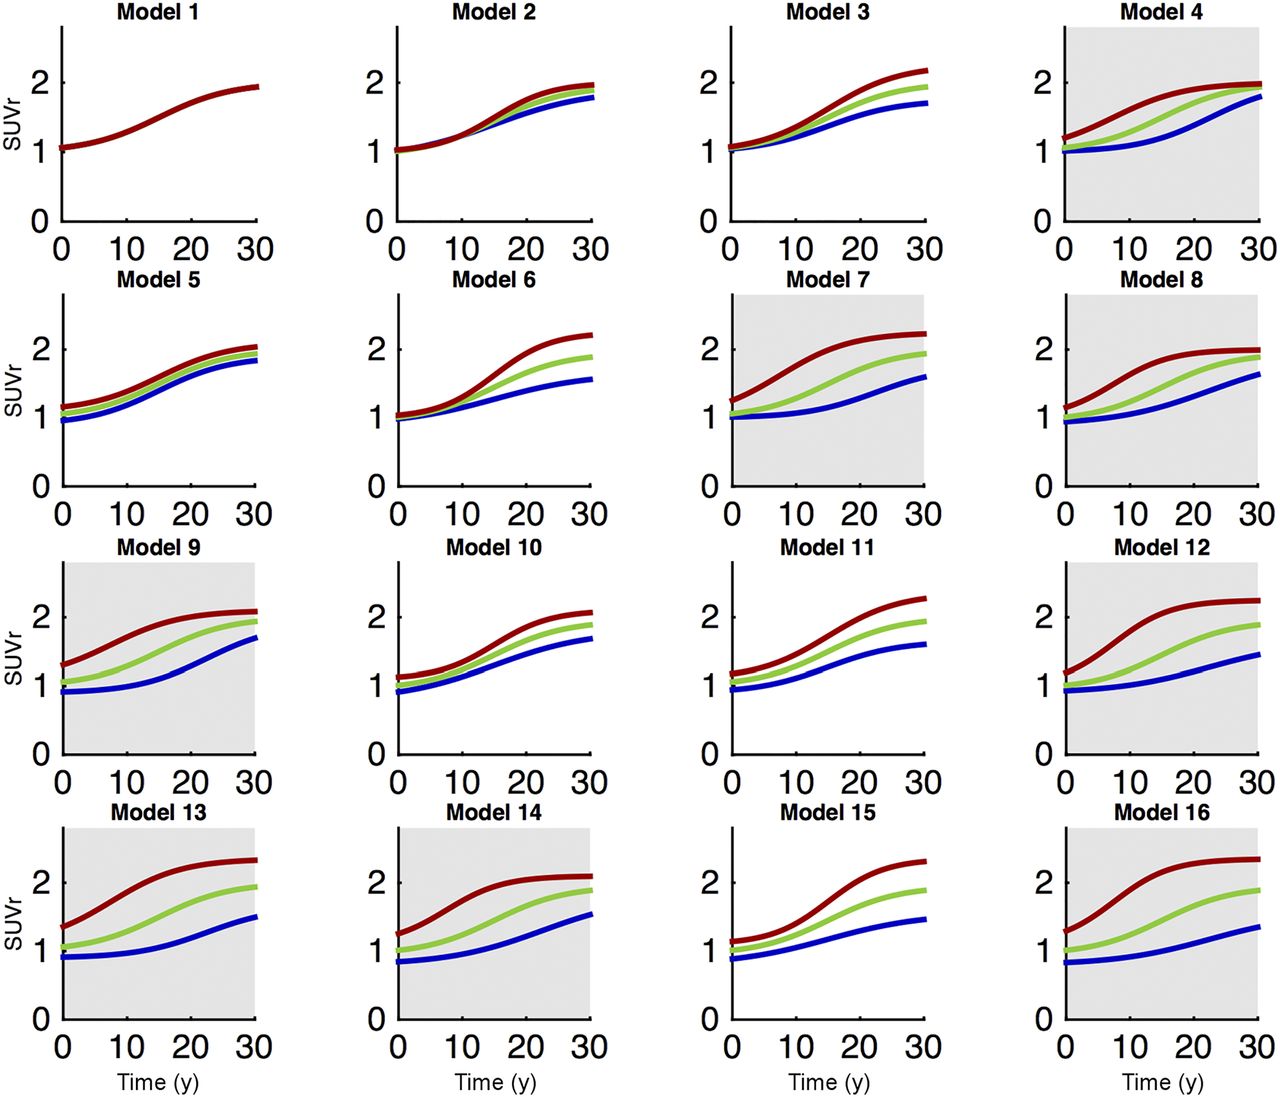
  • FIGURE 2.
    • Download figure
    • Open in new tab
    • Download powerpoint
    FIGURE 2.

    Sixteen logistic growth models of Aβ accumulation with example curves from 3 distinct brain regions. Models in gray have regionally different T50s and are consistent with spreading from seed regions, whereas models in white are consistent with local tissue properties driving Aβ accumulation process.

  • FIGURE 3.
    • Download figure
    • Open in new tab
    • Download powerpoint
    FIGURE 3.

    Model fitting of most parsimonious logistic growth model (model 11) to chronological 18F-AV-45 Aβ PET data in 9 regions. Model accurately describes data for regions of high (top row), medium (middle row), and low (bottom row) accumulation. A = anterior; D = dorsal; inf = inferior.
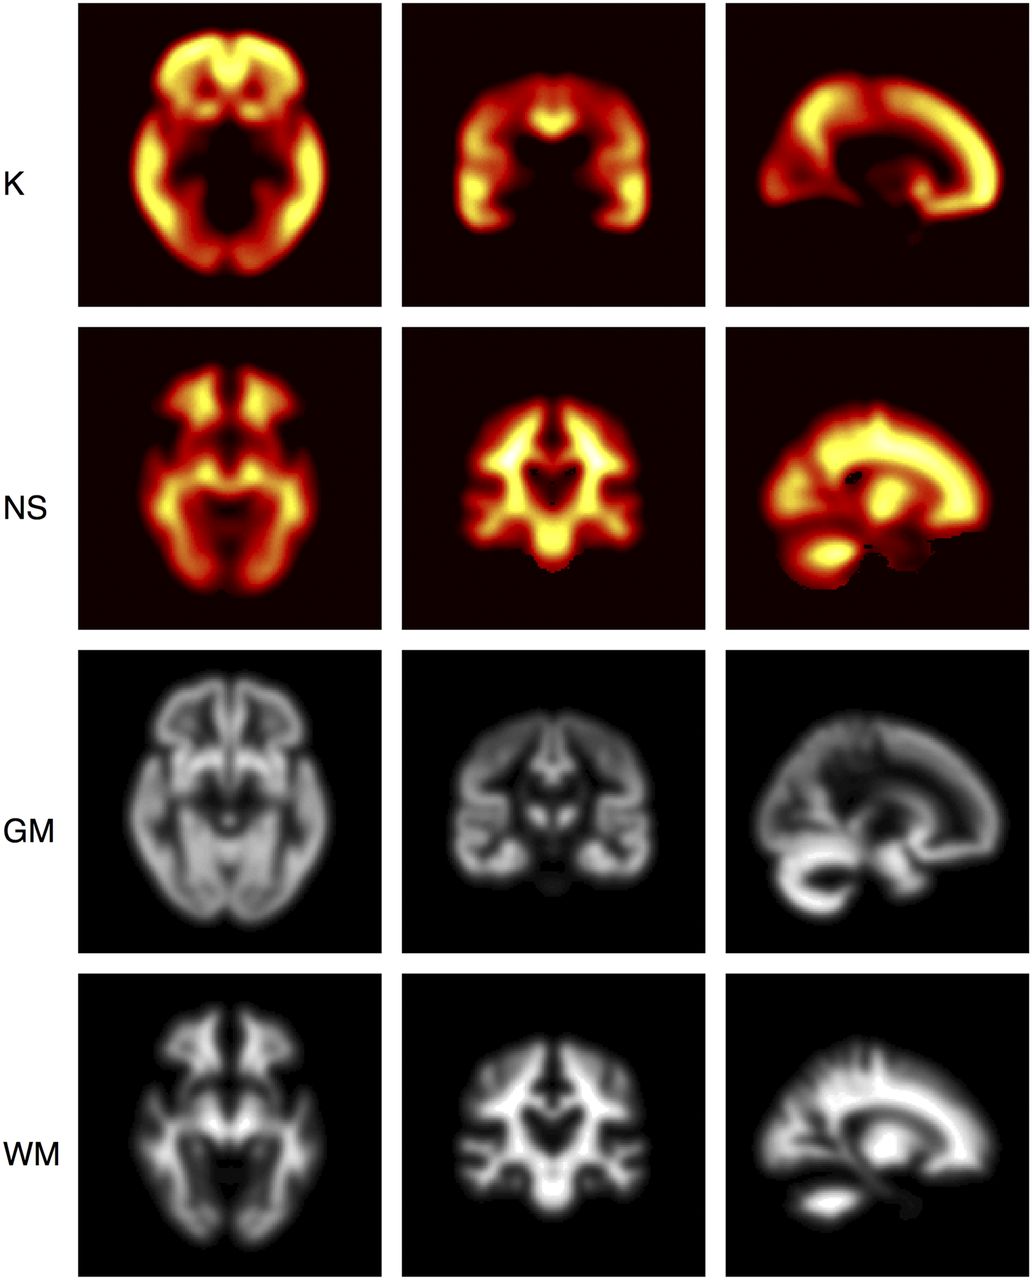
  • FIGURE 4.
    • Download figure
    • Open in new tab
    • Download powerpoint
    FIGURE 4.

    Parametric images displayed as orthographic projections for K and NS obtained from fitting model 11 at voxel level. Gray matter (GM) and white matter (WM) probability maps are displayed for reference. Highest carrying capacities were in frontal lobe, and lowest were in cerebellum, occipital lobe, and brain stem. NS image is consistent with known NS of 18F-AV-45 to white matter.

Tables

  • Figures
  • Additional Files
    • View popup
    TABLE 1

    Subject Characteristics

    CharacteristicJack et al. (26)ADNI
    Number260769
    Median age (y)79 (range, 70–94)73 (range, 55–91)
    Male patients (n)162 (62%)438 (57%)
    MCI/AD patients (n)55 (21%)558 (73%)
    APOE*E4–positive patients (n)87 (33%)342 (44%)
    Median MMSE score28 (range, 23–30)28 (range, 19–30)
    • MCI = mild cognitive impairment; MMSE = Mini Mental State Examination.

    • Data from Jack et al. were combined with data from ADNI to create cross-sectional dataset.

    • View popup
    TABLE 2

    Sixteen Parameterizations of Logistic Growth Model of Aβ Accumulation Used to Analyze Chronological 18F-AV-45 SUVr PET Data at Regional Level

    ModelK (SUVr)r (y−1)T50 (y)NSParametersSSQΔBICi
    1GlobalGlobalGlobalGlobal43,073.781,500
    2GlobalLocalGlobalGlobal932,273.761,600
    3LocalGlobalGlobalGlobal931,324.024,200
    4GlobalGlobalLocalGlobal931,245.719,900
    5GlobalGlobalGlobalLocal931,147.214,200
    6LocalLocalGlobalGlobal1821,131.414,300
    7LocalGlobalLocalGlobal1821,079.311,000
    8GlobalLocalLocalGlobal1821,070.210,400
    9GlobalGlobalLocalLocal1821,002.65,910
    10GlobalLocalGlobalLocal182977.04,120
    11LocalGlobalGlobalLocal182920.60
    12LocalLocalLocalGlobal2711,046.99,890
    13LocalGlobalLocalLocal271918.9865
    14GlobalLocalLocalLocal271918.8861
    15LocalLocalGlobalLocal271911.0267
    16LocalLocalLocalLocal360908.71,090
    • SSQ = sum of squared residuals; ΔBICi = difference in BIC between model 11 and all other models.

    • Ninety cortical and subcortical regions were included, and parameters were either restricted to single value across all regions (global) or fitted individually for each region (local). ΔBIC gives measure of parsimony of each model in relation to smallest BIC value. Model 11 (local K, global r, global T50 and local NS) gives most parsimonious fit to data.

Additional Files

  • Figures
  • Tables
  • Supplemental Data

    Files in this Data Supplement:

    • Supplemental Data
PreviousNext
Back to top

In this issue

Journal of Nuclear Medicine: 59 (5)
Journal of Nuclear Medicine
Vol. 59, Issue 5
May 1, 2018
  • Table of Contents
  • Table of Contents (PDF)
  • About the Cover
  • Index by author
Print
Download PDF
Article Alerts
Sign In to Email Alerts with your Email Address
Email Article

Thank you for your interest in spreading the word on Journal of Nuclear Medicine.

NOTE: We only request your email address so that the person you are recommending the page to knows that you wanted them to see it, and that it is not junk mail. We do not capture any email address.

Enter multiple addresses on separate lines or separate them with commas.
Spatiotemporal Distribution of β-Amyloid in Alzheimer Disease Is the Result of Heterogeneous Regional Carrying Capacities
(Your Name) has sent you a message from Journal of Nuclear Medicine
(Your Name) thought you would like to see the Journal of Nuclear Medicine web site.
Citation Tools
Spatiotemporal Distribution of β-Amyloid in Alzheimer Disease Is the Result of Heterogeneous Regional Carrying Capacities
Alex Whittington, David J. Sharp, Roger N. Gunn
Journal of Nuclear Medicine May 2018, 59 (5) 822-827; DOI: 10.2967/jnumed.117.194720

Citation Manager Formats

  • BibTeX
  • Bookends
  • EasyBib
  • EndNote (tagged)
  • EndNote 8 (xml)
  • Medlars
  • Mendeley
  • Papers
  • RefWorks Tagged
  • Ref Manager
  • RIS
  • Zotero
Share
Spatiotemporal Distribution of β-Amyloid in Alzheimer Disease Is the Result of Heterogeneous Regional Carrying Capacities
Alex Whittington, David J. Sharp, Roger N. Gunn
Journal of Nuclear Medicine May 2018, 59 (5) 822-827; DOI: 10.2967/jnumed.117.194720
Twitter logo Facebook logo LinkedIn logo Mendeley logo
  • Tweet Widget
  • Facebook Like
  • Google Plus One
Bookmark this article

Jump to section

  • Article
    • Abstract
    • MATERIALS AND METHODS
    • RESULTS
    • DISCUSSION
    • CONCLUSION
    • DISCLOSURE
    • Acknowledgments
    • Footnotes
    • REFERENCES
  • Figures & Data
  • Supplemental
  • Info & Metrics
  • PDF

Related Articles

  • This Month in JNM
  • PubMed
  • Google Scholar

Cited By...

  • Two for tau: Automated model discovery reveals two-stage tau aggregation dynamics in Alzheimers disease
  • Passive Immunotherapies Targeting Amyloid-{beta} in Alzheimers Disease: A Quantitative Systems Pharmacology Perspective
  • Personalised Regional Modelling Predicts Tau Progression in the Human Brain
  • Manipulation of neuronal activity in the entorhinal-hippocampal circuit affects intraneuronal amyloid-{beta} levels
  • Multi-method investigation of factors influencing amyloid onset and impairment in three cohorts
  • TauIQ: A Canonical Image Based Algorithm to Quantify Tau PET Scans
  • Derivation and utility of an A{beta}-PET pathology accumulation index to estimate A{beta} load
  • Amplification, not spreading limits rate of tau aggregate accumulation in Alzheimers disease
  • Detecting earlier stages of amyloid deposition using PET in cognitively normal elderly adults
  • Amyloid duration is associated with preclinical cognitive decline and tau PET
  • Amyloid Load: A More Sensitive Biomarker for Amyloid Imaging
  • Google Scholar

More in this TOC Section

Neurology

  • Dopamine D1 Receptor Agonist PET Tracer Development: Assessment in Nonhuman Primates
  • Hypermetabolism on Pediatric PET Scans of Brain Glucose Metabolism: What Does It Signify?
  • TauIQ: A Canonical Image Based Algorithm to Quantify Tau PET Scans
Show more Neurology

Clinical

  • Dopamine D1 Receptor Agonist PET Tracer Development: Assessment in Nonhuman Primates
  • Hypermetabolism on Pediatric PET Scans of Brain Glucose Metabolism: What Does It Signify?
  • TauIQ: A Canonical Image Based Algorithm to Quantify Tau PET Scans
Show more Clinical

Similar Articles

Keywords

  • Image Processing
  • PET/CT
  • β-amyloid
  • Alzheimer disease
  • mathematical modeling
  • neuroimaging
SNMMI

© 2025 SNMMI

Powered by HighWire