


Abstract
Recent studies have reported the usefulness of 18F-FDG PET in aiding with the diagnosis and management of patients with cardiac sarcoidosis (CS). However, image interpretation of 18F-FDG PET for CS is sometimes challenging. We sought to investigate the inter- and intraobserver agreement and explore factors that led to important discrepancies between readers. Methods: We studied consecutive patients with no significant coronary artery disease who were referred for assessment of CS. Two experienced readers masked to clinical information, imaging reports, independently reviewed 18F-FDG PET/CT images. 18F-FDG PET/CT images were interpreted according to a predefined standard operating procedure, with cardiac 18F-FDG uptake patterns categorized into 5 patterns: none, focal, focal on diffuse, diffuse, and isolated lateral wall or basal uptake. Overall image assessment was classified as either consistent with active CS or not. Results: One hundred scans were included from 71 patients. Of these, 46 underwent 18F-FDG PET/CT with a no-restriction diet (no-restriction group), and 54 underwent 18F-FDG PET/CT with a low-carbohydrate, high-fat and protein-permitted diet (low-carb group). There was agreement of the interpretation category in 74 of 100 scans. The κ-value of agreement among all 5 categories was 0.64, indicating moderate agreement. For overall clinical interpretation, there was agreement in 93 of 100 scans (κ = 0.85). When scans were divided into the preparation groups, there was a trend toward higher agreement in the low-carb group versus the no-restriction group (80% vs. 67%, P = 0.08). Regarding the overall clinical interpretation, there was also a trend toward greater agreement in the low-carb group versus the no-restriction group (96% vs. 89%, P = 0.08). Conclusion: The interobserver agreement of cardiac 18F-FDG uptake image patterns was moderate. However, agreement was better regarding overall interpretation of CS. Detailed prescan dietary preparation seemed to improve interobserver agreement.
Sarcoidosis is a systemic inflammatory disease that is characterized by noncaseating granulomas of unknown etiology. Many organs and tissues including lymph nodes, lungs, eyes, skin, liver, and heart can be involved. Cardiac involvement can be associated with life-threatening complications; however, cardiac sarcoidosis (CS) has been underdiagnosed in the past, in part due to a lack of imaging modalities with high sensitivity (1,2). Recent studies have reported the usefulness of 18F-FDG PET in the diagnosis and management of CS (3–7). However, the image interpretation of 18F-FDG PET for CS is often challenging because of many factors including variable myocardial uptake of 18F-FDG in patients without CS and the importance of patient dietary preparation (8–10).
The aims of the current study were to investigate the inter- and intraobserver agreement and to explore factors that lead to important discrepancies between readers.
MATERIALS AND METHODS
Study Population
We included consecutive patients who underwent 18F-FDG PET/CT for the evaluation of suspected CS. All patients presented to the University of Ottawa Heart Institute (UOHI), Canada, from August 2009 to April 2014. The modified Japanese Ministry of Health and Welfare criteria were used as the standard for the diagnosis of CS as with previous studies (11–13). Clinical history and available results of other imaging studies including transthoracic echocardiography, high-resolution chest CT, cardiac MRI, and histopathology results were collected.
The study was approved by the UOHI Institutional Research Ethics Board, and patients signed an informed consent form for inclusion in prospective registries of patients undergoing workup for CS.
Study Protocol
Patient Preparation
All patients were instructed to fast for at least 12 h to minimize physiologic 18F-FDG uptake in the heart. For further suppression of the background 18F-FDG uptake, low-dose unfractionated heparin was intravenously injected before 18F-FDG administration in patients without contraindication (5,7,11,14). In addition, from July 2012, all patients were prescribed a low-carbohydrate, high-fat and protein-permitted diet. Hence, before the first 46 scans patients underwent 18F-FDG PET/CT with a no-restriction diet, and for the subsequent 54 scans patients underwent 18F-FDG PET/CT with a low-carbohydrate, high-fat, and protein-permitted diet.
Imaging Protocol
Imaging was performed in the following order: cardiac rest perfusion scanning, whole-body 18F-FDG scanning, and cardiac 18F-FDG scanning.
18F-FDG PET Imaging
Intravenous injection of 18F-FDG (5 MBq/kg) was followed by an uptake phase of 60 min followed by a CT scan from the femoral region to the head for attenuation correction. This was followed by a whole-body 18F-FDG PET acquisition of the same extent. Subsequently at approximately 90 min after 18F-FDG injection, a 20-min electrocardiography-gated cardiac scan was obtained. A Discovery 690 or 600 combined PET/CT scanner (GE Healthcare) was used for all patients. The detailed protocol has been previously described (11,15).
18F-FDG PET/CT Image Interpretation
18F-FDG PET/CT images were interpreted according to a standard operating procedure developed at UOHI (supplemental materials, available at http://jnm.snmjournals.org). Cardiac 18F-FDG uptake was categorized into 5 patterns: none, focal, focal on diffuse, diffuse, and isolated lateral wall or basal uptake. Among these, patterns 1, 4, and 5 were considered as not consistent with active CS (because these patterns are observed in healthy subjects (16–18)). Regions of interest were drawn in the left-ventricular myocardium to determine the SUVmax, and in the right lobe of the liver to obtain the SUVmean. Any patient with pattern 2 or 3 but with myocardial SUVmax less than liver SUVmean were considered not consistent with active CS (16–18). Otherwise patterns 2 and 3, that is, focal or focal on diffuse pattern, were considered as positive findings consistent with active CS. Representative 18F-FDG PET/CT images for positive and negative scans are shown in Figures 1 and 2, respectively.

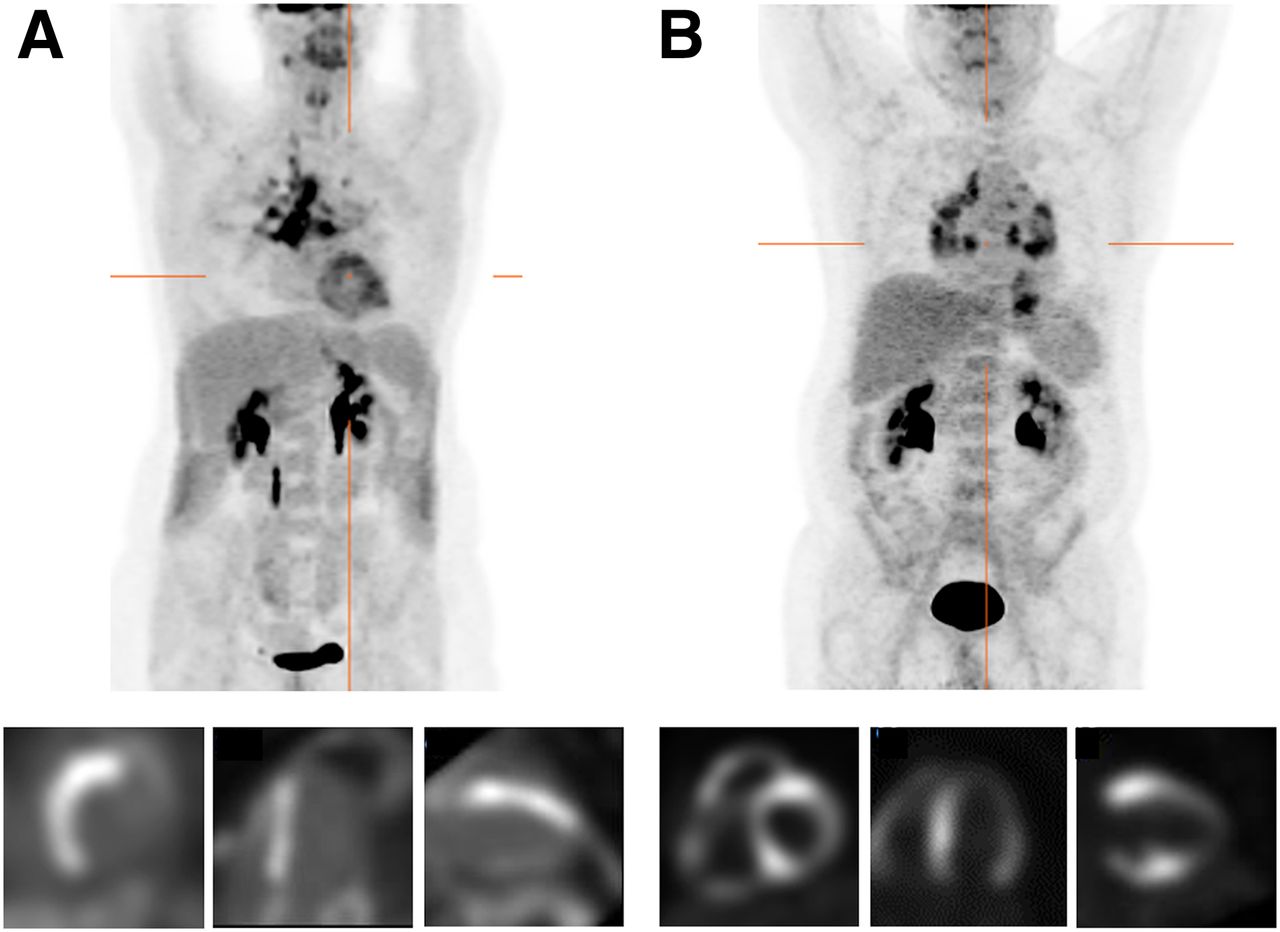
Patterns of 18F-FDG PET consistent with active CS. (A) Maximum-intensity projection shows 18F-FDG uptake in hilar and mediastinal lymph nodes and myocardium (top), and cardiac 18F-FDG PET shows focal 18F-FDG uptake in the basal to apical segments of the septum of left ventricle, which is consistent with focal pattern (bottom). (B) Maximum-intensity projection demonstrates 18F-FDG uptake in hilar, mediastinal, and abdominal lymph nodes and myocardial 18F-FDG uptake (top), and cardiac 18F-FDG PET shows focal uptake in right ventricle and basal segments of anteroseptal and inferoseptal walls, which is consistent with focal on diffuse pattern (bottom).

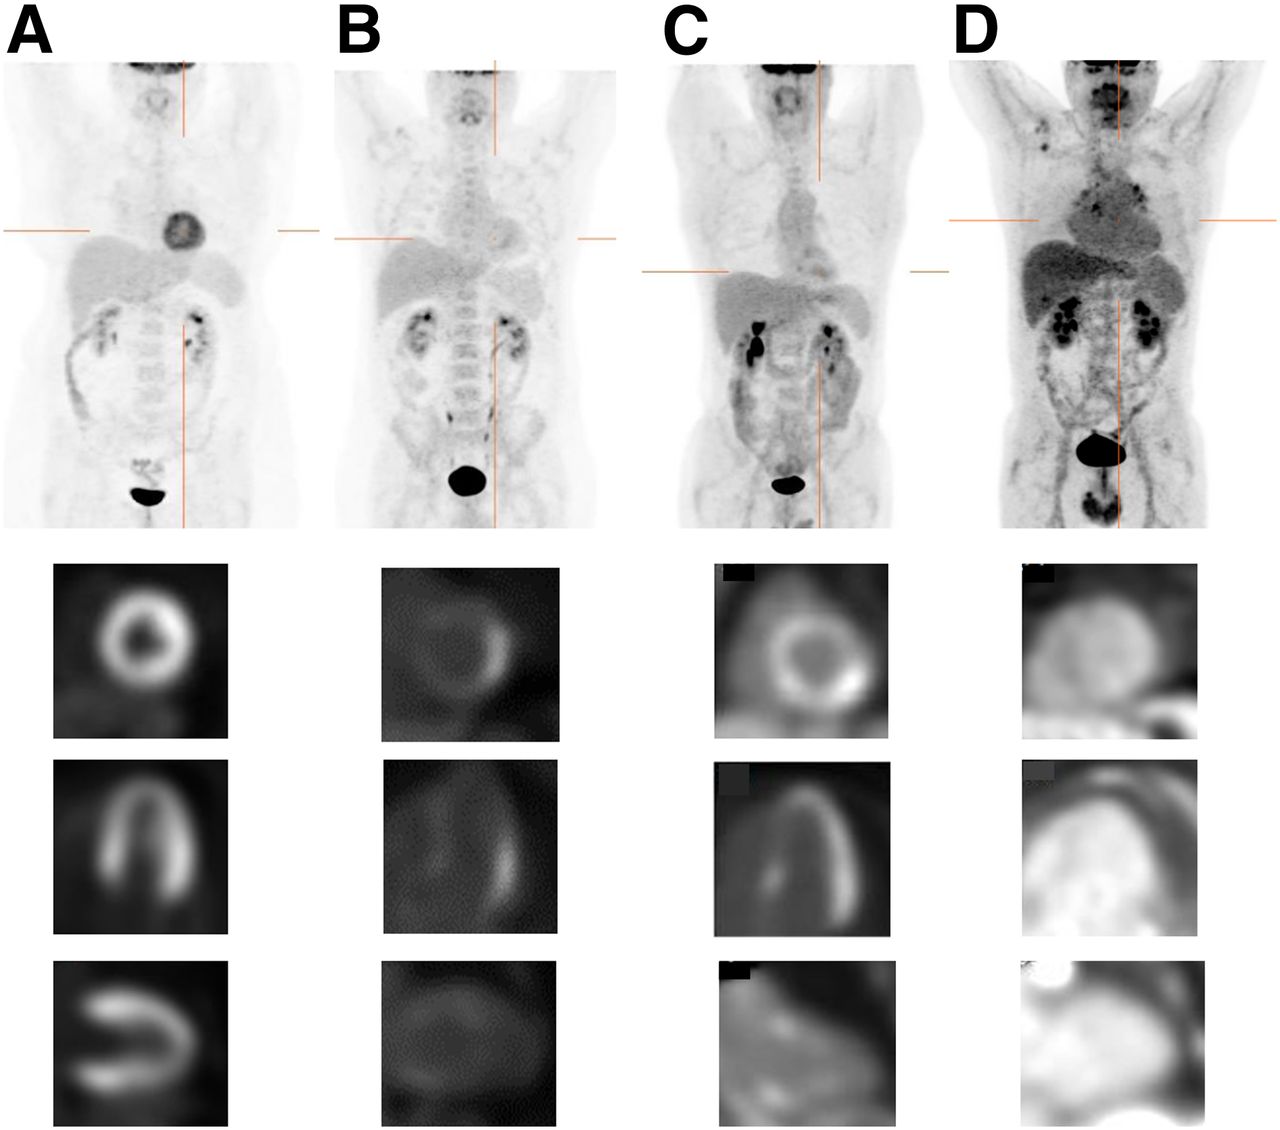
Four patterns of 18F-FDG PET uptake not consistent with active CS. Top images are maximum-intensity projection, and bottom images are cardiac 18F-FDG PET. (A) There is no 18F-FDG uptake indicating extracardiac sarcoidosis in maximum-intensity projection (top). There is diffuse myocardial 18F-FDG uptake in left ventricle (diffuse pattern) (bottom). (B) No extracardiac 18F-FDG uptake is present except for physiologic uptake in palate and urinary tract (top). Myocardial 18F-FDG uptake is seen in the lateral wall of left ventricle assigned isolated lateral pattern (bottom). (C) No extracardiac 18F-FDG uptake indicating extracardiac sarcoidosis (top). Myocardial 18F-FDG uptake is seen in basal septum and lateral wall assigned isolated lateral and basal pattern (bottom). (D) There is 18F-FDG uptake in hilar, mediastinal, and axillary lymph nodes, which is consistent with extracardiac sarcoidosis (top). There is no myocardial 18F-FDG uptake (none pattern). 18F-FDG activity is observed as blood pool.
Two readers experienced in imaging of CS, masked to clinical information, imaging reports, and the other reader’s interpretation, independently reviewed 18F-FDG PET/CT images. Also the reviewers were masked to patient treatment and also whether the patients had undergone previous scans.
A third experienced reader, also masked to clinical information and image interpretations, was included to resolve any differences in interpretation by the 2 primary readers, by consensus review. A difference in pattern definition between the 3 observers was settled by consensus.
We assessed the influence of dietary preparation on interobserver agreement. We also examined the influence of myocardial perfusion on interobserver agreement. For this analysis, we stratified the population into groups with normal or abnormal myocardial perfusion (defined as summed rest score > 3). We assessed the presence of extracardiac 18F-FDG uptake and overall image interpretation of cardiac 18F-FDG PET/CT (as agreed by consensus of the 3 readers). Finally, 1 read 25 scans, randomly selected, to measure intraoperator variability. The reread was performed more than 6 mo after initial read and was masked to initial interpretation.
Statistical Analysis
Descriptive statistics are presented as the number, with percentage, for categoric variables and mean ± SD for continuous variables. κ-statistics were calculated for interobserver agreement of 18F-FDG PET/CT image interpretation. The Fisher exact probability test was used to compare the interpretation of 18F-FDG PET/CT images between those with and without the presence of extra-CS. For all analyses, a P value of less than 0.05 was considered statistically significant. All analyses were performed using SAS software (version 9.3; SAS Institute).
RESULTS
Baseline Demographics
The patient characteristics and indications for PET scans are shown in Table 1. Nineteen patients underwent more than 1 scan (total of 46 scans with a range of 2–4 and median of 2 scans each). The indications for repeated scans were to assess response to therapy in 15 patients and to clarify diagnosis in 4 patients. Of 34 patients investigated for cardiac involvement, with biopsy-proven extra-CS, PET suggested active CS in 11 of 34 (32.4%) (Table 1).
Patient Characteristics and Indications for 18F-FDG PET
Interobserver Agreement in Interpretation of 18F-FDG PET/CT
Table 2 shows the interobserver comparison in image pattern interpretations. There was agreement of the interpretation category in 74 of 100 scans. The κ-value of agreement among all 5 categories was 0.64, indicating moderate agreement. Table 3 demonstrates the interobserver comparison with respect to overall clinical interpretation of CS, with agreement in 93 of 100 scans. The κ-value was 0.85, indicating good agreement. When scans were divided into 2 groups—the low-carbohydrate, high-fat, and protein-permitted-diet group (low-carb group) or the no-restriction-diet group (no-restriction group)—κ-values of the 5 categories were 0.67 or 0.60, respectively (P = 0.16). There was a trend toward higher agreement in the low-carb versus the no-restriction group (80% vs 67%, P = 0.08). Regarding the overall clinical interpretation, κ-values were 0.92 and 0.74, respectively (P = 0.16). Again, there was a trend toward higher agreement in the overall interpretation of CS for the low-carb versus the no-restriction group (96% vs 89%, P = 0.08).
Comparison of Readers' Image Pattern Interpretations (κ-Value = 0.64)
Comparison of 2 Readers' Overall Image Interpretation (κ-Value = 0.85)
Influence of Myocardial Perfusion on Interobserver Agreement
We compared groups with normal or abnormal myocardial perfusion (defined as summed rest score > 3). The κ-values of the 5 categories were 0.62 or 0.61, respectively (P = 0.43). Regarding the overall clinical interpretation, κ-values were 0.76 and 0.83, respectively (P = 0.46). There was no difference between the groups, in agreement in the overall interpretation of CS (95% for abnormal myocardial perfusion group vs. 92% for normal perfusion group, P = 0.71).
Characteristics of Patients with Different Overall Imaging Interpretations
There were 7 patients with different overall clinical interpretation between observers (Table 4). In 4 of the 7 patients, the 2 observers disagreed between diffuse or focal on diffuse. In 2 patients, reader 1 read none and reader 2 read focal. Of the remaining, focal on diffuse and isolated lateral and or basal were the patterns with disagreement. The final consensus interpretation is also shown in Table 4. Of these 7 patients, 5 patients had a no-restriction diet and 2 patients had a low-carbohydrate, high-fat, and protein-permitted diet (Table 4). Figure 3 shows images from 2 representative cases.
Seven Patients with Different Clinical Interpretations
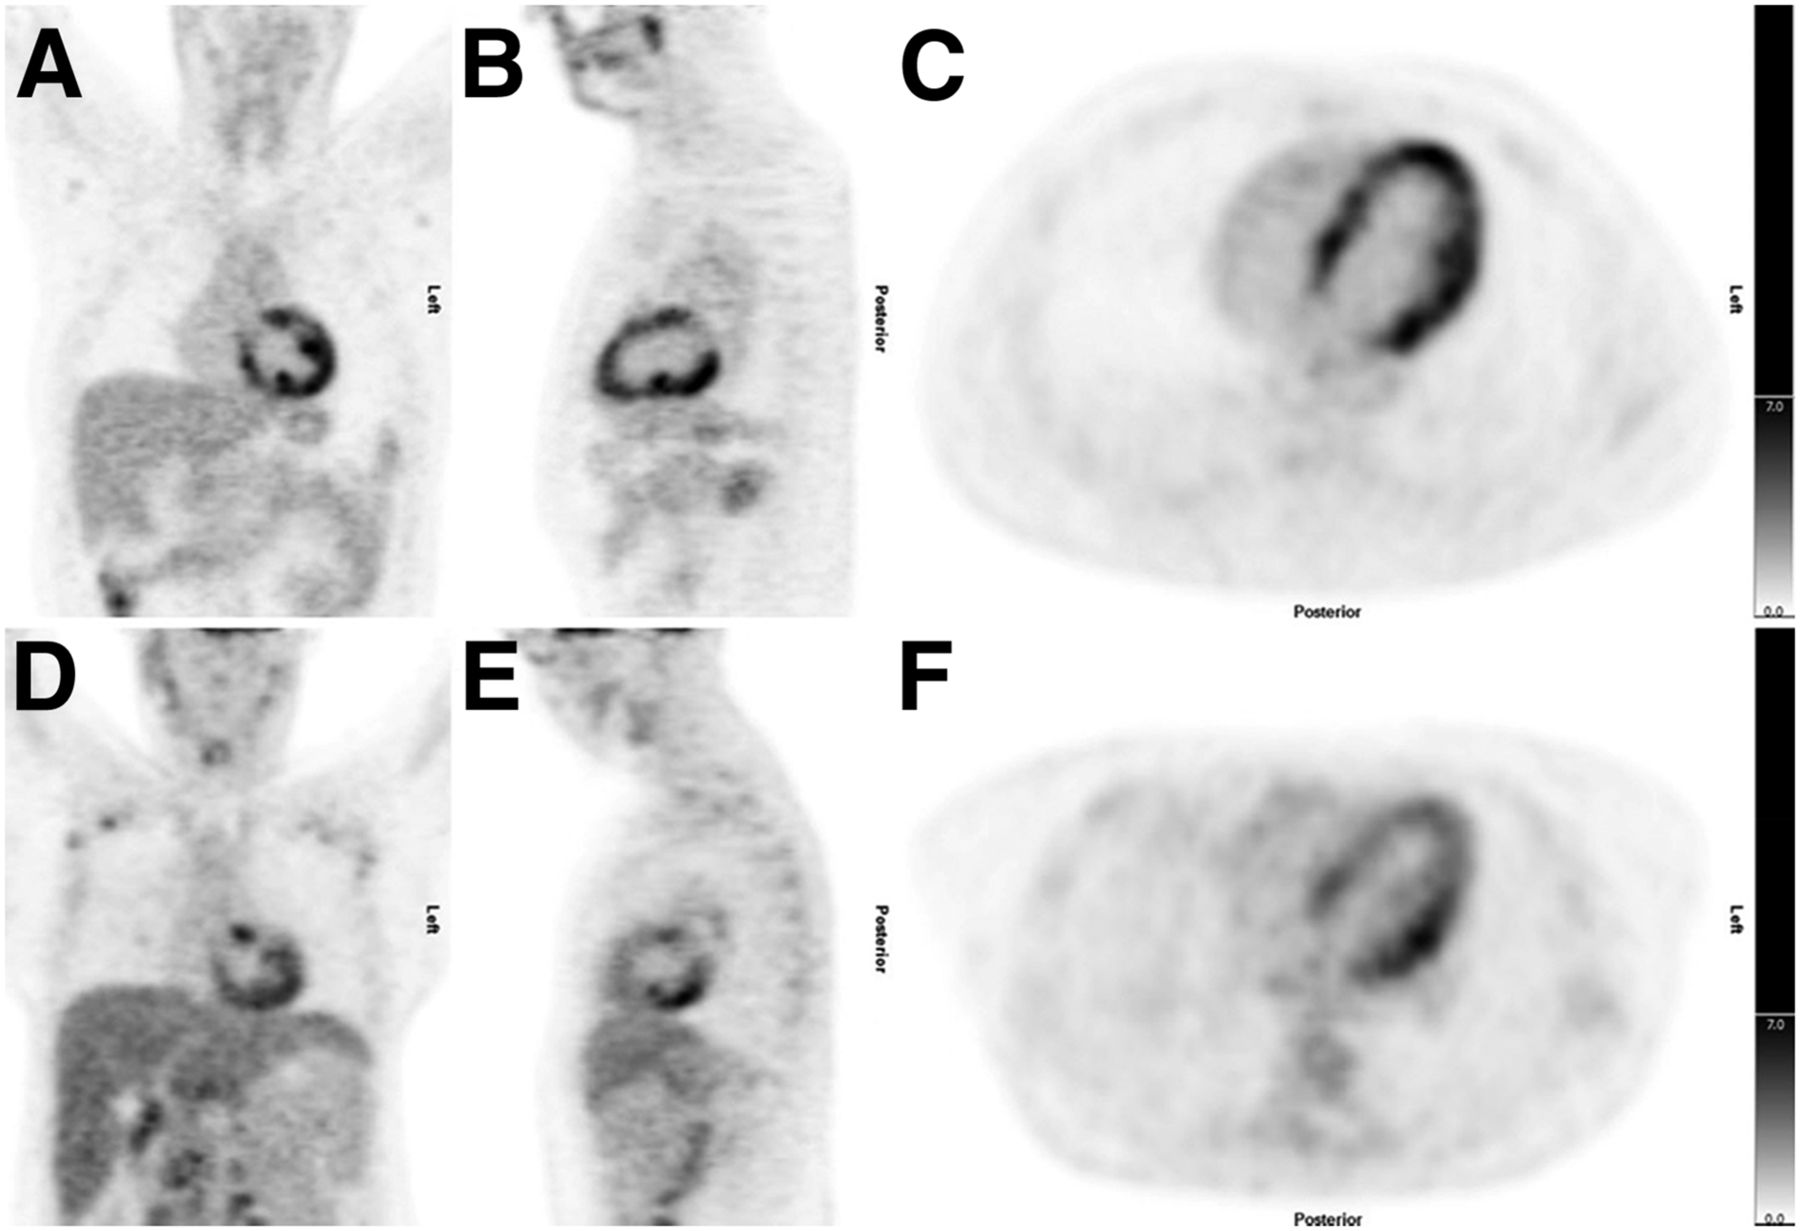
18F-FDG PET images from representative cases in which clinical interpretation between reader 1 and 2 was in disagreement. 18F-FDG PET images in coronal, sagittal, and axial axis, centered on heart, show equivocal patterns of uptake in both patients. Final consensus was that scans were negative for CS. A, B, and C are from patient 4 (Table 4), and D, E, and F are from patient 5 (Table 5).
Presence of Extracardiac 18F-FDG Uptake and Overall Image Interpretation of Cardiac 18F-FDG PET/CT Image
There were 52 scans with extracardiac 18F-FDG uptake. Of these, 32 (61.5%) had positive cardiac scans (consistent with active CS). Of the 48 scans with no extracardiac 18F-FDG uptake, only 2 (4.2%) had cardiac 18F-FDG uptake (consistent with active CS) on 18F-FDG PET/CT. One patient had isolated CS (endomyocardial biopsy proven). The other patient had known extra-CS, and the scan was obtained after a period of steroid treatment. In the whole cohort of 71 patients, 34 of 71 were diagnosed with CS, and hence we found 1 of 34 (2.9%) had isolated CS.
Intraobserver Agreement
The κ for the 18F-FDG pattern interpretation was 0.94 and for overall clinical interpretation of CS it was 0.92, with agreement in 96% of scans (Tables 5 and 6).
Comparison of Image Pattern Interpretations in Reader 1 (κ-Value = 0.94)
Comparison of Reader 1’s Overall Interpretation (κ-Value = 0.92)
DISCUSSION
Our study found that there was moderate agreement between readers in assessing the 5 patterns (κ = 0.64), which was 74 of 100 scans, but good interobserver agreement in overall image interpretation of CS (κ = 0.85), which was 93 of 100 scans. Detailed prescan dietary preparation showed a trend to improve interobserver agreement, for overall interpretation of CS, and interpretation category. Whether patients had normal myocardial perfusion or not did not influence agreement.
To our knowledge, there has been only 1 prior study that evaluated the interobserver agreement of the interpretation of 18F-FDG PET/CT in patients with suspected CS. Soussan et al. (19) reported on 58 patients, 12 of 58 (21%) of whom were considered to have active CS based on PET imaging. All patients had dietary modification (low-carbohydrate, high-fat and protein-permitted diet) before imaging. The agreement between 2 nuclear physicians was good to identify a pattern suggestive of active CS (κ = 0.86). They did not report on interobserver agreement of patterns of uptake. However, their main result is certainly consistent with our study. Specifically, in our study in the subset of scans with detailed dietary preparation the overall imaging agreement between readers was better (κ = 0.74 without dietary modification and 0.92 with dietary modification, respectively, P = 0.16). In contrast to the reasonable agreement of overall interpretation, the agreement on patterns of uptake was lower (0.60 without and 0.67 with dietary modification, P = 0.16).
There were 7 of 100 scans, which had conflicting overall clinical interpretation between readers (CS-positive vs. CS-negative). Table 4 provides details of these patients including the final consensus interpretation. In 4 of 7 cases, 1 reader reported a diffuse uptake pattern and the other a focal on diffuse pattern. Five of the 7 patients did not have the detailed dietary preparation with low-carbohydrate, high-fat and protein-permitted diet. This emphasizes the critical importance of patient preparation to try to suppress all physiologic myocardial 18F-FDG uptake.
For patients without extracardiac 18F-FDG uptake, a cardiac scan interpretation consistent with CS was uncommon (4.2%). One patient had known extra-CS, and the scan was obtained after a period of steroid treatment. The other patient had isolated CS (endomyocardial biopsy proven). Isolated CS is an increasingly recognized phenomenon, described in up to 20% of patients (20).
Clinicians caring for patients with CS often base important management decisions on 18F-FDG PET imaging results. In particular, initial scans are often used to assist decisions for device and immunosuppression therapies, and serial scans are often obtained to assess response to immunosuppression and guide treatment escalation or deescalation. Thus, it is imperative that efforts continue to improve the quality of image interpretation. These efforts are ongoing and include optimization of physiologic 18F-FDG suppression (9); consensus recommendations that imaging 18F-FDG PET testing should be performed only at centers that have experience in CS imaging protocols (21); consensus guidelines on all aspects of imaging, from training standards to patient preparation to interpretation (North American and European guidelines are currently being developed, and the Japanese Society of Nuclear Medicine published a consensus guideline in 2014 (22)); novel tracers that may be less dependent on patient dietary preparation to suppress normal physiologic uptake (23); and quantitative reporting using various SUV metrics (24–26).
The present study had some limitations. First, it was performed at a single center. Second, we focused only on the reporting of active disease. The importance (and prognostic significance) of also reporting perfusion abnormalities in patients with CS has been highlighted (12). Third, we did not assess agreement regarding right ventricular uptake, which has also been shown to have prognostic importance (12).
CONCLUSION
The interobserver agreement for 18F-FDG uptake image patterns was moderate. However, agreement was better regarding overall image interpretation of the presence or absence of active CS. Detailed prescan dietary preparation improved interobserver agreement. Findings consistent with CS on 18F-FDG PET were uncommon when there was no evidence for sarcoidosis outside the heart.
Clinicians caring for patients with CS should be aware that there can be interobserver differences in the reporting of these scans. The imaging report should be interpreted in the context of all clinical information as well as 18F-FDG uptake outside the heart.
DISCLOSURE
The work has been supported in part by a research trial grant from the Ministry of Health and Long Term Care Research (grant # 06374) for the Ontario PET Cardiac Sarcoidosis Trial. The project is in collaboration with the Canadian Cardiovascular Network of Ontario Working Group for Cardiac PET in collaboration with the PET Steering Committee of Ontario. This work has also been partially supported by the Canadian Institute of Health Research (David Birnie, principal investigator) for The Cardiac Sarcoidosis Cohort Study (CHASM-CS) (grant no. 342139, NCT01477359).Hiroshi Ohira was supported by the Molecular Function and Imaging HSFO Program grant (#PRG6242), the University of Ottawa Department of Medicine, the Hokkaido Heart Association grant for research, and Astellas Foundation grant for research on metabolic disorders. Hiroshi Ohira and Brian Mc Ardle were also supported by The University of Ottawa Heart Institute’s Whit & Heather Tucker Endowed Cardiovascular Research Fellowship. Daniel Juneau is a Cardiac Imaging Fellow at the University of Ottawa Heart Institute and is supported by the UOHI Foundation and the Vered-Beanlands Fellowship in Cardiology Research as well as a grant from the CHUM and CHUM Foundation. Rob Beanlands is a Career Investigator supported by the Heart and Stroke Foundation of Ontario (HFSO), the University of Ottawa Heart Institute (UOHI) Vered Chair in Cardiology, and the Tier 1 University of Ottawa Chair in Cardiovascular Imaging Research. David Birnie is a Mid-career Investigator supported by the HSFO, UOHI Leadership Chair in Electrophysiology, and the Tier 1 University of Ottawa Chair in Electrophysiology Research. No other potential conflict of interest relevant to this article was reported.
Acknowledgments
We express our gratitude to the Cardiac Sarcoidosis Cohort Study (CHASM-CS), National Cardiac PET Center teams, and Canadian Care Network of Ontario including Karen MacDonald, RN, Tammy Knight, Linda Garrard, RN, and Ann Guo, BEng, as well as the May Aung, CNMT, Kym Gardner, CNMT, Monique Pacquette, RN, Patricia Grant, RN, and Kori Kingsbury, MSN.
Footnotes
Published online Mar. 2, 2017.
- © 2017 by the Society of Nuclear Medicine and Molecular Imaging.
REFERENCES
- Received for publication November 17, 2016.
- Accepted for publication February 2, 2017.


Jump to section
Related Articles
Cited By...
- Underdiagnosis of cardiac sarcoidosis by ECG and echocardiography in cases of extracardiac sarcoidosis
- Statistics Refresher for Molecular Imaging Technologists, Part 2: Accuracy of Interpretation, Significance, and Variance
- Reply: Using and Interpreting 18F-FDG PET/CT Images in Patients Referred for Assessment of Cardiac Sarcoidosis: The Devil Is in the Details
- Using and Interpreting 18F-FDG PET/CT Images in Patients Referred for Assessment of Cardiac Sarcoidosis: The Devil Is in the Details