


Abstract
18F-FDG PET/CT is potentially applicable to predict response to chemotherapy in combination with bevacizumab in patients with advanced non–small cell lung cancer (NSCLC). Methods: In 25 patients with advanced nonsquamous NSCLC, 18F-FDG PET/CT was performed before treatment and after 2 wk, at the end of the second week of first cycle carboplatin–paclitaxel and bevacizumab (CPB) treatment. Patients received up to a total of 4 cycles of CPB treatment. Maintenance treatment with bevacizumab monotherapy was continued until progressive disease without significant treatment-related toxicities of first-line treatment. In the case of progressive disease, bevacizumab was combined with erlotinib. SUV corrected for lean body mass (SUL and SULpeak) were obtained. PERCIST were used for response evaluation. These semiquantitative parameters were correlated with progression-free survival and overall survival (OS). Results: Metabolic response, defined by a significant reduction in SULpeak of 30% or more after 2 wk of CPB, was predictive of progression-free survival and OS. For partial metabolic responders (n = 19), the median OS was 22.8 mo. One-year and 2-y OS were 79% and 47%, respectively. Nonmetabolic responders (n = 6) (stable metabolic disease or progressive disease) showed a median OS of 4.4 mo (1-y and 2-y OS was 33% and 0%, respectively) (P < 0.001). Conclusion: 18F-FDG PET/CT after 1 treatment cycle is predictive of outcome to first-line chemotherapy with bevacizumab in patients with advanced nonsquamous NSCLC. This enables identification of patients at risk of treatment failure, permitting treatment alternatives such as early switch to a different therapy.
Lung cancer is a major cause of cancer-related death in the Western world (1). Non–small cell lung cancer (NSCLC) represents about 80% of all lung cancer. In most of the cases, patients already have locally advanced or metastatic disease at presentation. Vascular endothelial growth factor (VEGF) is an important mediator in tumor angiogenesis, which plays an important role in cancer cell survival in local tumor growth and in the development of distant metastases. A strongly increased expression of VEGF has been found in NSCLCs (2) and is associated with an unfavorable impact on survival (3). Bevacizumab, a monoclonal antibody against VEGF-A, interacts with this pathway by blocking the effect of VEGF. A landmark phase 3 trial has shown that the addition of bevacizumab to carboplatin and paclitaxel in NSCLC improved overall survival (OS) (4). Recent guidelines of the American Society of Clinical Oncology recommend adding bevacizumab to carboplatin plus paclitaxel (5). One explanation is that bevacizumab leads to vascular normalization of tumor vasculature (6), thus increasing delivery and of cytotoxic therapy to the tumor, leading to increased treatment efficacy. The evaluation of tumor volume response by conventional imaging techniques using RECIST has its limitations in the detection of early therapy response (7), especially in the case of targeted treatment. 18F-FDG PET/CT provides rapid, noninvasive, in vivo assessment and quantification of glucose metabolism and might be a powerful tool for measurement of treatment response. Changes in tumor glucose metabolism precede changes in tumor size and can possibly reflect drug effects at a cellular level, resulting in a potential advantage over morphologic imaging. Molecular imaging using 18F-FDG PET/CT has shown in NSCLC patients to be a valuable tool for early detection of treatment response in chemotherapy (8), chemoradiotherapy (9–13), and targeted treatment (14–19). The prediction of response using 18F-FDG PET/CT may enable a distinction between patients who are going to benefit from treatment. An early detection of nonresponders allows for treatment adaptation or earlier switch to other treatment lines. Ultimately, this can lead to a reduction in ineffective and potentially toxic therapy, a reduction in costs, and a more personalized tumor-oriented approach. Few 18F-FDG PET/CT response-monitoring studies have been performed to evaluate antiangiogenic treatment in NSCLC (20,21). To address this issue, a side study for early 18F-FDG PET/CT response monitoring was performed, alongside a phase 2 trial in patients with newly diagnosed advanced NSCLC treated with first-line chemotherapy carboplatin, paclitaxel, and bevacizumab (CPB). We explored the value of 18F-FDG PET/CT to predict clinical outcome using an early in-treatment 18F-FDG PET/CT.
MATERIALS AND METHODS
Patients
From January 2009 to January 2013, patients with newly diagnosed locally advanced or metastatic NSCLC without prior systemic treatment were enrolled in this prospective single-center study. Patients with histologically or cytologically confirmed nonsquamous NSCLC (stage IIIB or stage IV) and at least 1 measurable lesion (based on RECIST 1.1) were eligible. Exclusion criteria were previous chemotherapy or systemic antitumor therapy, previous radical radiotherapy, performance score of 2 or more (Eastern Co-operative Oncology Group), or another active malignancy except for nonmelanoma skin cancers in the last 5 y. This study was approved by the institutional review board of the Radboud University Medical Center Nijmegen. All patients provided written informed consent.
Treatment
Patients were treated with bevacizumab (15 mg/kg every 3 wk), paclitaxel (200 mg/m2 of body surface area on day 1 every 3 wk), and carboplatin (area under concentration time curve of 6, on day 1 every 3 wk). Patients received a maximum of 4 cycles of therapy, after which monotherapy of bevacizumab was continued as long as patients had no evidence of progressive disease and no significant treatment-related toxicities. In the case of progressive disease, bevacizumab, 15 mg/kg every 3 wk, continued and erlotinib (150 mg/d; second-line treatment) was added. Both epidermal growth factor receptor (EGFR) mutated and EGFR wild-type genotypes were included in the study.
Study Design
The primary objective of this phase II study was to monitor the efficacy of erlotinib plus bevacizumab subsequent to progressive disease on CPB as determined by the maximum achieved disease control rate. One of the secondary objectives was determination of early response, and 18F-FDG PET/CT was performed before treatment and after 1 cycle of treatment (before the second cycle of treatment). Other secondary objectives were to monitor disease control rate and time to progression of CPB and bevacizumab, respectively, and OS. The study design is shown in Figure 1. Clinicians were masked to the results of the in-treatment 18F-FDG PET/CT. Standard clinical response evaluation was done using contrast-enhanced CT at every 6 wk until disease progression. Response was assessed according to RECIST 1.1 (22) every 6 wk (or every 9 wk after week 18 in the bevacizumab treatment phase), at onset of clinical signs of progression, and in the case of premature discontinuation of study treatment. Partial response or complete response had to be confirmed after a minimum of 4 wk. In the case of stable disease, follow-up measurements must have met the stable disease criteria at least once after study entry at a minimal interval of 6 wk.
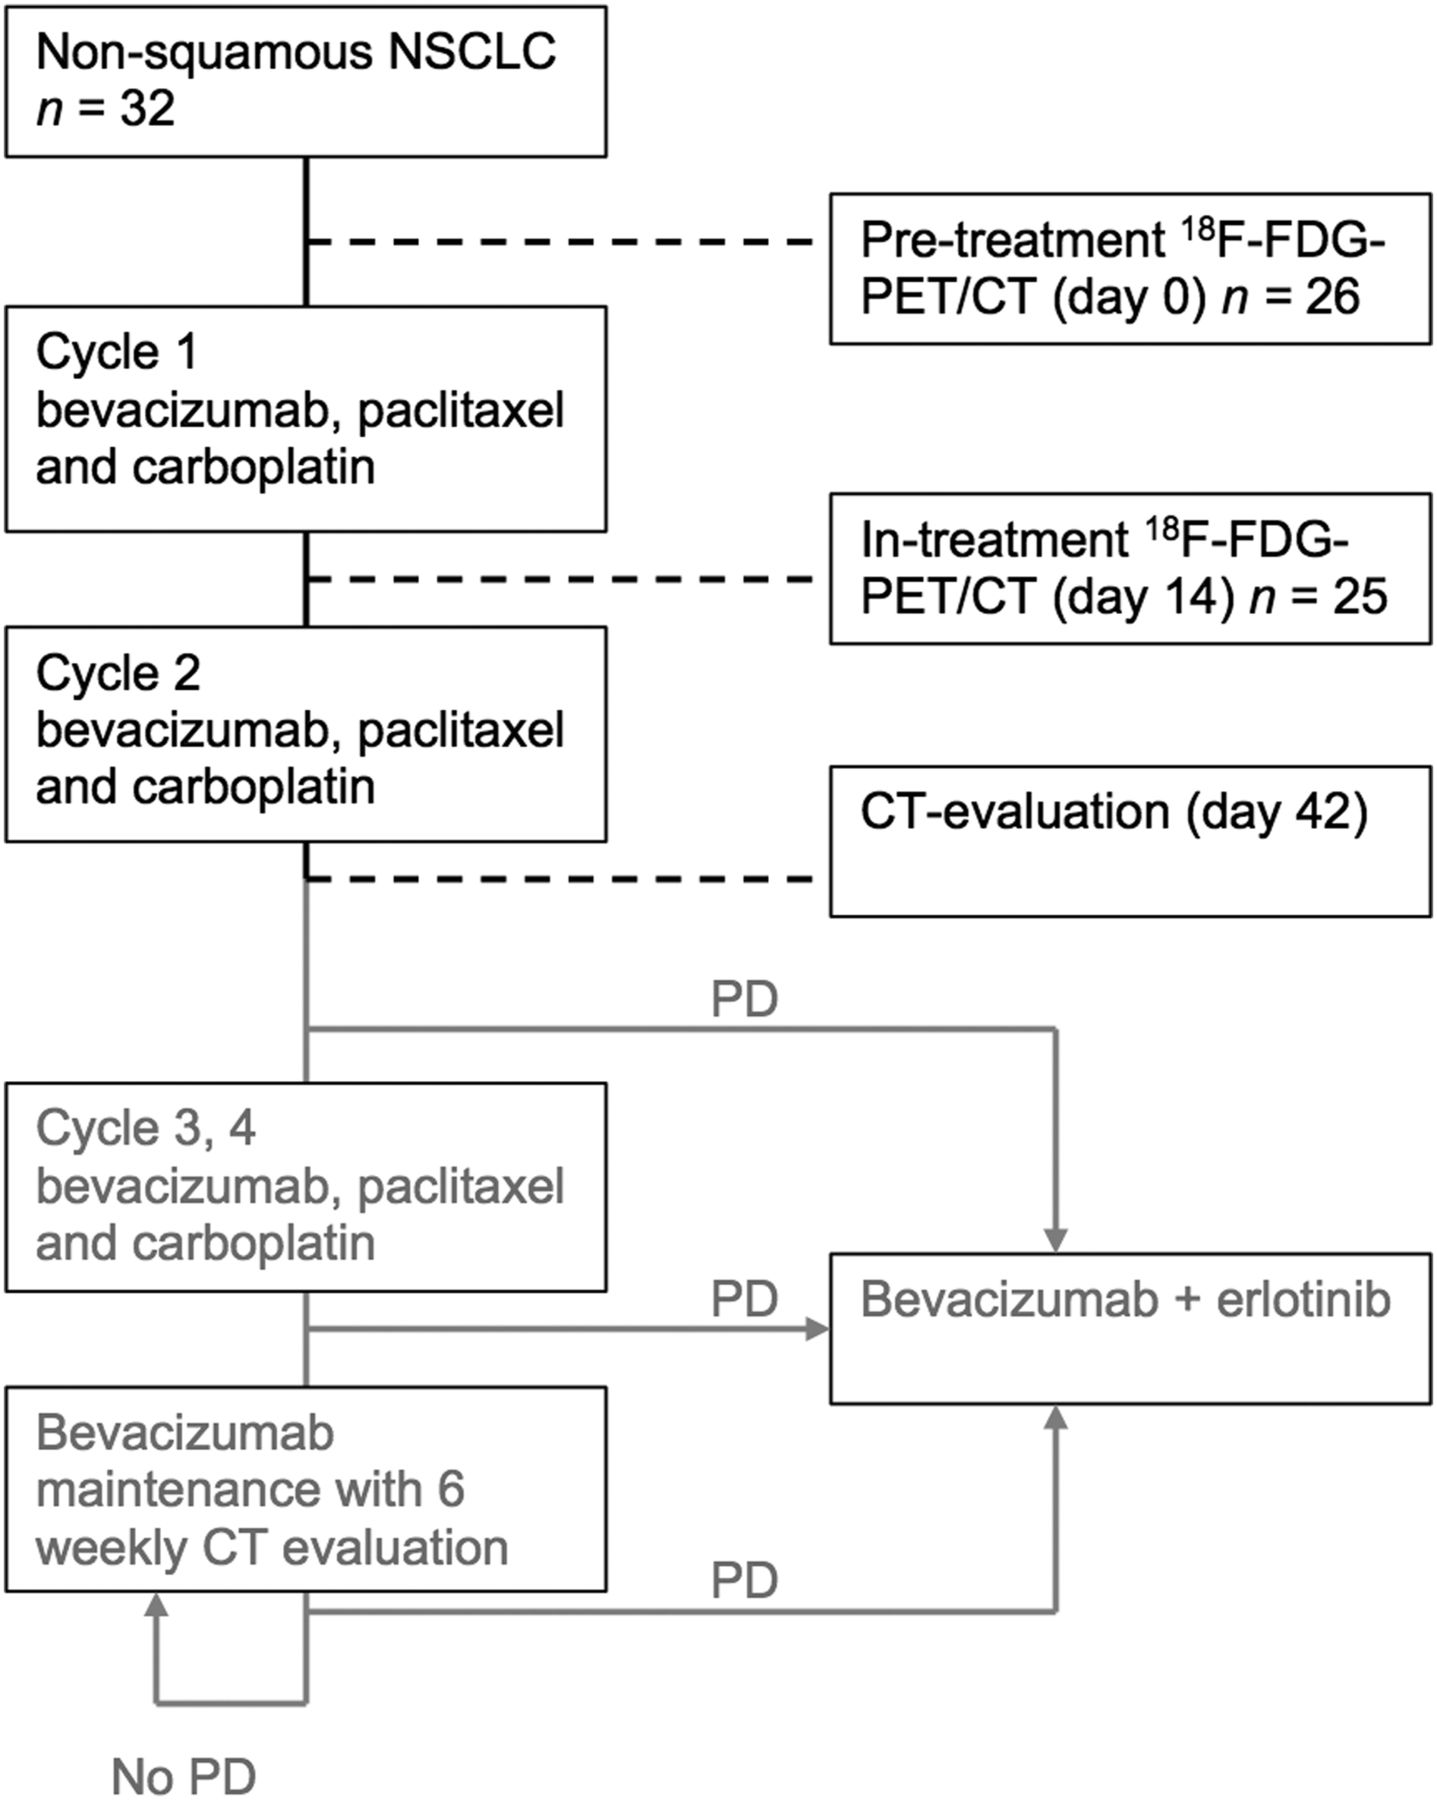
Study design. PD = progressive disease.
18F-FDG PET/CT
For each patient, baseline and in-treatment 18F-FDG PET/CT were performed with the same hybrid PET/CT scanner (Biograph Duo or Biograph 40 mCT; Siemens Medical Solutions USA, Inc.) according to the guidelines of the European Association of Nuclear Medicine (23). At least 6 h before 18F-FDG injection, the patients fasted, including discontinuation of any tube or percutaneous endoscopic gastrostomy feeding and any glucose-containing intravenous fluids. Immediately before 18F-FDG injection, the blood glucose level was checked. According to protocol, 18F-FDG PET/CT scans were obtained at a mean of 66 min (range, 58–73 min) after 18F-FDG injection and furosemide (10 mg), covering the neck, thorax, abdomen, and pelvis. The PET acquisition time was 4 min per bed position. PET scans from the Siemens Biograph Duo were processed using iterative reconstruction with the ordered-subsets expectation maximization algorithm (image matrix size, 128 × 128, 4 iterations, 16 subsets; and a 5-mm 3-dimensional gaussian filter). PET images from the Siemens Biograph 40 mCT were reconstructed with the TrueX algorithm (with a spatially varying point-spread function) and the incorporation of time-of-flight measurements (Ultra-HD PET; Siemens). Images were reconstructed with 3 iterations, 21 subsets, and a matrix size of 400 × 400 (pixel spacing of 2.04 mm). Reconstructed images were corrected for injected dose, decay of 18F-FDG, patient body weight, and attenuation using a low-dose CT scan. Correction for breathing motion using a 4-dimensional mode was not used.
Analysis of 18F-FDG PET
18F-FDG PET/CT images were analyzed on Pinnacle3 (version 8.0 d; Philips Radiation Oncology Systems). At baseline, 18F-FDG PET/CT was analyzed visually (number and localization of lesions) and quantitatively. SUV was normalized by lean body mass (SUL) using the Janmahasatian formula (24). The SULpeak of target lesions at baseline was at least 1.5 times mean liver SUL + 2 SDs of mean SUL. At follow-up, 18F-FDG PET/CT was analyzed visually (number and localization of lesions, new lesions, visual change in uptake, and size) and quantitatively (SUV, SUL, SULpeak). A maximum of 5 target lesions was selected and delineated using a 50% isocontour threshold, according to PERCIST (up to a maximum of 2 lesions per organ). New 18F-FDG–avid lesions, suggestive of metastasis, were considered progressive disease. For the evaluation of response, predefined response criteria (PERCIST) were used (25): a complete metabolic response (CMR) was defined as a complete resolution of 18F-FDG uptake within the measurable target lesions and other lesions (less than mean liver activity and at the level of surrounding background blood-pool activity) without the advent of new suggestive 18F-FDG–avid lesions. Partial metabolic response (PMR) was defined as a reduction of 30% or more in the target tumor SULpeak (and an absolute drop of at least 0.8 SUL). Progressive metabolic disease (PMD) was a 30% or more increase in SULpeak and 0.8-unit increase in SULpeak or the advent of new 18F-FDG–avid lesions typical of cancer. Stable metabolic disease (SMD) (reduction < 30% and increase < 30%) was disease other than CMR, PMR, or PMD. Two independent readers, masked to the results of the CT scans, read the 18F-FDG PET/CT scans and vice versa.
Statistical Analysis
Patients were considered evaluable for analysis if they underwent both pretreatment 18F-FDG PET/CT and in-treatment 18F-FDG PET/CT. OS was measured from the date of treatment start to time to disease-related death. Progression-free survival (PFS) was measured from the date of treatment start to time of disease progression on contrast-enhanced CT. In-treatment response evaluation on CT was measured at 6 wk after treatment start. On 18F-FDG PET/CT (measured 2 wk in-treatment), metabolic response was defined as CMR or PMR, and metabolic nonresponse was defined as SMD or PMD. Concordance between in-treatment PERCIST and RECIST was assessed using the Cohen κ coefficient and Wilcoxon signed-rank test. OS and PFS analysis was performed using the Kaplan–Meier method. Responders and nonresponders were compared using log-rank statistics. Statistical analysis was performed using SPSS 22.0 (SPSS Inc.) for Windows (IBM Corp.). The level of statistical significance was defined as a P value of less than 0.05 based on 2-sided tests. No time-dependent adjustment was needed, because no progression or death was observed before the RECIST assessment.
RESULTS
Patient Characteristics and Follow-up
Thirty-two patients were enrolled in the phase 2 study, of which 26 patients underwent a baseline 18F-FDG PET/CT. Patient characteristics are shown in Table 1. One patient did not receive in-treatment 18F-FDG PET/CT after the first treatment cycle and therefore was excluded from further analysis. Of the remaining 25 patients, 22 patients (88%) received 4 cycles (of 4) CBP, whereas 3 patients (12%) received only 2 cycles of first-line treatment, because of early disease progression. Twenty-one patients (84%) continued monotherapy bevacizumab. Nineteen patients (76%) received second-line treatment of erlotinib plus bevacizumab after they progressed on (CP)B. One patient receiving second-line erlotinib and bevacizumab had an EGFR mutation. In the present study, an EGFR mutation was found in 2 patients. Baseline 18F-FDG PET/CT was always performed before treatment; median time of baseline 18F-FDG PET/CT was 13 d (range, 2–35 d) before treatment. There was no relation between delay on treatment start and outcome (PFS or OS) in Cox proportional hazards analysis (hazard ratio of 0.997 [95% confidence interval, 0.963–1.033] [P = 0.871] for OS and 0.987 [95% confidence interval, 0.952–1.023] for PFS [P = 0.470]). The in-treatment 18F-FDG PET/CT was performed after 1 cycle of treatment at day 14 (range, 13–20 d), always before the second cycle of treatment. The median time to second-line treatment was 9.3 mo (range, 1.4–21.9 mo). Kaplan–Meier analysis for PFS and OS stratified using RECIST (6-wk after treatment start) is shown in Figure 2; no significant difference between response groups was found (log-rank P = 1.000 and 0.468 for PFS and OS, respectively). During follow-up, all 25 patients died due to disease progression.
Patient Characteristics
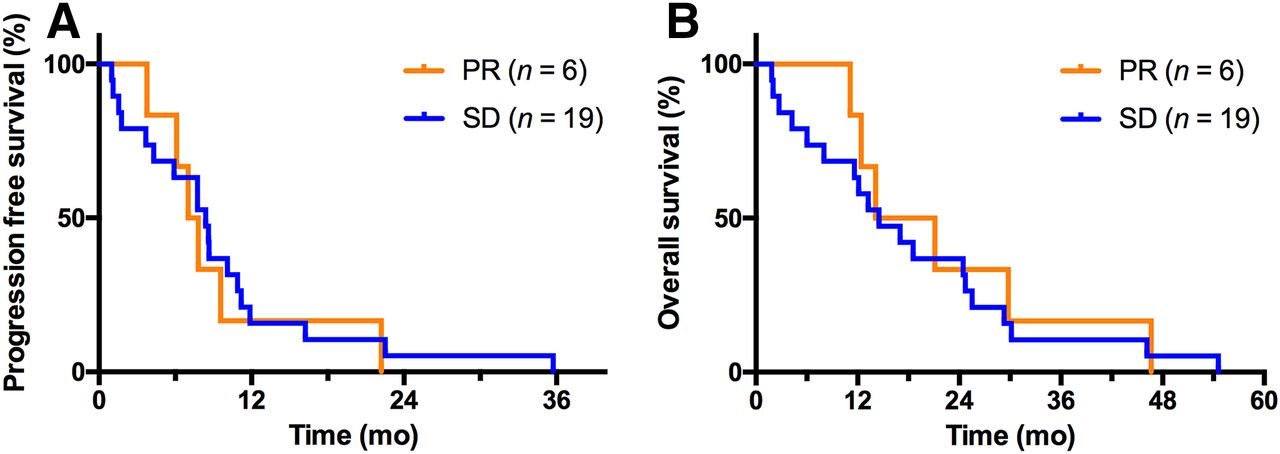
Kaplan–Meier analysis of PFS and OS stratified using RECIST. For stable disease (SD), median PFS was 8.4 and median OS was 14.5 mo. For partial response (PR), median PFS was 7.4 mo and median OS was 17.6 mo. Log-rank test, P = not significant.
Predictive Value of 18F-FDG PET/CT
The median baseline SUV was 6.8 and after 15 d of CPB treatment, median SUV was 5.0 in the target lesions. In all cases, SUL versus SUV response categories (using same cutoff levels of 30%) were 100% concordant. According to PERCIST, no patient had CMR, 2 (8%) patients had PMD, and 4 (16%) patients had SMD. Nineteen (76%) patients had PMR. For nonresponders (both PMD and SMD), median PFS was 1.7 mo (range, 1.0–6.1 mo). For patients with PMR, median PFS was 8.7 mo (range, 3.7–35.7 mo), and 1-y and 2-y PFS was 21% and 5%, respectively. For SMD and PMD, median OS was 4.4 mo (range, 1.7–14.1 mo); 1-y, and 2-y OS was 33% and 0%, respectively. For PMR, median OS was 22.8 mo (range, 4.3–54.6 mo), and 1-y and 2-y OS was 79% and 47%, respectively. The Kaplan–Meier analysis of PFS and OS stratified using PERCIST is shown in Figure 3. Figures 4 and 5 show 2 examples of patients with stage IV disease, with their baseline and in-treatment 18F-FDG PET/CT.

Kaplan–Meier analysis of PFS and OS stratified using PERCIST. For SMD and PMD, median PFS was 1.7 mo and median OS was 4.4 mo. For PMR, median PFS was 9.1 mo and OS was 22.8 mo. Log-rank test, P < 0.001.

Baseline (A) and in-treatment (B) 18F-FDG PET/CT in a 51-y-old female patient with NSCLC, stage IVB, with Pancoast tumor in left lung with metastasis in right adrenal gland (white and black arrows). In-treatment 18F-FDG PET/CT showed apparent decrease in uptake classified as PMR. Survival was 12.4 mo.

Baseline (A) and in-treatment (B) 18F-FDG PET/CT in a 67-y-old female patient with NSCLC, stage IVB, with tumor in left lower lobe with metastases in lymph nodes, lung, liver, and bones. In-treatment 18F-FDG PET/CT showed apparent increase in uptake (open arrows) and new 18F-FDG–avid bone lesions (black arrows), classified as PMD. Survival was 1.7 mo.
Comparison of Treatment Response Between RECIST and PERCIST
Nineteen patients were classified as SD on CT (6-wk in-treatment), whereas 4 patients were classified as SMD according to 18F-FDG PET/CT. Fifteen patients were classified as PMR. RECIST and PERCIST classifications are shown in Table 2. PERCIST and RECIST were discordant in 16 patients (64%). Of the 19 patients having SD according to RECIST, 14 patients were reclassified as having PMR according to PERCIST. One patient was classified as PMD because of the advent of new 18F-FDG–avid lesions suspected of bone metastasis; however, these lesions were not detected on the 6-wk in-treatment CT (this patient died 52 d after treatment start). A Cohen coefficient κ of 0.023 indicated minimal agreement between RECIST and PERCIST. The Wilcoxon signed-rank test was P < 0.01, indicating significant difference between RECIST and PERCIST.
Comparison of In-Treatment Response Between PERCIST and RECIST
DISCUSSION
This prospective study showed that early in-treatment 18F-FDG PET/CT in advanced NSCLC after 2 wk of first chemotherapy and bevacizumab is predictive of PFS and OS. Compared with CT, PET detected response earlier during treatment and more frequently. Therefore, the predictive potential of an early in-treatment 18F-FDG PET/CT, performed at 2 wk after the start of treatment, is better than measurement of size changes on CT according to RECIST at 6 wk after the start of treatment. This resulted in discordance between PERCIST and RECIST in 16 patients (64%). These differences can only partially be explained by the difference in timing of the response evaluation of 18F-FDG PET/CT (2 wk in-treatment) and diagnostic CT (6 wk in-treatment). Early after treatment initiation, tumor size changes as a result of both tumor reduction (i.e., mitotic cell death and cell loss) and tumor growth (i.e., cell division). As a result, small size changes, that is, actual response or actual tumor growth or progression, are underestimated when tumor size is used as an early predictive marker. According to PERCIST, a significant reduction in 18F-FDG uptake after 1 treatment cycle was associated with favorable outcome in terms of both PFS and OS. In this study, 6 of 25 patients (24%) were classified as nonresponder (SMD or PMD), showing a significantly lower median OS and PFS than patients with a PMR (P < 0.001). Of the 19 patients having SD according to RECIST, 14 patients were reclassified as having PMR according to PERCIST, showing that metabolic changes exceeded the threshold criteria earlier than morphologic changes. A prospective study by Shang et al. (26) comparing RECIST, PERCIST, and European Organisation for Research and Treatment of Cancer (EORTC) criteria for evaluation of early response (after 2 wk) to chemotherapy in NSCLC patients showed that both PERCIST and European Organisation for Research and Treatment of Cancer criteria were more accurate in predicting an early response to treatment.
Studies addressing response prediction in advanced NSCLC treated with first-line chemotherapy and bevacizumab are limited. De Langen et al. (21) demonstrated in (locally) advanced NSCLC patients treated with erlotinib and bevacizumab that a decrease in SUV of more than 20% after 3 wk was associated with increased PFS. In oncology practice, it is important to identify effective biomarkers for prediction of failure or success of treatment. In contrast to our study, other response-monitoring studies (9–14) did not use PERCIST for response evaluation (25). Predefined response criteria not only are important tools to assess an objective early response, but also are important in harmonization of 18F-FDG PET/CT studies and facilitate reproducibility across response assessment trials.
A major concern during anti-VEGF treatment is tumor evasion and resistance from VEGF blockage, involving several possible escapes mechanisms (27). An apparent increase in 18F-FDG uptake during treatment might suggest resistance mechanisms resulting in an increase in anaerobic metabolism and an increase in glycolysis. Alternatively, the decrease of tumor vascularity due to antiangiogenic agents could also lead to an increase in hypoxia and glycolysis. However, 18F-FDG alone is not capable of discriminating between hypoxic and nonhypoxic regions. Tumor hypoxia and metabolism are independent events, which was shown in a study comparing 18F-FAZA and 18F-FDG in NSCLC (28). The effects of antiangiogenic treatment could negatively affect the efficacy of 18F-FDG PET/CT early response monitoring in NSCLC. However, in our report we show that in early response monitoring in NSCLC patients treated with chemotherapy the addition of bevacizumab seems feasible. Another entirely different approach is 89Zr-bevacizumab to visualize targeting of VEGF receptors for prediction of treatment efficacy (29); however, further studies are needed to establish a potential role for 89Zr-bevacizumab in NSCLC.
A limitation of our study is the relative small number of patients. For development of a clinical application of metabolic treatment response studies, larger series are necessary. In our analysis, PMD and SMD patients were defined as nonmetabolic responders. These 2 categories may have outcome differences that can be detected only by a much larger study population. When effective surrogates for early prediction are established, treatment decision making based on the early in-treatment 18F-FDG PET/CT seems feasible. In our study, we showed that as early as 2 wk into first-line treatment, early metabolic changes predict clinical outcome. Most other 18F-FDG PET/CT response assessment studies were performed at relative late time points during treatment, not allowing any treatment adaptation based on the response assessment (30–32). Early discontinuation of ineffective treatment regimens can possibly prevent unnecessary treatment toxicity. Moreover, earlier switch to a potentially beneficial different therapy could result in early tumor consolidation, better outcomes, and better cost-effectiveness.
Another limitation of our study is the second-line bevacizumab and erlotinib therapy started after progression on CPB or on bevacizumab maintenance. This investigational second-line approach (given in 76% of the patients) showed only modest clinical benefit (33), where OS and PFS on first-line CPB were in line with published data (4). However, the optimal strategy of antiangiogenic therapy in the treatment of advanced NSCLC is still subject to randomized trials and large observational studies. Continuation of bevacizumab treatment in the absence of disease progression is a new treatment strategy in NSCLC, which is less toxic than traditional chemotherapy agents (34) and well tolerated (35). The concept of continuing bevacizumab treatment beyond progression is under investigation (36). More recently, the role of erlotinib with bevacizumab as first-line therapy is being explored (37).
CONCLUSION
The current study in advanced nonsquamous NSCLC patients treated with first-line chemotherapy and bevacizumab showed that early in-treatment 18F-FDG PET/CT is predictive of response to treatment and OS, already after 2 wk of therapy. This enables identification of patients at risk of treatment failure, permitting an early and more individualized treatment modification.
DISCLOSURE
Financial support was provided by a research grant from Roche BV, The Netherlands. Roche paid a fee to the pulmonology ward where Johanna N.H. Timmer-Bonte and Miep A. van der Drift worked at the time of this study. No other potential conflict of interest relevant to this article was reported.
Footnotes
Published online Mar. 23, 2017.
- © 2017 by the Society of Nuclear Medicine and Molecular Imaging.
REFERENCES
- Received for publication October 11, 2016.
- Accepted for publication January 31, 2017.


