


Abstract
Posterior cortical atrophy (PCA) and dementia with Lewy bodies (DLB) have both been associated with occipital lobe hypometabolism on 18F-FDG PET, whereas relative sparing of posterior cingulate metabolism compared with precuneus/cuneus (i.e., cingulate island sign) is a feature of DLB. We aimed to determine whether patterns of hypometabolism or the cingulate island sign differed between PCA and DLB. Methods: Sixteen clinically diagnosed PCA and 13 probable DLB subjects underwent 18F-FDG PET. All PCA subjects showed β-amyloid deposition on PET scanning. Regional hypometabolism was assessed compared with a control cohort (n = 29) using voxel- and region-level analyses in statistical parametric mapping. A ratio of metabolism in the posterior cingulate to precuneus plus cuneus was calculated to assess the cingulate island sign. In addition, the 18F-FDG PET scans were visually assessed to determine whether the cingulate island sign was present in each subject. Results: PCA and DLB showed overlapping patterns of hypometabolism involving the lateral occipital lobe, lingual gyrus, cuneus, precuneus, posterior cingulate, inferior parietal lobe, supramarginal gyrus, striatum, and thalamus. However, DLB showed greater hypometabolism in the medial occipital lobe, orbitofrontal cortex, anterior temporal lobe, and caudate nucleus than PCA, and PCA showed more asymmetric patterns of hypometabolism than DLB. The cingulate island sign was present in both DLB and PCA, although it was more asymmetric in PCA. Conclusion: Regional hypometabolism overlaps to a large degree between PCA and DLB, although the degree of involvement of the frontal and anterior temporal lobes and the presence of asymmetry could be useful in differential diagnosis.
Posterior cortical atrophy (PCA) and dementia with Lewy bodies (DLB) are 2 neurodegenerative diseases that have both been associated with hypometabolism on 18F-FDG PET in the occipital lobe. Patients with PCA present with a progressive decline in visuospatial and visuoperceptual deficits, with patients often having features of simultanagnosia, optic ataxia, oculomotor apraxia, and dysgraphia (1). In contrast, patients with DLB present with fluctuating cognitive impairment; recurrent visual hallucinations; features of parkinsonism, such as bradykinesia, rigidity, resting tremor, and postural instability; and rapid eye movement sleep behavior disorder (RBD) (2). Despite these differing clinical presentations, studies have reported similar patterns of hypometabolism on 18F-FDG PET, with both associated with hypometabolism predominantly in the occipital and temporoparietal cortices (3–9). In fact, the presence of occipital hypometabolism has been shown to be a useful feature to differentiate both DLB (8,10–12) and PCA (4–6) from typical Alzheimer dementia. There is often some overlap in the clinical presentation of these diseases, with, for example, hallucinations and RBD sometimes occurring in PCA patients (3,13), and so additional biomarkers that can help the differential diagnosis would be of value. It is currently unclear whether patterns of hypometabolism on 18F-FDG PET could be useful in this regard.
In addition to a characteristic pattern of occipital hypometabolism, studies in DLB have noted that the posterior cingulate is relatively spared and that a ratio of hypometabolism of the posterior cingulate to the precuneus plus cuneus (i.e., the cingulate island sign [CIS]) can differentiate DLB from typical Alzheimer dementia with high accuracy (14–16). It is unclear, however, whether the CIS is also a feature of PCA. The presence of the CIS is associated with lower Braak stages (14,17), and hence one could hypothesize that it may help differentiate DLB from PCA, because PCA is often associated with Alzheimer disease pathology and high Braak stage (1).
The aim of this study was, therefore, to compare patterns of hypometabolism on 18F-FDG PET, including an assessment of the CIS, in PCA and DLB to determine whether there are any potentially diagnostically useful differences.
MATERIALS AND METHODS
Subjects
Sixteen patients fulfilling clinical criteria for PCA (1,3) and 13 patients fulfilling clinical criteria for probable DLB (2) were recruited from the Department of Neurology, Mayo Clinic, and underwent 18F-FDG PET between 2010 and 2015. All patients had been evaluated by 1 of 2 behavioral neurologists. Neuroimaging findings were not used in the diagnosis of either DLB or PCA. The PCA inclusion criteria (3) were insidious onset and gradual progression; presentation of visual complaints in the absence of significant primary ocular disease explaining the symptoms; relative preservation of anterograde memory and insight early in the disorder; disabling visual impairment throughout the disorder; and presence of any of the following: simultanagnosia with or without optic ataxia or oculomotor apraxia, constructional dyspraxia, visual field defect, environmental disorientation, or any elements of Gerstmann syndrome (acalculia, agraphia, left-right disorientation, and finger agnosia). Clinical PCA features that were recorded in each subject included simultagnosia, optic ataxia, oculomotor apraxia, and dysgraphia (3). The presence of simultanagnosia was assessed using the Ishihara color plates and the documentation of how many items were recognized on visual inspection of a picture with 5 overlapping items. Cutoff was below 6 of 6 for plates and below 5 of 5 on overlapping pictures based on performance of 10 controls who scored 100% on both tests. Handwriting samples were assessed for evidence of dysgraphia (3). The presence or absence of oculomotor apraxia and optic ataxia was assessed on neurologic examination. Oculomotor apraxia was defined as the inability to voluntarily direct one’s gaze to a particular point. Optic ataxia was defined as the impairment of goal-directed hand movements toward visually presented targets. Clinical DLB features that were recorded in each subject included fluctuations, parkinsonism, visual hallucinations, and RBD. RBD was considered present if the behavior met diagnostic criteria B for RBD, defined as abnormal, wild flailing movements occurring during sleep (with sleep-related injuries), or movements that are potentially injurious or disruptive (18). Visual hallucinations were defined as a false visual perception, not associated with real external stimuli and not associated with falling or awakening from sleep, and had to be well formed, recurrent, well documented, nonfleeting, and spontaneous.
All 16 PCA subjects had undergone β-amyloid PET imaging using Pittsburgh compound B and were β-amyloid–positive (19). One PCA subject has died and was found to have Alzheimer disease at autopsy (Braak stage VI). The study was approved by the Mayo Clinic Institutional Review Board, and all patients consented to research.
The PCA and DLB subjects were matched 1:1 to 29 healthy control subjects who had undergone 18F-FDG PET (median age at PET, 66 y [interquartile range, 61–70 y], 31% women). All healthy controls had been recruited into the Mayo Clinic Study of Aging, and subjects were characterized as cognitively normal by consensus (20,21) and when their age-adjusted neuropsychologic test scores were consistent with normative data developed in this community (22). Imaging findings were not used in the diagnosis of controls.
18F-FDG PET Analysis
All subjects underwent 18F-FDG PET performed using a PET/CT scanner (GE Healthcare) operating in 3-dimensional mode. Subjects were injected with 18F-FDG (average, 459 MBq [range, 367–576 MBq]) and after injection were allowed to wait in a comfortable chair for the 30-min uptake period, in a dimly lit room, without talking, moving, or sleeping. After the 30-min uptake period, an 8-min 18F-FDG scan was obtained consisting of four 2-min dynamic frames after a low-dose CT transmission scan. Individual frames of the dynamic series were realigned if motion was detected, and then a mean image was created. All subjects had also undergone a volumetric MRI scan at the same time as the 18F-FDG PET scan, using a standardized protocol (19).
Voxel-level and region-level analyses were used to assess 18F-FDG PET. The voxel-level analysis was performed using statistical parametric mapping 5 (23). All MR images were normalized to a customized template (24). The PET images were coregistered to the patients’ MR image using 6-degree-of-freedom registration. The automated anatomic labeling atlas, containing pons, was propagated to native MRI space. Partial-volume correction of cerebrospinal fluid and tissue compartments was applied through the 2-compartment model (25) to remove atrophy effects on the 18F-FDG uptake. All voxels in the PET images were divided by median uptake of the pons to form 18F-FDG uptake ratio images. The 18F-FDG PET uptake ratio images were then normalized to the customized template using the normalization parameters from the MRI normalization. Group statistical comparisons were performed comparing PCA and DLB with each other and with the healthy control cohort, using 2-sided t tests. All comparisons were corrected for multiple comparisons using the false-discovery rate at a P value of less than 0.05. A conjunction analysis using the contrasts comparing each disease group with controls was performed to assess regions of hypometabolism that overlapped between PCA and DLB. Age and sex were included in all comparisons as covariates.
Atlas-based parcellation with the automated anatomic labeling atlas (26) was used to generate PET uptake of specific regions of interest. Partial-volume–corrected 18F-FDG PET uptake ratios were calculated for the occipital (lateral occipital, cuneus, calcarine, lingual), parietal (inferior and superior parietal lobe, supramarginal gyrus, angular gyrus, precuneus, posterior cingulate), temporal (temporal pole, inferior, middle and superior temporal gyri, hippocampus, parahippocampal gyrus and fusiform gyrus) and frontal lobes (orbitofrontal and prefrontal cortex), and subcortical nuclei (caudate, putamen, and thalamus). Left and right hemisphere values were averaged for our group comparisons, because there was no evidence for any hemispheric differences at the group level. However, hemispheric asymmetry scores were also calculated for each subject as the absolute difference between left and right hemisphere.
The CIS was assessed using both a quantitative and a visual approach. The quantitative CIS was calculated by dividing the median uptake ratio in the posterior cingulate gyrus by the median uptake ratio in the precuneus plus cuneus (14,16). 18F-FDG PET images were visually assessed, with the behavioral neurologist masked to clinical diagnosis, to determine whether a CIS was present in each subject based on the axial and sagittal raw 18F-FDG PET images. A subject was considered to have a CIS if 18F-FDG metabolism was lower in the precuneus and cuneus than in the posterior cingulate in either hemisphere, as previously described (14,16). A CIS was visually graded as asymmetric if a CIS was present in one hemisphere but not the other.
Statistical Analysis
Statistical analyses were performed using JMP computer software (version 10.0.0; SAS Institute Inc.) with significance assessed at a P value of 0.05 or less. χ2 tests were used to compare categoric data, and Wilcoxon signed-rank tests were used to compare continuous data. Sensitivity, specificity, positive predictive value, and negative predictive value for differentiating PCA and DLB were calculated for variables that showed significant differences between PCA and DLB.
RESULTS
No differences were observed between PCA and DLB in age at scanning or degree of cognitive impairment (Table 1). However, PCA had a longer disease duration and younger age at onset than DLB.
Subject Demographics and Clinical Features
PCA and DLB showed overlap in patterns of hypometabolism in the voxel-level maps when compared with controls (Fig. 1). Both groups showed hypometabolism in the bilateral lateral occipital lobe, lingual gyrus, cuneus, precuneus, posterior cingulate, inferior parietal lobe, left supramarginal gyrus, lateral posterior temporal lobes, and thalamus. In addition to these common regions, DLB showed hypometabolism throughout the frontal lobes and basal ganglia (Fig. 1). On direct comparison, DLB showed greater hypometabolism throughout the frontal and anterior temporal lobes than PCA (Fig. 1). No regions showed greater hypometabolism in PCA than DLB.
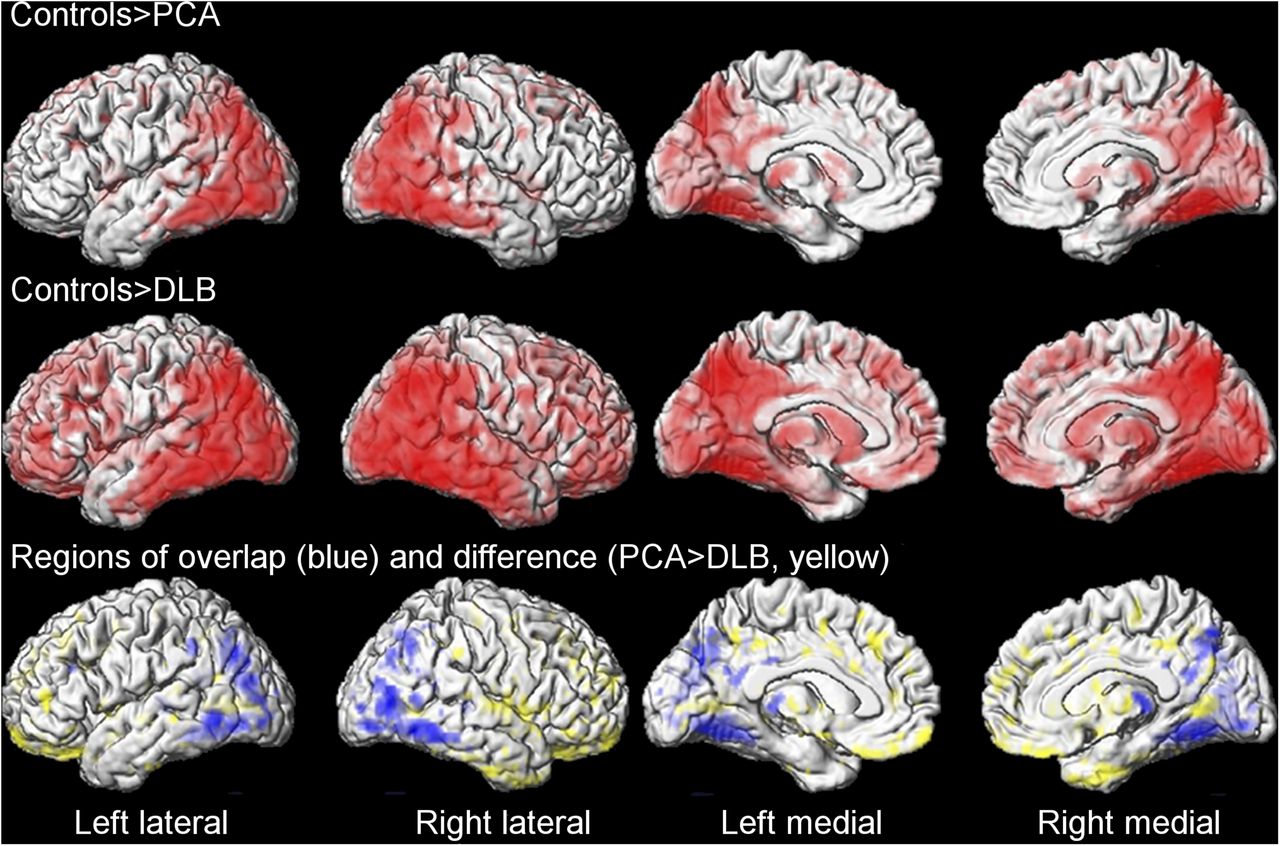
Regional 18F-FDG PET hypometabolism in PCA and DLB compared with controls. (Top and middle) Regions of overlap between PCA and DLB using conjunction analysis (blue) and regions that showed greater hypometabolism in DLB than PCA on direct comparison (yellow) (bottom). Results shown after correction for multiple comparisons at P < 0.05.
In the region-of-interest analysis both groups showed hypometabolism across many of the regions compared with controls, although DLB showed greater hypometabolism in calcarine gyrus, lingual gyrus, temporal pole, orbitofrontal cortex, prefrontal cortex, and caudate than PCA (Table 2). Hemispheric asymmetry in the occipital and parietal lobes was greater in PCA than in controls and DLB, and in the temporal lobe it was greater in PCA than in controls (Table 2). Of the 16 PCA subjects, 15 (94%) showed asymmetry in either the parietal or the occipital lobe (with asymmetry scores greater than the maximum value in controls). Ten of these showed greater hypometabolism in the right than in the left hemisphere, and 5 showed greater hypometabolism in the left than in the right. Only 4 DLB subjects (31%) showed evidence for asymmetry.
Regional 18F-FDG SUVRs
There was a trend for the quantitative CIS to be higher in subjects with DLB than in controls (P = 0.09), but no differences were observed between PCA and controls (P = 0.43) or between PCA and DLB (P = 0.43) (Table 2). Visual assessment identified the CIS in 11 of 13 (85%) of the DLB subjects and in 8 of 16 (50%) of the PCA subjects (P = 0.05). However, it was found that the CIS was more commonly asymmetric in the PCA subjects (5/8, 63%) compared with the DLB subjects (1/11, 9%, P = 0.01) (Fig. 2). Of the 5 asymmetric PCA cases, 3 showed a CIS in the right hemisphere and 2 in the left hemisphere. The 1 asymmetric DLB subject showed a CIS in the right hemisphere.
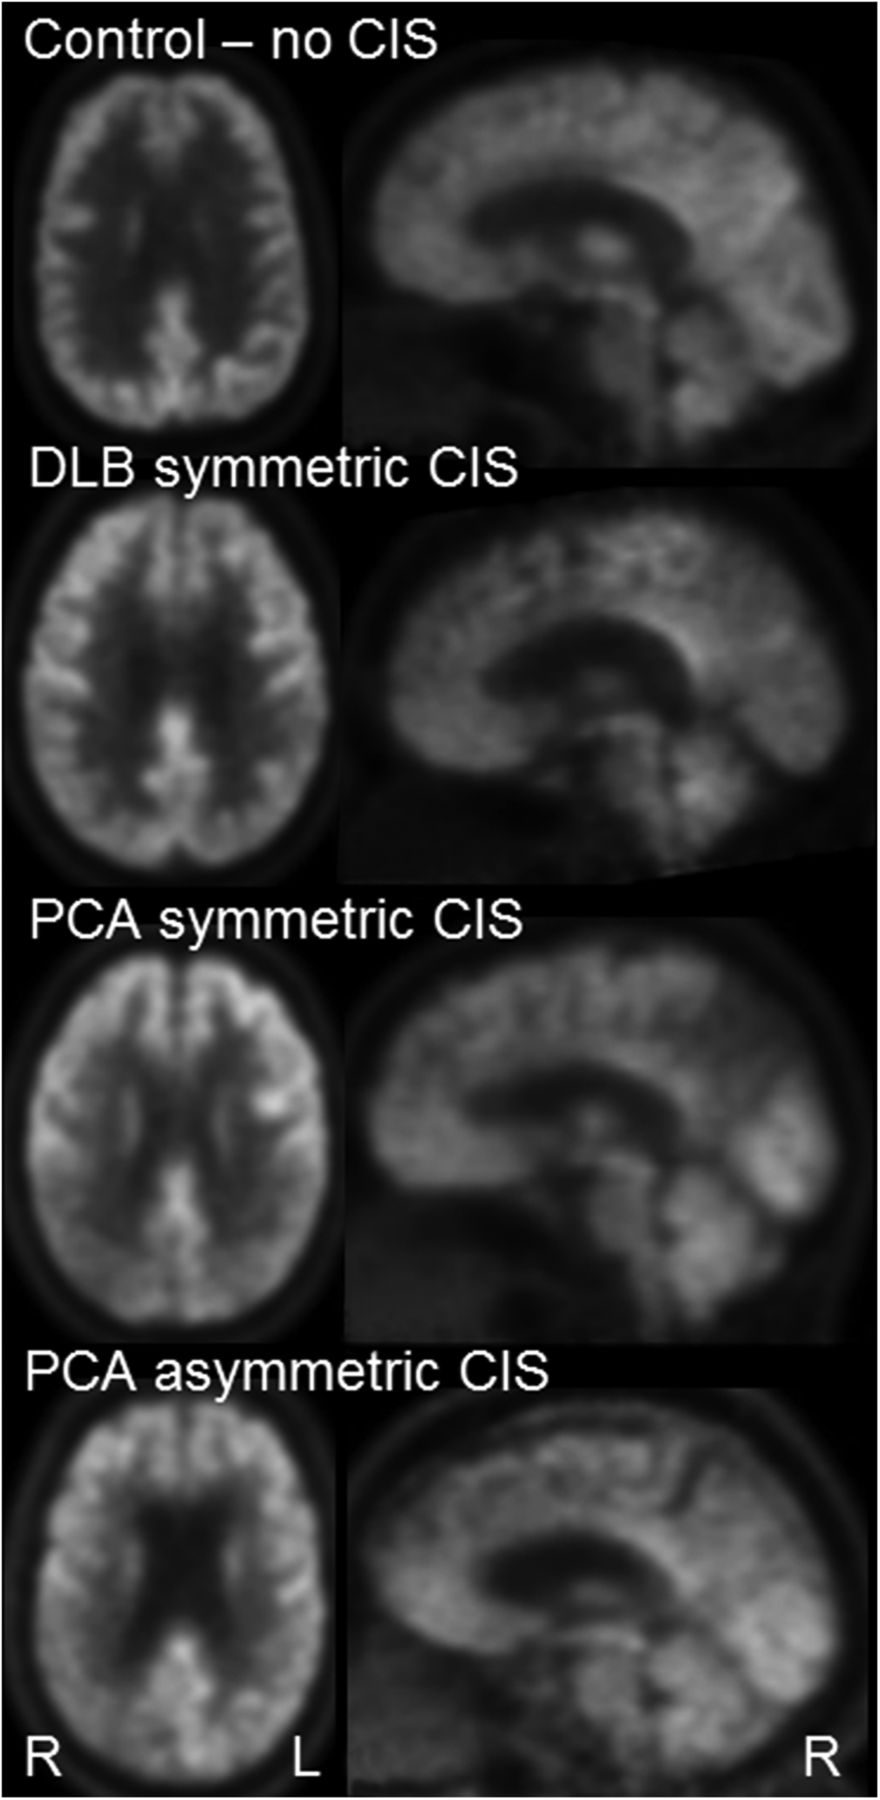
Example 18F-FDG PET showing CIS in PCA and DLB.
The presence of an asymmetric CIS showed high specificity for PCA (92%) but low sensitivity (31%) (Table 3). However, the presence of asymmetry in the parietal or occipital lobe showed high sensitivity (94%) and good specificity (69%) for a diagnosis of PCA. The variables that performed the best in predicting DLB were hypometabolism in the temporal pole and orbitofrontal cortex (Table 3).
Diagnostic Statistics to Differentiate PCA and DLB
DISCUSSION
This study demonstrates that PCA and DLB have strikingly similar patterns of hypometabolism involving the posterior cortices of the brain. However, DLB tended to show more severe and widespread patterns of dysfunction, whereas PCA showed more asymmetric patterns of hypometabolism. The CIS was present in both groups, although a symmetric CIS was more suggestive of DLB and an asymmetric CIS more suggestive of PCA. These findings could have clinical utility in helping to differentiate these diseases.
Hypometabolism in the occipital lobe, as well as parietal lobe, lateral temporal cortex, striatum, and thalamus, was observed in both PCA and DLB in our study, suggesting dysfunction to a common network of structures. One could hypothesize that dysfunction in this network of structures may contribute to the overlapping features observed across PCA and DLB. Occipital hypometabolism has been associated with the presence of DLB clinical features (27–29), and visual hallucinations, parkinsonism, and RBD were observed in some of our PCA patients, as has previously been reported (13). Atrophy of the primary visual cortex and thalamus has indeed been associated with the presence of visual hallucinations in PCA (13), and parietal and thalamic atrophy has been associated with parkinsonism in PCA (30). However, PCA patients showed striking visual impairments, such as simultanagnosia, oculomotor apraxia, and optic ataxia, which have also been linked to occipital–parietal hypometabolism (3), that were not observed in DLB. Further work is therefore required to disentangle the neuroanatomic basis for the clinical differences between PCA and DLB within this network.
Some differences were observed between PCA and DLB in patterns of hypometabolism, with DLB tending to show more severe and widespread dysfunction than PCA. Notably, DLB showed greater hypometabolism in the medial occipital lobe, orbitofrontal cortex, prefrontal cortex, anterior temporal lobe, and caudate nucleus. This more widespread pattern of hypometabolism is similar to previous 18F-FDG PET findings in DLB (7,8,14) and concurs with the idea that DLB is associated with a distributed pattern of network dysfunction, involving dorsal attention and executive networks (31). Conversely, metabolism in the anterior temporal lobes and prefrontal cortices, with the exception of regions in the frontal eye fields, are typically spared in PCA (3–5). Involvement of these structures on 18F-FDG PET could therefore suggest a diagnosis of DLB. Hypometabolism of the orbitofrontal cortex and temporal pole showed particularly good sensitivity and specificity to differentiate DLB from PCA. Another striking difference between the 2 syndromes was the presence of asymmetry, which was observed in almost all PCA subjects but rarely observed in DLB. This asymmetry was not evident in the group comparisons because the PCA cohort consisted of some subjects with greater involvement of the right hemisphere and others with greater involvement of the left hemisphere, as others have observed (32). However, the presence of asymmetry in either direction showed excellent sensitivity and specificity for a diagnosis of PCA and should therefore be considered in the differential diagnosis.
The CIS, showing relative sparing of the posterior cingulate compared with the precuneus and cuneus, was observed in most of the DLB subjects on visual inspection, supporting previous studies in DLB (14,16,33). However, the quantitative CIS values did not differ between DLB and PCA, with half of the PCA subjects also showing a CIS on visual inspection, suggesting a CIS is not specific to DLB. It has been hypothesized that the CIS provides a marker of Alzheimer disease pathology (14), whereby the absence of a CIS in Alzheimer dementia reflects hypometabolism of the posterior cingulate resulting from disrupted inputs from the hippocampus (33,34). In contrast, the presence of a CIS in DLB reflects a low Braak stage (14). This is not likely to be the case in PCA because all our PCA subjects showed positive β-amyloid PET scans, and PCA cases typically have a high Braak stage (1). Instead, it likely reflects the fact that PCA subjects often have an unusual distribution of neurofibrillary tangles with relative sparing of the hippocampus (1,35–37). Interestingly, the CIS in DLB has been associated with medial temporal lobe atrophy (33). Therefore, the presence of CIS in DLB and PCA may indicate sparing of posterior limbic circuitry in both disorders compared with typical Alzheimer dementia. This also shows that the presence of posterior cingulate hypometabolism is not a reliable sign of the presence of Alzheimer disease when dealing with atypical clinical presentations. Although the CIS was also found in PCA, we did find a difference in the visual symmetry of the CIS in DLB and PCA. Although the DLB cases typically showed sparing of the posterior cingulate compared with the precuneus and cuneus in both hemispheres, a large proportion of PCA cases showed asymmetry, with the CIS often observed only in 1 hemisphere. This matches our finding of general asymmetry in PCA. The presence of an asymmetric CIS had excellent sensitivity for PCA because it was rarely observed in DLB, suggesting it could be a useful diagnostic clue for PCA. However, it had poor specificity and so the absence of an asymmetric CIS would not rule out the diagnosis of PCA.
A strength of our study is that our 18F-FDG PET analyses were corrected for partial-volume averaging due to atrophy. This is a particularly important correction in this cohort because PCA is associated with striking cortical atrophy (37) whereas DLB is not typically associated with much atrophy (38). We also had autopsy confirmation of Alzheimer disease in 1 PCA subject, and all PCA subjects underwent β-amyloid PET imaging in order to increase confidence that these subjects had underlying Alzheimer disease. The lack of β-amyloid PET imaging in the DLB subjects is a limitation of the study given that DLB subjects can often have Alzheimer disease in addition to Lewy body pathology. However, both occipital hypometabolism and the CIS have been shown to be present in DLB independent of β-amyloid PET findings (12,14). Another potential limitation is that the PCA subjects had longer disease duration than the DLB subjects, which may have reduced power to detect regions with greater hypometabolism in DLB. We did not find any regions with greater hypometabolism in PCA than DLB, and this would likely be unchanged if we had a PCA cohort earlier in their disease course.
CONCLUSION
Our findings suggest that investigating patterns of hypometabolism on 18F-FDG PET in subjects with a suspected diagnosis of PCA or DLB may be useful for differential diagnosis. The presence of hypometabolism in the orbitofrontal cortex and temporal pole, in addition to the typical pattern of occipital and parietal hypometabolism, would suggest a diagnosis of DLB, whereas the presence of asymmetric hypometabolism in the occipital and parietal lobes would be more indicative of a diagnosis of PCA.
DISCLOSURE
This study was funded by Alzheimer’s Association grant NIRG-12-242215 and NIH grant R01-AG50603. No other potential conflict of interest relevant to this article was reported.
Footnotes
Published online Sep. 29, 2016.
- © 2017 by the Society of Nuclear Medicine and Molecular Imaging.
REFERENCES
- Received for publication June 17, 2016.
- Accepted for publication September 8, 2016.


Jump to section
Related Articles
Cited By...
- Atypical Parkinsonian Syndromes: Structural, Functional, and Molecular Imaging Features
- SNMMI Procedure Standard/EANM Practice Guideline for Brain [18F]FDG PET Imaging, Version 2.0
- Discordance and Concordance Between Cerebrospinal and [18F]FDG-PET Biomarkers in Assessing Atypical and Early-Onset AD Dementia Cases
- Posterior Cingulate Involvement Does Not Argue Against LATE
- 18F-FDG PET Imaging in Neurodegenerative Dementing Disorders: Insights into Subtype Classification, Emerging Disease Categories, and Mixed Dementia with Copathologies
- Integrity of Neurocognitive Networks in Dementing Disorders as Measured with Simultaneous PET/Functional MRI
- Deep learning-based imaging classification identified cingulate island sign in dementia with Lewy bodies
- Imaging Synaptic Density: A Different Look at Neurologic Diseases