


Abstract
Aggregation of hyperphosphorylated tau is a major hallmark of many neurodegenerative diseases, including Alzheimer disease (AD). In vivo imaging with PET may offer important insights into pathophysiologic mechanisms, diagnosis, and disease progression. We describe different strategies for quantification of 18F-AV-1451 (T807) tau binding, including models with blood sampling and noninvasive alternatives. Methods: Fifteen subjects (4 controls, 6 AD, 3 progressive supranuclear palsy, 2 cortico basal syndrome) underwent 180-min PET with 18F-AV-1451 and arterial blood sampling. Modeling with arterial input functions included 1-, 2-, and 3-tissue-compartment models and the Logan plot. Using the cerebellum as reference region, we applied the simplified reference tissue model 2 and Logan reference plot. Finally, simplified outcome measures were calculated as ratio, with reference to cerebellar concentrations (SUV ratio [SUVR]) and SUVs. Results: Tissue compartment models were not able to describe the kinetics of 18F-AV-1451, with poor fits in 33%–53% of cortical regions and 80% in subcortical areas. In contrast, the Logan plot showed excellent fits and parameter variance (total volume of distribution SE < 5%). Compared with the 180-min arterial-based Logan model, strong agreement was obtained for the Logan reference plot also for a reduced scan time of 100 min (R2 = 0.91) and SUVR 100–120 min (R2 = 0.94), with 80–100 min already representing a reasonable compromise between duration and accuracy (R2 = 0.93). Time–activity curves and kinetic parameters were equal for cortical regions and the cerebellum in control subjects but different in the putamen. Cerebellar total volumes of distribution were higher in controls than patients. For these methods, increased cortical binding was observed for AD patients and to some extent for cortico basal syndrome, but not progressive supranuclear palsy. Conclusion: The Logan plot provided the best estimate of tau binding using arterial input functions. Assuming that the cerebellum is a valid reference region, simplified methods seem to provide robust alternatives for quantification, such as the Logan reference plot with 100-min scan time. Furthermore, SUVRs between target and cerebellar activities obtained from an 80- to 100-min static scan offer promising potential for clinical routine application.
Alzheimer disease (AD) is a neurodegenerative disorder with progressing dementia, neuropathologically characterized by amyloid-β deposition in the form of senile plaques and aggregation of hyperphosphorylated tau as neurofibrillary tangles, leading to neuronal dysfunction and cell death (1,2). The formation of amyloid-β plaques may already occur even decades before symptom onset, whereas tau deposition is more closely related to the disease duration and severity (3,4), making it a potentially important marker for monitoring disease progression and treatment strategies (5). Furthermore, tau aggregation is implicated in a series of other neurodegenerative diseases such as cortico basal syndrome (CBS), progressive supranuclear palsy (PSP), and frontotemporal dementia.
Although biomarkers obtained from cerebrospinal fluid demonstrate great clinical utility (6), the procedure does not yield information about the spatial distribution of tau pathology in the brain. Hence, robust noninvasive imaging markers would offer an important advancement for diagnosis and monitoring of disease progression. Several PET radioligands with high sensitivity for tau have been developed (1,7). These include the family of THK compounds (8), 11C-PBB3 as well as 18F-T808 and 18F-AV-1451 (formerly known as T807). Of those, only 11C-PBB3 (9) and (S)-18F-THK5117 (10) have yet undergone full quantitative description. Although robust quantification was obtained both with an arterial-based model and with simplified ratio methods, 11C-PBB3 exhibits a radioactive metabolite that crosses the blood–brain barrier, making full quantification challenging. In addition, labeling with 11C may complicate clinical applicability because of the short half-life, which impedes shipping and limits each synthesis to a few scans. On the other hand, (S)-18F-THK5117 showed promising results, with strong agreement between arterial-based and noninvasive models for PET scans as short as 60 min (10). However, the radioligand exhibits high white matter uptake and less signal-to-noise ratio as compared with other THK compounds (8). Although 18F-T808 does not include these issues, the radioligand is subject to substantial defluorination (11). The resulting bone uptake may in turn complicate exact quantification of nearby cortical areas due to spillover and partial-volume effects occurring from limited PET resolution (12). 18F-AV-1451 shows promising characteristics for tau quantification. The radioligand exhibits a more than 25-fold-higher sensitivity for tau than amyloid-β (13), a high gray–to–white matter contrast (14), and negligible nonspecific binding to several other targets such as monoamine oxidase A and B (13). Further, radioactive metabolites of 18F-AV-1451 are unlikely to pass the blood–brain barrier (13), and little tracer uptake in the bone has been reported (14). Initial human studies have demonstrated increased binding in patients with AD and mild cognitive impairment when compared with controls (15). Although quantification with reference region models and ratio methods was recently reported (16), validation with arterial blood sampling and scan durations longer than 100 min is still missing.
The aim of this work was to establish an optimal quantification procedure for tau binding with 18F-AV-1451, for both research-related and clinical purposes. This included the identification of an optimal modeling strategy with arterial blood sampling as a gold standard, the assessment of noninvasive alternatives, and simplified ratio methods. We further evaluated different scan time intervals between 40 and 180 min when using SUVs and SUV ratios (SUVRs) for potential clinical applicability when separating AD patients from controls.
MATERIALS AND METHODS
Subjects
Fifteen subjects participated in this study. These included 4 healthy controls (HCs; mean age ± SD, 75.0 ± 3.8 y; 1 woman), 6 patients with AD (64.8 ± 14.7 y; 2 women), 2 patients with CBS (66.5 ± 0.7 y; 2 women), and 3 patients with PSP (74.3 ± 5.8 y; 0 women). All patients underwent a clinical and neurologic examination and were assessed using the Hoehn and Yahr (H&Y) and Schwab and England activities of daily living (S&E) scales as well as several cognitive rating scales, including Mini Mental State Exam (MMSE), A Quick Test of Cognitive Speed (AQT), Symbol Digit Modalities Test (SDMT), Hospital Anxiety and Depression Scale (HADS), Stroop Test, and Trail Making Test A (TMT-A). Patients with AD diagnosis met the DSM III-R criteria for dementia and the criteria for probable AD defined by the National Institute of Neurological and Communicative Disorders and Stroke and the Alzheimer's Disease and Related Disorders Association (NINCDS-ADRDA) (17). PSP patients were diagnosed according to the National Institute of Neurological Disorders and Stroke (NINDS) criteria (18), and were further assessed using the PSP rating scale and the Unified Parkinson's Disease Rating Scale (UPDRS)-III. CBS patients were diagnosed in accordance with clinicopathologic guidelines (19). Healthy controls had no previous neurologic or psychiatric disorders. Exclusion criteria were current alcohol or drug abuse, other major or recurrent neurologic or psychiatric disorders, inability to undergo MRI, and severe renal, hepatic impairment or significant infectious disease. All subjects signed a written informed consent form after detailed explanation of the study protocol. The procedures were approved by the Ethical Review Board of Lund University (2014-233) and the Swedish Medical Products Agency. All procedures were performed according to the Declaration of Helsinki.
Radiolabeling of 18F-AV-1451
18F-fluoride activity was retained on a preconditioned Sep-Pak Light Accell Plus (QMA) Cartridge and eluted to the reaction vessel using 0.75 mL of a 0.075 M Tetrabutylammonium Hydrogen Carbonate Solution. The eluted activity was heated at 110°C under nitrogen flow and vacuum for 5 min and 20 s while 3 additions of acetonitrile were made to facilitate the azeotropic removal of water. A solution of AV-1622 (1.5 mg in anhydrous DMSO [1.6 mL]) was added to the reaction vessel, and the resulting mixture was kept at 120°C for 5 min followed by deprotection using 1.0 mL of 2M HCl(aq) at 100°C for 5 min. After being cooled for 1 min, the crude 18F-AV-1451 mixture was neutralized with 2.4 mL of 1M NaOH(aq). The resulting mixture was passed through an Oasis HLB Light cartridge. The retained crude 18F-AV-1451 was washed with water for injection (WFI) then eluted off the Oasis HLB Light cartridge using 1.5 mL of acetonitrile. The crude 18F-AV-1451 was diluted with 3.5 mL of WFI/ethanol (10/1) and loaded onto a semipreparative Zorbax Eclipse XDB-C18, 9.4 × 250 mm, 5-μm high-performance liquid chromatography (HPLC) column for purification using the isocratic elution 40% ethanol/60% 100 mM phosphate buffer at a 4 mL/min flow rate. The HPLC fraction containing the purified 18F-AV-1451 was collected (4 mL) and directly transferred into the final vial through a 0.22-μm Cathivex-GS filter. The pH of the solution was adjusted with 2 mL of citrate buffer, and the solution was also diluted with 10 mL of NaCl 0.9% to adjust the concentration of ethanol in the final solution.
PET
Subjects underwent a 180-min PET examination with 18F-AV-1451 on a Discovery 690 PET/CT scanner (GE Healthcare) at Skåne University Hospital, Lund, Sweden. The mean intravenous injected dose was 371.1 ± 14.1 MBq (5.58 ± 1.43 MBq/kg of body weight), and the radioligand was administered as a bolus over 40 s.
To minimize head motion during the acquisition, the subject's head was strapped to a dedicated head holder. List-mode data were acquired from 0 to 60, 80 to 140, and 160 to 180 min after injection. For attenuation correction, a separate low-dose CT was obtained before each scan session. To reduce motion artifacts, the non–attenuation-correction PET images were visually inspected and, if required, manually aligned to the CT image, after which the corresponding sinograms were aligned accordingly. Following this alignment step, the PET images were reconstructed again with attenuation correction, using an iterative Vue Point HD algorithm (6 subsets, 18 iterations, 3 mm filter, no time-of-flight correction). These parameter settings were established using phantom measurements and preliminary data analysis. The acquisitions were reconstructed into frames of 12 × 10, 6 × 20, 6 × 30, 3 × 60, 5 × 120, and 8 × 300 s (0–60 min) as well as 12 × 300 s (80–140 min) and 4 × 300 s (160–180 min). The resolution of the PET scanner was 4.7 mm transverse and 4.74 mm axial in full width at half maximum 1 cm next to the center of the field of view (20).
Blood Sampling
A cannula was inserted into the radial artery, after which arterial blood samples were obtained manually every 5 s until 1.5 min after injection, every 10 s until 3 min, every 20 s until 5 min, every 30 s until 8 min, every 1 min until 12 min, every 2 min until 20 min, and then every 5 min until the rest of the measurement (excluding PET breaks). Plasma was separated by centrifugation, and radioactivity levels in both whole-blood and plasma samples (3 mL each) were measured in a γ-counter (1480 Wizard; PerkinElmer). Radioactive metabolites were determined using HPLC for 10-mL samples at 5, 15, 30, 45, 60, 90, 120, and 180 min. Plasma was obtained by 6-min centrifugation at 4,400 rpm and 4°C. Plasma proteins were precipitated by adding acetonitrile (2.5 mL) to the plasma (2.5 mL). The resulting mixture was centrifuged at 4,400 rpm for 6 min. Two milliliters of the supernatant were injected into a HPLC to separate the parent tracer from its radioactive metabolites (pump, injector, and UV-detector: Ultimate 3000 [Dionex]; BGO radioactivity detector [Bioscan]). The sample was injected on a Chromolith SemiPrep, RP-18e 100-10 mm column, 100 × 4.6 mm. The tracer and its metabolite were eluted with 0.1% trifluoroacetic acid in H2O and MeCN gradients (0–12 min 15%–85%, 12–16 min 85%, 16–17 min 85%–15%, 17–20 min 15%) at a flow rate of 2 mL/min. The eluent from the column was collected in 30 different fractions (1 mL/fraction), each measured in a γ-counter to determine the percentage of intact parent compound. The parent fraction was fitted with a Hill function (21), multiplied with the plasma curve, which was finally fitted with a tri-exponential function from the peak onward to obtain the arterial input function. The individual delay of the radioligand between the sampling site (radial artery) and the brain was estimated by modeling a whole-brain time–activity curve (22).
MRI
Structural images were obtained with a T1-weighted magnetization-prepared rapid gradient echo sequence using a 3-T Siemens Skyra scanner. Sequence parameters were echo time/repetition time, 2.54/1,900 ms, with 176 slices with a 1-mm isotropic resolution acquired. Structural images were used for coregistration with PET images and transformation of regions of interest (ROIs) to individual space.
Data Processing
Coregistration, spatial normalization, and segmentation were performed with the Advanced Neuroimaging Tools (http://stnava.github.io/ANTs/). PET images were corrected for head motion by coregistration of each frame to the first frame within that data set, using a 6-parameter rigid transformation. Delineation of brain regions was carried out automatically as follows. After brain extraction of the structural MR images, the summed PET images of each session were separately coregistered to the MR image. The structural MR image was then spatially normalized to the MNI152 structural template (Montreal Neurological Institute) and segmented into gray and white matter as well as cerebrospinal fluid. Cortical template brain regions (see the “Regions of Interest [ROIs]” section) were then masked with a 50% gray matter mask to reduce spill-over from non–gray matter areas, whereas subcortical regions were masked with a tissue mask (consisting of gray and white matter). The masked brain regions were then warped into PET space, and projected onto the dynamic PET image to obtain regional time–activity curves using the inverse transformation matrices.
ROIs
ROIs were derived from the Harvard–Oxford atlas and the probabilistic cerebellar atlas provided in FMRIB Software Library (http://fsl.fmrib.ox.ac.uk/fsl/). These regions were the frontal, temporal, parietal, occipital, and cingulate cortices; thalamus; putamen; caudate; hippocampus; and cerebellar gray matter excluding vermis (and hence also excluding the dentate nucleus, potentially showing increased binding in PSP patients).
The frontal ROI included the frontal pole and the superior, middle, and inferior (pars triangularis, pars opercularis) frontal gyri. The temporal region contained the superior (anterior and posterior divisions), middle, and inferior temporal gyri (anterior, posterior, and temporooccipital parts). The parietal ROI included the superior parietal lobe and the supramarginal (anterior and posterior) and the angular gyri. The occipital region contained the lateral occipital (inferior and superior divisions) and intracalcarine cortices. The cingulate ROI comprised the anterior and posterior cingulate gyri. If an ROI contained several subparts, time–activity curves were generated from these multiple ROIs as an average weighted by size of the subparts. Regions were averaged for left and right hemispheres, except for CBS patients, for whom only the affected hemisphere was included.
Quantitative Analysis
To estimate tau binding, several quantification strategies were used (Table 1). The optimal model was identified on the basis of the structure of residuals (23), goodness of fit (Akaike information criterion), and variance of the outcome parameter (percentage SE, Marquart–Levenberg optimization calculated in PMOD). Using the arterial input function, we applied 1-, 2-, or 3-tissue-compartment models (1TCM, 2TCM, and 3TCM, respectively) with and without K1/k2 coupled across regions as well as the Logan plot (24). The primary outcome parameter was the total volume of distribution (VT) for 1TCM and Logan plot as well as the specific volume of distribution or binding potential (VS = BPP) for 2TCM and 3TCM (25). Assuming that the cerebellum contains only nondisplaceable binding (26), we also computed VS = VT – VT_cerebellum (VT_cerebellum is the volume of distribution for the cerebellum), the DVR (distribution volume ratio) = VT/VT_cerebellum, and BPND (binding potential relative to nondisplaceable binding) = (VT – VT_cerebellum)/VT_cerebellum from the Logan plot. These metrics served for comparison with simplified methods (Table 2). The cerebral blood volume component was fixed to 5% for all models and brain regions.
Evaluated Models and Corresponding Primary Outcome Parameter
Associations of 18F-AV-1451 Tau Binding Between 180-Minute Arterial-Based Logan Plot and Noninvasive Alternatives
Reference region models were applied including the simplified reference tissue model 2 (SRTM2) (27) and the Logan reference plot (28), with the cerebellum as a reference, yielding BPND and DVR = BPND + 1 as outcome measure, respectively. For the Logan reference plot, k2’ was estimated with the SRTM2 in temporal and cerebellar cortices. For direct comparison, the calculations with the SRTM2 were additionally performed with the same k2’ fixed for all regions. Shortened scan time was evaluated for the Logan reference plot for 60, 100, and 140 min. Finally, ratio methods were evaluated for simplified application in clinical routine. These included the ratio between the activity in the target region (Ctarget) and the activity in the cerebellum (Ccerebellum), SUVR = Ctarget/Ccerebellum. SUVs were calculated as the activity in the target region divided by the injected dose per kg of body weight. For the ratio methods and SUV, the activities were averaged for the following intervals: 40–60, 80–100, 120–140, and 160–180 min after injection plus 100–120, 80–110, 90–120, 100–130, and 110–140 min for SUVR. All modeling procedures were performed in PMOD (version 3.70; PMOD Technologies; http://www.pmod.com).
Statistics
To assess the similarity between the optimal 180-min arterial-based model and simplified methods (reference region models, ratio methods, and SUV with shortened scan time), linear regression analysis was computed across all brain regions and subjects. Here, outcome parameters from simplified methods were compared with the correspondingly transformed outcome from the arterial-based Logan plot (e.g., SUVR compared with DVR = VT/VT_cerebellum from arterial-based Logan plot) (Table 2). This comparison yielded R2 as a value of reproducibility as well as slope and intercept, indicating constant bias and scaling errors, respectively. For clinical applicability, the difference between AD patients and controls was calculated using independent-samples t tests, to normalize for differences in the variance for different outcome measures. Because of the low sample size, this comparison was not performed for CBS and PSP patients.
RESULTS
Blood Data
Whole-blood and plasma activities showed rapid clearance of the radioligand from plasma (Fig. 1A). Plasma–to–whole-blood ratios approached 1 after 20 min and increased slowly throughout the measurement (Fig. 1B). Metabolism occurred at a moderate pace, with approximately 50% parent compound being available after 30 min (Fig. 1B). In line with previous studies (8,29), a single radioactive metabolite was observed with high-performance liquid chromatography (presumably 18F−), which was more polar than the parent compound (retention times, 3.7 and 7.5 min, Figs. 1C and 1D) and was thus considered unlikely to pass the blood–brain barrier.

Analysis of blood data. (A) Whole-blood and plasma activities from representative healthy subject showing rapid clearance of radioligand from blood (log scale). (B) Parent fraction and plasma–to–whole-blood ratio averaged across entire sample. Bars denote SD. (C and D) High-performance liquid chromatography profiles obtained from blood sample 15 and 120 min after injection. Only 1 metabolite was observed (presumably 18F−) with much shorter retention time (3.7 min) than parent compound (7.5 min). WB = whole blood.
Arterial-Based Models
The delay of the input function was −0.8 ± 2.9 s (range, −6.7…3.4 s). None of the compartment models adequately described the data for all subjects or regions (Fig. 2; Supplemental Figs. 1 and 3). Compartmental modeling results were similar for the cortex and hippocampus as well as across the remaining subcortical regions independent of the configuration. The 1TCM did not provide acceptable fits throughout as illustrated by the residuals (Supplemental Fig. 1A) and highest Akaike information criterion values (Supplemental Fig. 2A). For cortical regions, the 2TCM showed poor fits for more than 1 ROI in 8 subjects (Fig. 2A; Supplemental Fig. 1B). Although coupling of K1/k2 decreased the variance of outcome parameters (Supplemental Fig. 2B), model fits were even worse for 3 subjects (all AD patients, Supplemental Fig. 1C). Adding a third tissue compartment to the model improved the model fits in these 3 subjects (Fig. 2B), with all other subjects showing identical fits (Supplemental Figs. 1D and 1E). As expected, parameter variability was poor for the unconstrained 3TCM, whereas coupling K1/k2 improved this issue.

Time–activity curves of 2 subjects and corresponding fits obtained with 2TCM and 3TCM, with K1/k2 coupled. (A) For HC subject, cerebellar kinetics were similar to those of cortex. However, no adequate model fits were obtained with either compartment model. (B) For AD patient, 3TCM gave marked improvement in temporal cortex, which was, however, not obtained for all subjects. Cerebellar time–activity curves showed similar kinetics between patient and control, but again adequate fits could not be obtained with any tissue compartment model. (C) Logan plots of same AD patient showed that linearity was reached quickly (at 26.1 ± 17.8 min).
For subcortical regions, the 2TCM did not reach satisfactory fits in 12 subjects, which did not improve with a 3TCM or when coupling K1/k2 (Supplemental Fig. 2A). Regarding the cerebellar gray matter, 2TCM fits were not acceptable for 7 subjects. This improved for only 1 subject (AD) when using the 3TCM, but coupling K1/k2 had no effect.
Using spectral analysis, shortening the scan time to 60 or 120 min, weighting data by frame duration (data not shown) or ROI refinement to smaller subregions (Supplemental Fig. 3) did not improve the model fits. As expected, the VT as outcome parameter showed considerably lower standard errors; however, this does not change the issue of generally poor fits for compartment models. In contrast, the Logan plot showed excellent fits (Fig. 2C) and parameter variance (all VT < 5% SE, Supplemental Fig. 2C) with start of the linear part at t* = 26.1 ± 17.8 min. Therefore, the Logan plot was used as the standard for comparison with the simplified analyses.
Reference Region Models
The SRTM2 showed higher parameter variance for BPND (51.3% ± 131.0% SE) as compared with the Logan reference plot DVR (0.5% ± 0.4% SE). Still, both methods yielded excellent agreement with the respective outcome measure obtained from arterial-based Logan plot (R2 = 0.92 and 0.99, respectively) and little bias (Table 2). A shortened scan time lowered the association with the arterial-based Logan plot and increased bias. Good agreement was observed until 100 min (R2 = 0.91), but for 60 min k2’ could not be estimated reliably for 2 subjects (1 HC, 1 PSP).
Ratio Methods
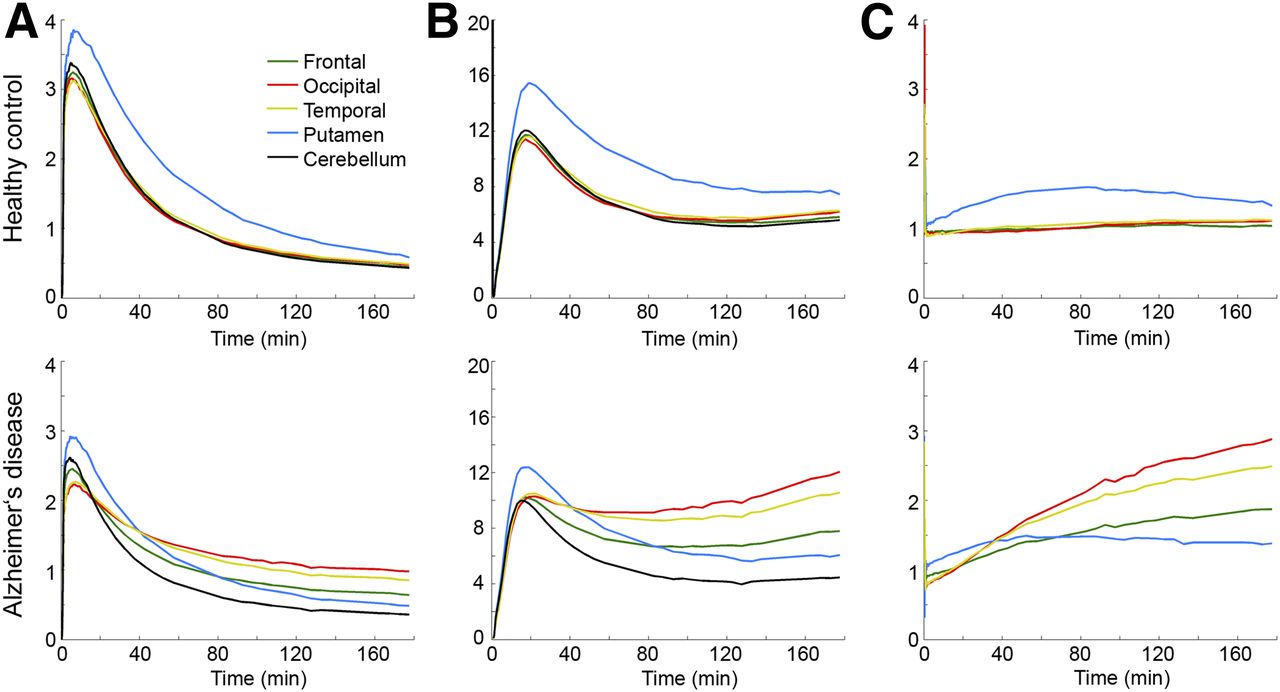
SUVR showed strong agreement with the arterial-based Logan plot (R2 = 0.88–0.94, Table 2). Although SUVR correlations were similar for all intervals greater than 80 min, 100–120 min performed best, whereas 80–100 min may represent a reasonable compromise between duration and accuracy. Thirty-minute intervals did not improve the associations. For SUV, only moderate agreement with the arterial-based Logan VT was obtained (R2 = 0.69–0.82), with highest correlations occurring for 120–140 min. Figure 3 shows time–activity curves normalized by injected dose (SUV), by plasma activity, and by the cerebellum (SUVR). Interestingly, the putamen showed rather different kinetics than any other brain region, especially for HCs.

Time–activity curves averaged across all subjects for HCs and AD patients for frontal (green), occipital (red), and temporal cortices (yellow); putamen (blue); and cerebellar gray matter (black). Given are target activities divided by injected dose per kg of body weight (SUV) (A), divided by activity in plasma (B) and divided by activity in cerebellum (SUVR) (C).
Group Differences in 18F-AV-1451 Binding
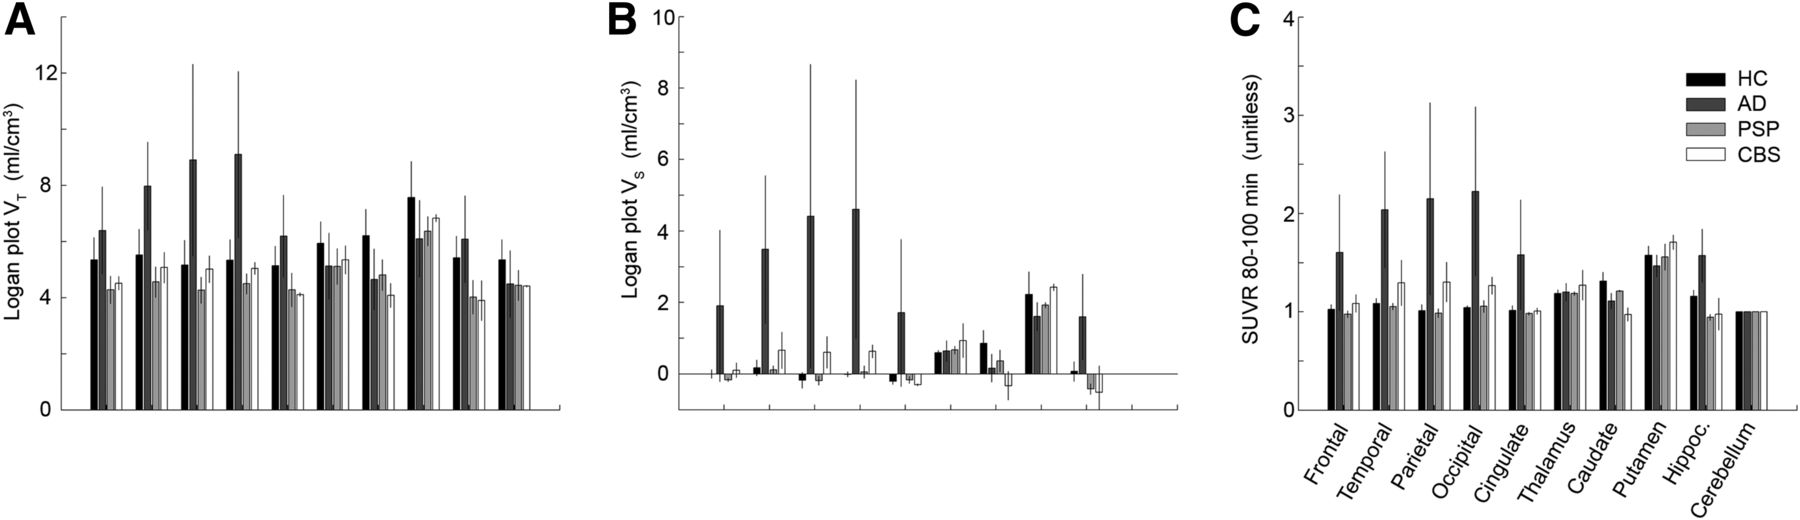
Compared with the cerebellum, average binding in HCs was similar for cortical regions and the hippocampus but higher for subcortical areas. Logan VT was markedly higher for AD patients than HCs across all cortical regions, whereas for PSP and CBS patients Logan VT was slightly lower for all regions (Fig. 4A). Conversely, Logan VT in the cerebellum was lower in all patient groups when compared with HCs (16.5%). This seems to be attributable to a minor extent to differences in gray matter volume, which was 8.1% lower in patients. Correcting for the differences in cerebellar VT, Logan VS showed more pronounced differences between AD patients and HCs including the hippocampus and slightly increased binding for CBS patients in temporal, parietal, and occipital cortices (Fig. 4B). Similarly, SUVR calculated for 80–100 min resulted in 1.6- to 2.2-fold-higher binding for AD and up to 1.3-fold increased binding for CBS in the cortex (Fig. 4C). Differences between PSP and HCs were generally low for Logan VS and SUVR.

Average 18F-AV-1451 binding for different brain regions and population groups (from dark to bright: HC, AD, PSP, CBS) obtained with arterial-based Logan plot VT (A), Logan plot VS (B), and SUVR 80–100 min (C). AD patients showed higher cortical binding than HCs for all outcome parameters. Differences in CBS became evident only for Logan VS and SUVR, hence, after correcting for higher cerebellar VT in HC. Differences between PSP and HC were generally low.
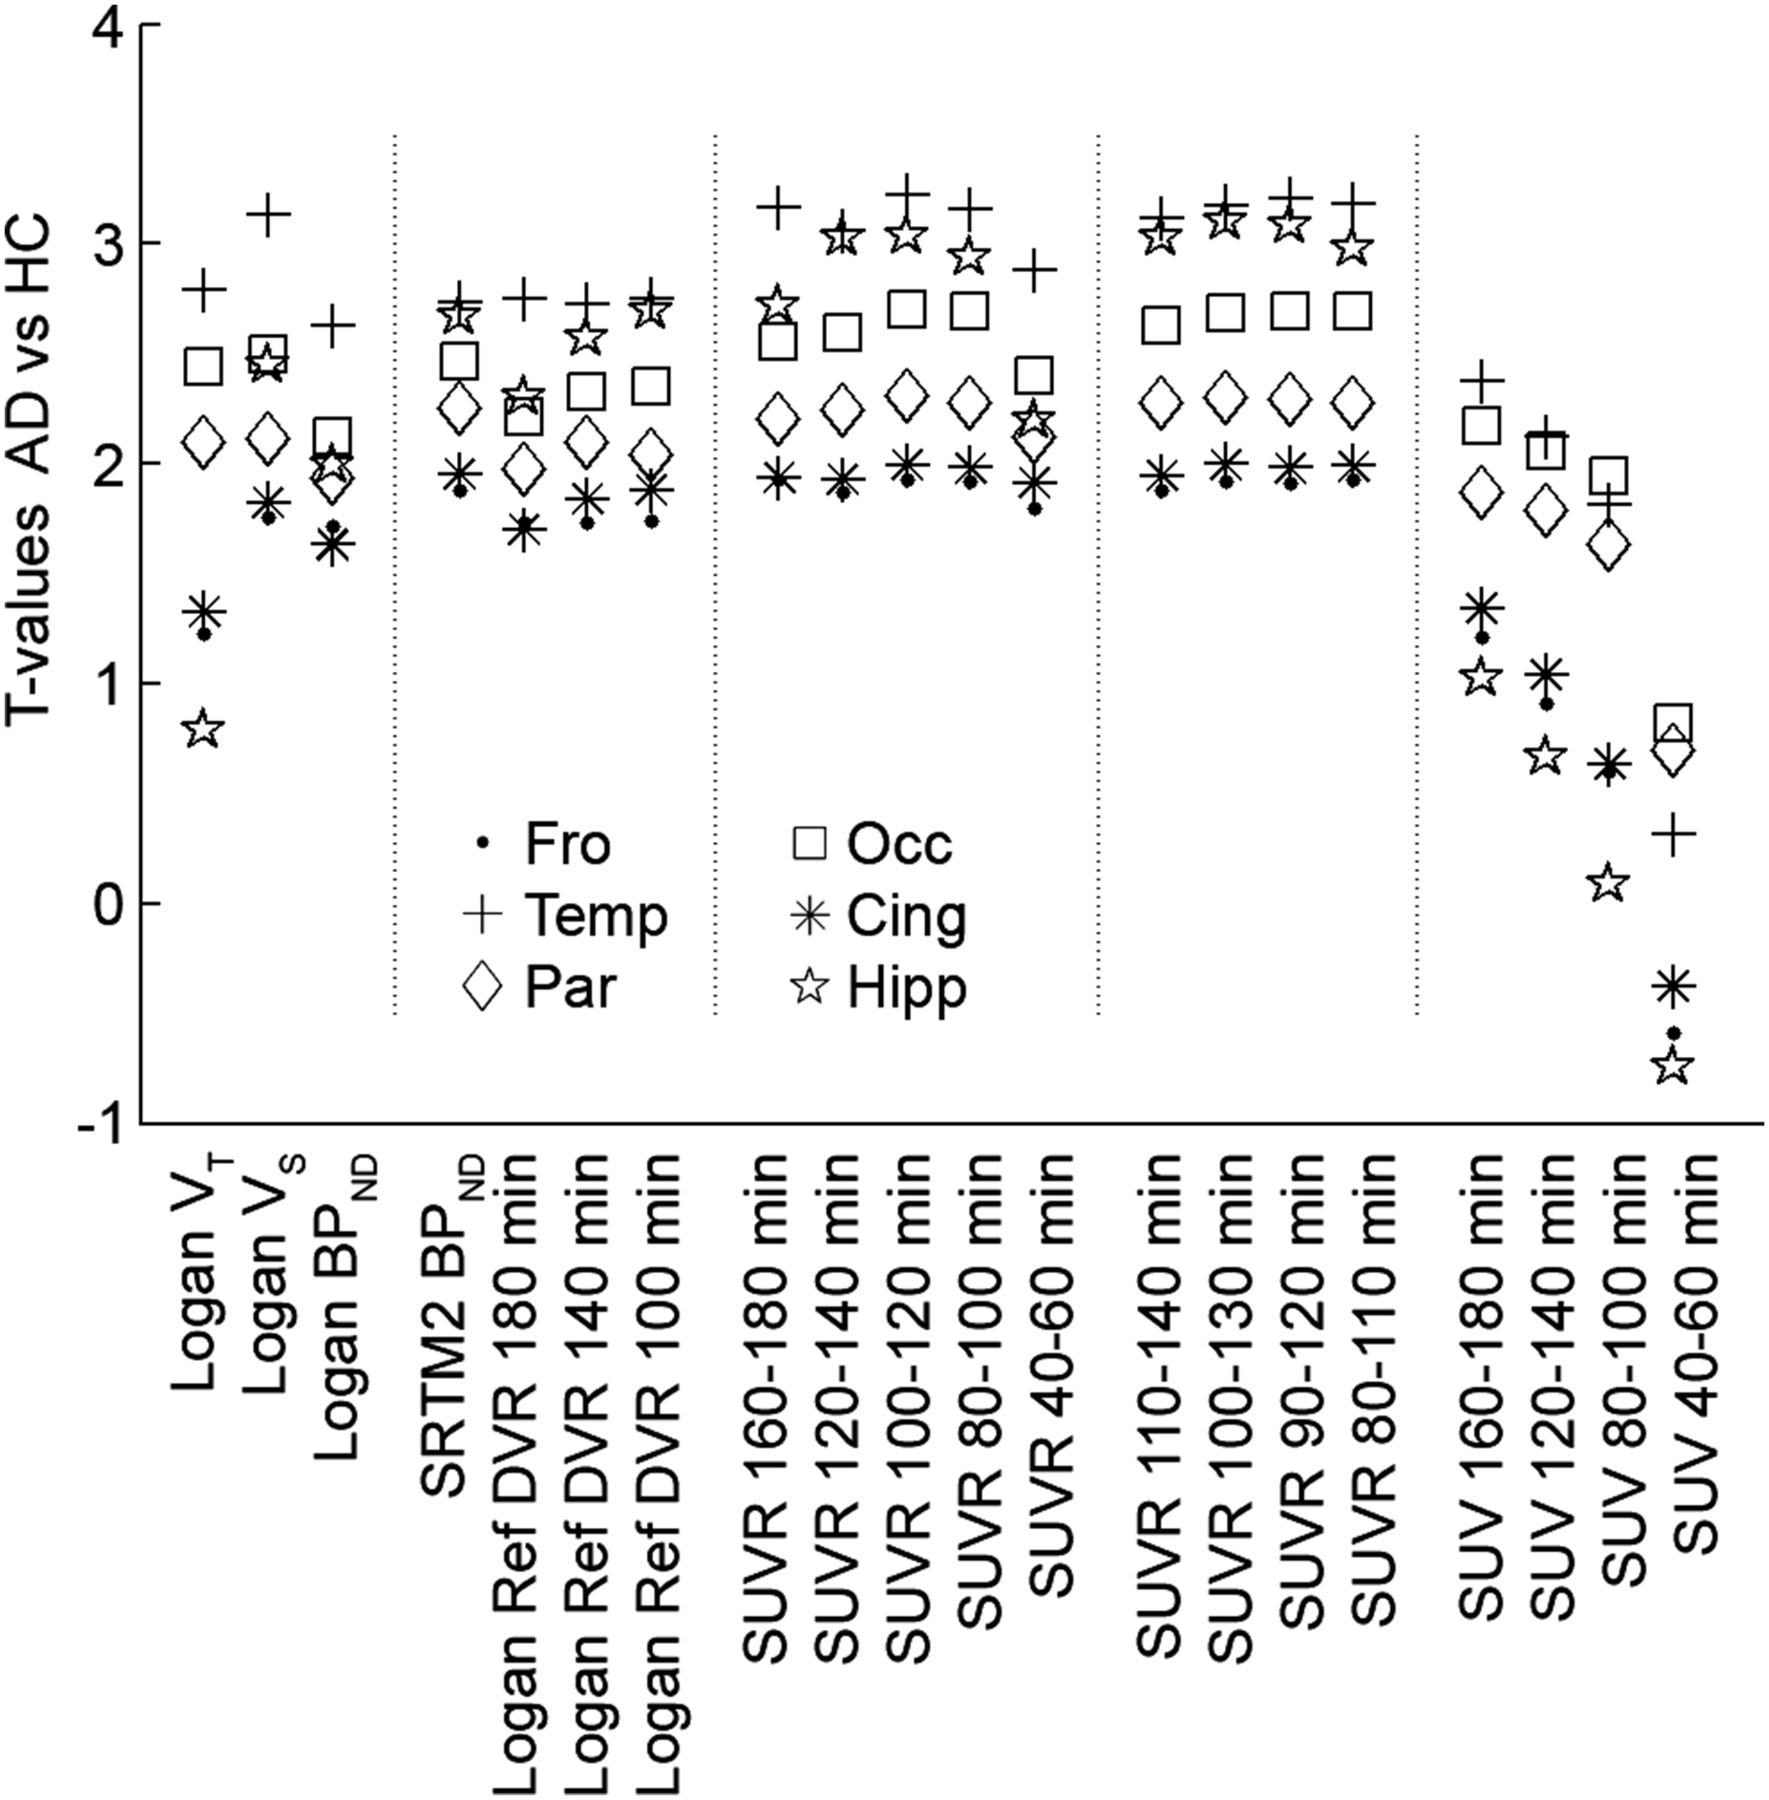
Assessing group differences between AD patients and HCs in cortical regions showed the best separation for Logan VS and SUVR 80–100 min (Fig. 5). The SRTM2 and Logan reference region models performed almost equally well, whereas SUV methods yielded only differences for selected brain regions.

18F-AV-1451 binding differences between AD patients and controls compared across different quantification methods. t values were computed because differences in absolute values of various outcome parameters are normalized by their variance. Strongest differences were obtained for arterial-based Logan plot VS and SUVR 100–120 min. Cing = cingulate; Fro = frontal; Hipp = hippocampus; Occ = occipital; Par = parietal; Temp = temporal.
Voxelwise quantification confirmed increased binding in AD for Logan plot VT as well as Logan reference plot DVR and SUVR, but only to a lesser extent for SUV (Fig. 6).

Voxelwise quantification of 18F-AV-1451 binding in 1 patient with AD and 1 HC. Quantification was performed with arterial-based (VT, 180 min) and reference Logan plots (DVR, 100 min), ratios between target and cerebellar activities (SUVR, 80–100 min), and injected dose per kg of body weight (SUV, 80–100 min). Except for SUV, which underestimated binding, all approaches showed increased binding in patient in various cortical brain regions.
DISCUSSION
We evaluated various strategies for quantification of tau binding with the radioligand 18F-AV-1451. Tissue compartment models did not describe the kinetics appropriately, whereas the Logan plot yielded excellent fits and low parameter variance. Reference region models as well as SUVR gave strong agreement with the Logan plot.
We observed that none of the compartment models was able to describe the kinetics of 18F-AV-1451, with 33%–53% modeling failures in the cortex and 80% in the subcortical regions. Still, it is possible that more complex compartmental configurations may yield better fits; however, such approaches often come at the expense of increased parameter variance. Because no indications were found that parameter coupling alone or metabolites would explain the lack of compartment model fits, future studies are required to clarify this issue. We propose binding estimates from the Logan plot as the currently best arterial-based solution. In line, usage of graphical analyses has been suggested for the quantification of 11C-PBB3 tau binding (9) and 11C-PiB amyloid binding (30). For 11C-PBB3, the lack of adequate fits with compartment modeling may be ascribed to radiometabolites entering the brain (9). Conversely, good 2TCM fits were obtained for (S)-18F-THK5117, but the corresponding outcome parameters could not be robustly identified, hence, simplified methods were also evaluated with reference to the arterial-based Logan plot (10).
A prerequisite for calculation of Logan plot VS is that a reference region is available, as for the above-mentioned ligands (9,30). Here, the cerebellar gray matter was assumed to be devoid of target protein and hence represent only nonspecific binding. Although a blocking study would be required to validate the assumption in vivo (31,32), strong support comes from various findings. First, no specific AV-1451 binding was observed in the cerebellum postmortem across a wide range of clinical populations and methods (26,33). Furthermore, we add in vivo data, showing that cerebellar kinetics were equal to those of the cortical areas in HCs, all presumably devoid of paired helical filament (PHF) tau. Nevertheless, average cerebellar VT obtained from the arterial-based Logan plot was higher in controls than patient groups, which is unlikely to represent specific tau binding as for reasons above. Rather, the increased cerebellar VT might be attributable to physiologic variation or potential off-target binding. Use of VT as an outcome parameter is, however, not sensitive to detect whether group differences are attributable to changes in VS or VND (nondisplaceable volume of distribution). Assuming that VND is constant across the brain, it is informative to account for such differences by deriving VS or DVR. Although various other secondary binding sites have been excluded (13), it seems that 18F-AV-1451 binds to some extent to factors present in neuromelanin- and melanin-containing cells (26). The potential off-target binding may also be reflected in the higher in vivo retention in the basal ganglia (8,15,16,26), which was recently linked to iron content (34). This was particularly prominent in the HC group, with the putamen showing higher SUV and SUVR than any other brain region. Further, in AD patients kinetics of the putamen were markedly different from cortical areas known to be affected by tau aggregates. These findings indicate that 18F-AV-1451 binding in the putamen is not related to PHF tau but caused by yet unknown mechanisms potentially involving a secondary binding site. On the other hand, the present results of cortical 18F-AV-1451 binding in AD reflects autoradiography (26) and human imaging data (supplemental materials) (15).
We observed slightly increased cortical binding in CBS but not PSP patients. This fits with postmortem data because both groups exhibit the straight filament (2,35), and AV-1451 binds only to a lesser extent to this isoform (17). The remaining in vivo difference observed here may thus be related to other characteristics, such as binding to astrocytic plaques (CBS) and tufted astrocytes (PSP) (2,35) as well as no (PSP), intermediate (CBS), and strong binding to N-terminal tau parts (AD) (36). On the other hand, the present results of 18F-AV-1451 binding in AD reflects autoradiography (17) and human imaging data (10), where higher binding in parietal and occipital cortices is presumably attributable to PHF-containing neurites in addition to PHF tangles (17,37). Notably, (S)-18F-THK5117 showed a rather different topology, with highest binding in the amygdala, temporal, and frontal regions (23), indicating that this compound may bind only to PHF tangles but not PHF-containing neurites. The potential consequences of the regionally different binding between the ligands with respect to diagnosis and outcome still remain to be evaluated.
The results from this work may also have clinical implications. Simplified analyses showed strong agreement of reference region–based BPND and DVR as well as SUVR when compared with the arterial-based Logan plot. As expected, longer scan times show better agreement, but strong correlations were already observed for 100 min (R2 > 0.9), indicating that reliable results can be obtained with shorter scans. For SUVR, the interval 80–100 min seems to provide a robust simplification, which can be realized by a 20-min static scan without blood sampling. This protocol may offer examination of several consecutive patients with a single synthesis followed by simple analysis of calculating ratios. Accordingly, similar differences between AD patients and controls (t values) for the ratio methods and arterial-based Logan plot were observed. Despite the steady increase of SUVR across time in AD patients, the t values did not increase for longer time intervals, because also the variance in AD increased. Hence, the increase in absolute SUVR seems only to affect slope and intercept when compared with the arterial-based Logan plot. Still, a larger patient cohort is required to assess whether the SUVR obtained from 80 to 100 min is sufficient for clinical evaluation, especially as a prognostic marker. Finally, SUV cannot be recommended for clinical evaluation because of high unexplained variance when compared with the arterial-based Logan plot. This was reflected in the underestimated differences between AD patients and controls for various brain regions.
One limitation of this study is the low sample size. However, as the pharmacokinetic characteristics were rather uniform within groups, the data at hand seem to be representative for a methodologic evaluation. Furthermore, we were not aiming to infer statistical differences between groups but rather to identify optimal quantification strategies. The sample size is similar to previous methodologic work, which focused on quantitative characterization of novel radioligands (21,30,31). Another aspect is that no partial-volume correction was performed. Tissue loss may indeed alter the absolute values of the outcome parameters, but because tracer kinetics are not affected, the data seem representative for the evaluation of a quantitative description.
CONCLUSION
The Logan plot is the method of choice for input function–based quantification of 18F-AV-1451 binding. When the cerebellum is used as a reference region, simplified techniques can be used, potentially offering clinical applicability with a static scan at 80–100 min and ratio methods. Compared with HCs, these approaches showed higher in vivo binding for AD and to some extent also for CBS patients.
DISCLOSURE
Work in the authors’ laboratory was supported by the European Research Council, the Swedish Research Council, the Strategic Research Area MultiPark (Multidisciplinary Research in Parkinson’s disease) at Lund University, the Crafoord Foundation, the Swedish Brain Foundation, the Skåne University Hospital Foundation, the Swedish Alzheimer Association, and the Swedish federal government under the ALF agreement. Funding sources had no role in the design and conduct of the study; in the collection, analysis, or interpretation of the data; or in the preparation, review, or approval of the manuscript. The precursor of AV-1451 was generously provided by Avid Radiopharmaceuticals. No other potential conflict of interest relevant to this article was reported.
Acknowledgments
We thank our participating subjects and their families. We are grateful to research nurses Katarina Johansson, Karin Nilsson, and Cecilia Dahl; Drs. Anna Svenningsson, Alva Månsten, and Sofie Mårtensson; and PET technicians Irene Erlandsson, Linda Lim, and Eva Nilsson. We thank Drs. David Brooks, Per Borghammer, and Peter Parbo at Aarhus PET center, Aarhus University, Denmark, for teaching arterial blood sampling.
Footnotes
↵* Contributed equally to this work.
Published online Oct. 20, 2016.
- © 2017 by the Society of Nuclear Medicine and Molecular Imaging.
REFERENCES
- Received for publication February 22, 2016.
- Accepted for publication September 8, 2016.


Jump to section
Related Articles
Cited By...
- A Comprehensive Head-to-Head Comparison of Key Plasma Phosphorylated Tau 217 Biomarker Tests
- The RSNA QIBA Profile for Amyloid PET as an Imaging Biomarker for Cerebral Amyloid Quantification
- Patient-centered connectivity-based prediction of tau pathology spread in Alzheimers disease
- Cerebrospinal fluid p-tau217 performs better than p-tau181 as a biomarker of Alzheimers disease
- The implications of different approaches to define AT(N) in Alzheimer disease
- Evaluation of 18F-RO-948 PET for Quantitative Assessment of Tau Accumulation in the Human Brain
- Comparing 18F-AV-1451 with CSF t-tau and p-tau for diagnosis of Alzheimer disease
- In vivo retention of 18F-AV-1451 in corticobasal syndrome