


Abstract
Since the discovery of the HTT gene in 1993, numerous animal models have been developed to study the progression of Huntington disease (HD) and to evaluate potential new therapeutics. In the present study, we used small-animal PET to characterize the expression of molecular targets in the recently reported HD animal model, the zQ175 mouse model. Methods: Male heterozygous zQ175 (Htttm1Mfc/190JChdi, CHDI-81003003) and wild-type (WT, C57BL/6J) animals were imaged with the dopamine D2 receptor radioligand 11C-raclopride, the PDE10A radioligand 18F-MNI-659, the dopamine D1 receptor radioligand 11C-NNC 112, and the 5-HT2A radioligand 11C-MDL 100907 at 6 and 9 mo of age. The outcome measure was the binding potential (BPND), using the cerebellum as the reference region. Selected regions of interest were the striatum for all radioligands and additionally the striatum, rostral cortex, caudal cortex, and hippocampus for 11C-NNC 112 and 11C-MDL 100907. Results: At 6 mo of age, the BPND in the striatum was lower in zQ175 than WT animals by 40% for 11C-raclopride, by 52% for 18F-MNI-659, by 28% for 11C-NNC, and by 11% for 11C-MDL 100907. In the rostral cortex, D1 receptor binding was 22% lower in zQ175 than WT animals. We found an overall reduction in D1 and 5-HT2A binding in the hippocampus of zQ175 compared with WT animals. The BPND of 11C-MDL 100907 in the caudal cortex was also lower in zQ175 WT animals. At 9 mo, there was a slight further reduction of D1, D2, and 5-HT2A BPND in the striatum, whereas PDE10A reached a plateau. Cortical markers were also slightly further decreased at 9 mo in zQ175 animals. Conclusion: Our study indicates a marked reduction of ligand binding to D1 and D2 and 5-HT2A receptors as well as loss of PDE10A enzyme in the striatum of zQ175 mice as compared with WT animals, in agreement with data obtained in clinical PET studies of patients with HD. The zQ175 mouse model recapitulates the expression pattern seen in humans with HD and may have value in further elucidating pathophysiologic events and therapeutic strategies.
Huntington disease (HD) is a neurodegenerative genetic disorder, characterized by progressive loss of medium spiny neurons in the striatum. The disease is caused by expansion of the CAG-repeat in exon 1 in the coding gene for the protein huntingtin (HTT) on chromosome 4 (1). To date, no disease-modifying therapies are available for HD. Developing novel effective therapies for HD will require a clearer understanding of the underlying disease pathophysiology. Several studies suggest that changes in the brain occur years before onset of disease symptoms, and abnormalities in the brain, mainly in the striatum, have been demonstrated even during the premanifest stage of the disease (2–4). Several neurotransmitter systems and enzymes have been suggested to be affected in HD such as the dopamine system (5–8), the phosphodiesterase 10 A (PDE10A) enzyme (9–11), and the serotonin system (12–14).
Since the discovery of the HTT gene in 1993, numerous genetically modified animal models for HD have been developed. A recently reported animal model for HD is the zQ175 knock-in model that shows motor, cognitive, molecular, and electrophysiologic abnormalities and decreased body weight (15,16). The zQ175 animals, similar to HD patients, show altered messenger RNA expression levels in the striatum in genes such as D2 receptor, PDE10A, the cannabinoid receptor-1, and dopamine-and cyclic-AMP–regulated phosphoprotein (DARPP32) as well increased striatal atrophy and reduced cortical thickness (15–17).
To further characterize the zQ175 mouse model, we evaluated changes in neuroreceptor systems relevant for the progression of HD using small-animal PET in heterozygous zQ175 and wild-type (WT) mice. We imaged 6- and 9-mo-old heterozygous zQ175 and WT mice with radioligands specific for the D2/D3 receptor 11C-raclopride, PDE10A 18F-MNI-659, D1 receptor 11C-NNC 112, and 5-HT2A receptor 11C-MDL 100907. The overall aim was to evaluate zQ175 mice as an animal model for HD and, more importantly, to find the most appropriate imaging biomarker to assess the efficacy of novel experimental therapies aimed at lowering mutant HTT.
MATERIALS AND METHODS
Animals
WT (C57BL/6J) and heterozygous zQ175 (Htttm1Mfc/190JChdi, CHDI-81003003 (16)) male mice were obtained from The Jackson Laboratory. Genotyping and CAG repeat count were determined by Laragen Inc. Animals were housed in groups, and the experiments were performed in accordance with the guidelines of the Swedish National Board of Laboratory Animals under protocols approved by the Animal Ethics Review Board of Northern Stockholm, Sweden (N558/11). More information regarding the animals is provided in the supplemental materials (available at http://jnm.snmjournals.org).
Radiosynthesis
All radioligands were synthesized at Karolinska Institutet PET Centre. 11C-raclopride was synthesized as described earlier (18) by methylation of the desmethyl precursor analog using 11C-methyl triflate. The labeling yield was 50%–70%, and the radiochemical purity was greater than 99%. Synthesis of 18F-MNI-659 was accomplished by reacting 18F-fluoride ion with the MNI-659 labeling precursor (5–6 mg [0.007–0,009 mmol] in dimethyl sulfoxide [600 μL]), followed by purification and formulation into a solution containing propyleneglycol, ethanol, and phosphate-buffered saline solution as previously described (19). Radiochemical purity was greater than 98%, and labeling yield was 10%–25%. 11C-NNC 112 was prepared by N-methylation of the precursor using 11C-methyl triflate as previously described (20). The labeling yield was 70%–90%, and the radiochemical purity was greater than 99%. Finally, 11C-MDL 100907 was labeled as described earlier (21) in its 3-methoxy position using 11C-methyl iodide as the labeling agent. The labeling yield was 60%–80%, and the radiochemical purity was greater than 99%.
In Vivo PET Imaging
All PET measurements were performed on the Mediso nanoScan PET/MRI and nanoScan PET/CT preclinical imaging systems (22,23). The 2 systems have identical PET performance (22) and were calibrated to provide consistent results. Genotypes were divided equally between the 2 PET systems. On the experiment day, the animal was anesthetized with inhalation of 4%–5% of isoflurane. After induction of anesthesia, the isoflurane concentration was lowered to 1.5%–2%, and the animal was positioned in the scanner. A 63-min (11C-raclopride and 18F-MNI-659) or 93-min (11C-NNC 112 and 11C-MDL 100907) dynamic PET measurement was initiated immediately on intravenous injection of the radioligand. Data on the weight of the animals, injected radioactivity levels, and injected mass for each radioligand at each time point are displayed in Supplemental Table 1. Each animal was imaged twice, with 2 different radioligands at 6 and 9 mo of age. The animals were imaged in the same PET system at both time points.
Image and Statistical Analysis
The image data files were reconstructed with a maximum-likelihood expectation maximization algorithm (20 iterations) and a 0.3 × 0.3 × 0.3 mm voxel size. The individual PET images were manually coregistered to the inbuilt MRI mouse template using PMOD software (version 3.4; PMOD Technologies). All the related image data analysis was performed with PMOD. For delineation of the regions of interest (ROIs), we used the inbuilt ROI template for the mouse available in PMOD. The ROI template for the cortex was modified to separate the rostral and caudal part at approximately Bregma − 3 mm (Supplemental Fig. 1). The division was chosen to have a more caudal part of the cortex, which would be less prone to spill-in from the high-activity striatal region due to partial-volume effects. The main outcome measure was binding potential (BPND). BPND was calculated in the striatum for 11C-raclopride and 18F-MNI-659 and in the striatum, rostral cortex, caudal cortex, and hippocampus for 11C-MDL 100907 using the simplified reference tissue model (24). For 11C-NNC 112, the BPND was calculated in the striatum, rostral cortex, caudal cortex, and hippocampus using the noninvasive version of the Logan linear graphic method (25) because the simplified reference tissue model proved to be unreliable to estimate BPND due to slow kinetics in the striatum. In the Logan linear graphic method, a linear phase was obtained from 33 min for the striatum and cortical regions. This method yielded reliable estimates of BPND for all regions studied. For all radioligands, the BPND was calculated using the cerebellum as the reference region. The difference between WT and zQ175 was analyzed with repeated-measures ANOVA (with strain and age as factors) using SPSS Statistics for Windows (version 22.0; IBM). If the repeated-measures ANOVA showed a statistically significant difference between zQ175 and WT, a t test was run at 6 and 9 mo, respectively, to investigate the difference at each time point. Only those animals that were imaged during both time points (6 and 9 mo of age) were included in the repeated-measures ANOVA.
RESULTS
Imaging Dopamine D2/D3 System Using 11C-Raclopride
The average %SUV images, obtained with 11C-raclopride, showed lower D2/D3 receptor binding in zQ175 mice than in WT animals at 6 and 9 mo (Fig. 1A). A repeated-measures ANOVA showed a statistically significant difference in the BPND between the WT and zQ175 mice (F1,26 = 305.7; P < 0.001, Fig. 1B). The difference in BPND of 11C-raclopride was 40% at 6 mo of age and 44% at 9 mo of age. There was an age-related reduction in raclopride binding (F1,26 = 37.29; P < 0.001), an effect independent of strain (F1,26 = 0.16; P > 0.05). At 9 mo, the BPND in the WT was 11% lower than at 6 mo, and in the zQ175 this difference was 16% (Fig. 1B). Average BPND values for 6 and 9 mo in both WT and zQ175 are shown in Supplemental Table 2.

(A) Average 11C-raclopride (D2/D3 receptor radioligand) %SUV images of 6- and 9-mo-old WT and zQ175 mice. PET measurement averaged from 15 to 63 min is shown in top row, and coregistered PET to template MR image is shown in bottom row. (B) BPND of 11C-raclopride in striatum is shown. Values are expressed as mean ± SD. ***P < 0.001, n = 14/group. M = mo.
Imaging PDE10A Enzyme Using 18F-MNI-659
Average %SUV images of 18F-MNI-659 are displayed in Figure 2A (6- and 9-mo-old WT and zQ175 mice). Repeated-measure ANOVA showed a statistically significant difference between the WT and zQ175 mice (F1,26 = 26.62; P < 0.001, Fig. 2B). The difference of 18F-MNI-659 BPND between zQ175 and WT animals was 52% at 6 mo of age and 41% at 9 mo of age. There was no statistically significant change in 18F-MNI-659 binding between the 2 time points (F1,26 = 0.18; P > 0.05), an effect observed in both strains (F1,26 = 1.39; P > 0.05, Fig. 2B). Average BPND values for 6 and 9 mo in both WT and zQ175 are shown in Supplemental Table 2.

(A) Average 18F-MNI-659 (PDE10A enzyme radioligand) %SUV images of 6- and 9-mo-old WT and zQ175 mice. PET measurement averaged from 15 to 63 min is shown in top row, and coregistered PET to template MR image is shown in bottom row. (B) BPND of 18F-MNI-659 in striatum at 6 and 9 mo of age is shown. Values are expressed as mean ± SD. ***P < 0.001, n = 14/group. M = mo; n.s. = not significant.
Imaging D1 Receptors Using 11C-NNC 112
Average %SUV images, obtained with 11C-NNC 112, are displayed in Figure 3A. Repeated-measures ANOVA was performed, and at 6 mo of age there was a 28% difference in BPND in the striatum between WT and zQ175, and at 9 mo of age the difference had increased to 34% (F1,26 = 19.71; P < 0.001, Fig. 3B). In the rostral cortex, at 6 mo of age, a 22% lower BPND was found in the zQ175 as compared with WT animals, and at 9 mo the difference between the 2 strains was 23% (F1,26 = 22.43; P < 0.001, Fig. 3B). Also in the hippocampus, a statistically significant difference between zQ175 and WT was found (F1,26 = 5.27; P < 0.05). The t test at each time point showed a statistically significant difference between the 2 strains at 9 mo (P < 0.05) but not at 6 mo (P > 0.05). There was no statistically significant difference between WT and zQ175 in the caudal cortex (F1,26 = 2.19; P > 0.05). We observed a significant decrease in 11C-NNC 112 binding between the 2 time points in the rostral cortex (F1,26 = 29.07; P < 0.001), caudal cortex (F1,26 = 30.51; P < 0.001), and hippocampus (F1,26 = 13.74; P < 0.001), an effect independent of strain (rostral cortex: F1,26 = 0.35, P > 0.05; caudal cortex: F1,26 = 1.01, P > 0.05; hippocampus: F1,26 = 2.21, P > 0.05; Fig. 3B). Mean values of BPND in the striatum, rostral cortex, caudal cortex, and hippocampus are shown in Supplemental Table 2.
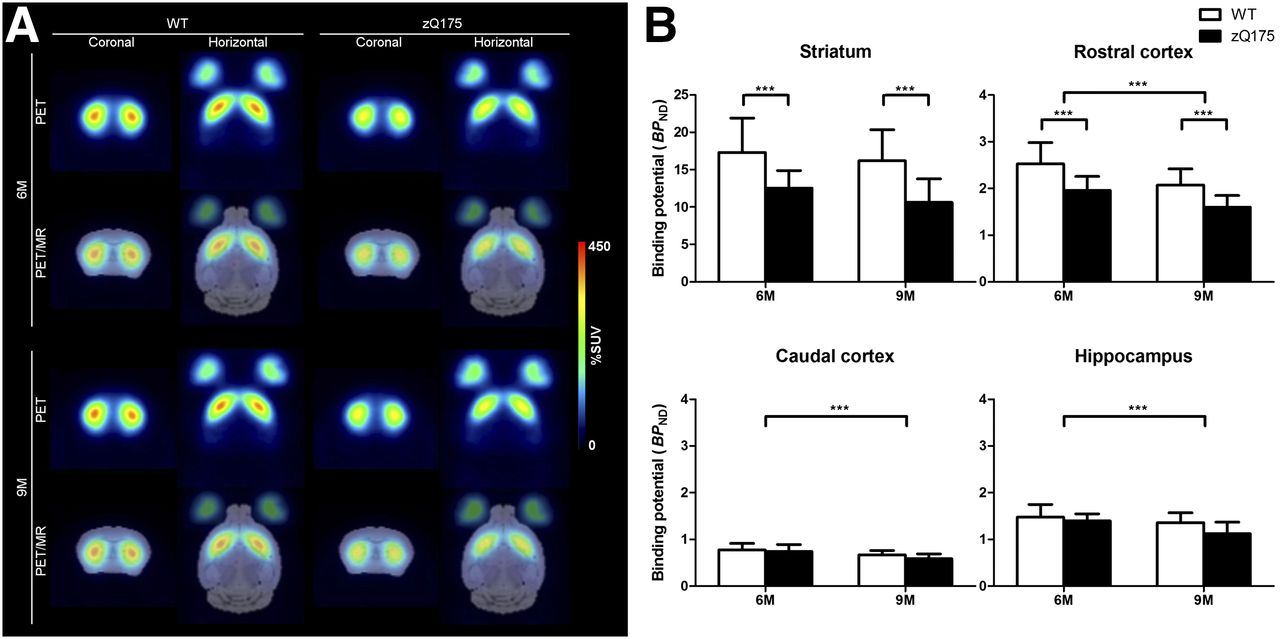
(A) Average 11C-NNC 112 (D1 receptor radioligand) %SUV images of 6- and 9-mo-old WT and zQ175 mice. PET measurement averaged from 36 to 93 min is shown (rows 1 and 3), and coregistered PET to template MR image is also shown (rows 2 and 4). (B) BPND of 11C-NNC 112 in striatum, rostral cortex, caudal cortex, and hippocampus in 6- and 9-mo-old WT and zQ175 mice is shown. Values are expressed as mean ± SD. ***P < 0.001. WT, n = 15; zQ175, n = 13. M = mo.
Imaging 5-HT2A Receptors Using 11C-MDL 100907
Average %SUV images, obtained with 11C-MDL 100907, are displayed in Figure 4A. Repeated-measures ANOVA showed statistically significant differences between WT and zQ175 in the striatum (F1,24 = 10.82; P < 0.001), caudal cortex (F1,24 = 6.04; P < 0.05), and hippocampus (F1,24 = 10.85; P < 0.001; Fig. 4B). The BPND in the striatum of zQ175 animals was 11% lower than that in WT at 6 mo of age and 20% lower at 9 mo of age. In the caudal cortex, the difference between the 2 strains was 9% at 6 mo and 18% at 9 mo. Finally, in the hippocampus, the zQ175 mice displayed a 15% lower BPND at 6 mo than the WT mice, and the difference between the 2 groups was 20% at 9 mo. There was an overall statistically significant decrease in the BPND of 11C-MDL 100907 at 9 mo compared with 6 mo in all regions examined (striatum: F1,24 = 62.8, P < 0.001; rostral cortex: F1,24 = 42.67, P < 0.001; caudal cortex: F1,24 = 55.09, P < 0.001; and hippocampus: F1,24 = 48.84, P < 0.001). This decrease was seen in both WT and zQ175 animals, with no statistically significant interaction effect (striatum: F1,24 = 2.951, P > 0.05; rostral cortex: F1,24 = 0.071, P > 0.05; caudal cortex: F1,24 = 1.782, P > 0.05; and hippocampus: F1,24 = 0.0089, P > 0.05; Fig, 4B). Mean values of BPND in the striatum, rostral cortex, caudal cortex, and hippocampus are shown in Supplemental Table 2.
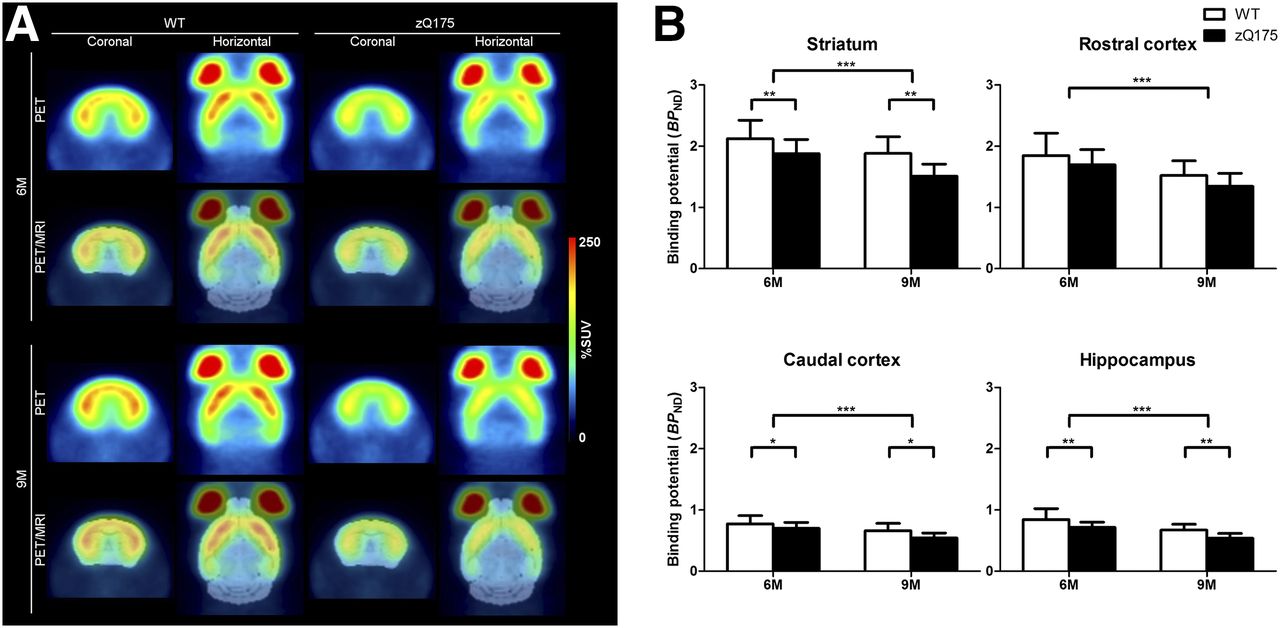
(A) Average 11C-MDL 100907 (5-HT2A receptor radioligand) %SUV images of 6- and 9-mo-old WT and zQ175 mice. PET measurement averaged from 36 to 93 min is shown (rows 1 and 3), and coregistered PET to template MR image is also shown (rows 2 and 4). (B) BPND of 11C-MDL 100907 in striatum, rostral cortex, caudal cortex, and hippocampus in 6- and 9-mo-old WT and zQ175 mice is shown. Values are expressed as mean ± SD. *P < 0.05. **P < 0.01. ***P < 0.001. WT, n = 14; zQ175, n = 12. M = mo.
DISCUSSION
We used in vivo small-animal PET imaging to further characterize the zQ175 heterozygous mouse as a model for HD by investigating whether the changes in the brain could be used either as potential translational biomarkers for disease progression studies or to evaluate the effect of HTT-lowering therapeutic agents or other disease-modification treatments. In the striatum, the zQ175 animals showed lower BPND with all radioligands used in the present study. In extrastriatal regions, the zQ175 mice had a lower D1 receptor binding in the rostral cortex and hippocampus as well as lower 5-HT2A binding in the caudal cortex and hippocampus. These results suggest that the animals showed alterations in the D1, D2, and 5-HT2A receptor systems as well as lower levels of PDE10 enzyme, all in accordance with findings in patients (6,7,9,11,13,26).
Dopamine D1 and D2 Receptors
The observed loss of D1 and D2 receptor availability in the striatum of zQ175 mice is in line with the results previously reported in HD patients (5–8,27). The reduced availability of the D1 and D2 receptors is correlated with increasing illness duration (6) and worse cognitive performance (27). Changes in the D1 and D2 receptors have also been observed during the premanifest phase of the disease in HD gene carriers (2,8), correlating both with cognitive performance (28) and with Unified Huntington’s Disease Rating Scale motor scores (29).
The dopamine D1 receptors are also highly expressed in other brain regions, such as the cortex and hippocampus (30–32). We found that zQ175 mice had lower D1 receptor binding in the rostral cortex and hippocampus than WT animals. Reduction of cortical D1 receptor availability has also been reported in HD patients (6), suggesting that the D1 receptor could be a useful translational imaging marker for extrastriatal areas in zQ175 mice.
One limitation of using 11C-NNC 112 for imaging of the D1 receptors is that it binds both dopamine D1 receptors and serotonin 5-HT2A receptors in the cortex (33,34). 11C- NNC 112 has a 5- to 10-fold selectivity for D1 over 5-HT2A in vivo; however, because the density of the 5-HT2A is about twice that of D1 receptors in the cortex (35), part of the BPND of 11C-NNC 112 in the cortex could stem from 5-HT2A receptor binding. Care should therefore be taken in the interpretation of the results from 11C-NNC 112 in cortical areas.
We found a reduction in D1 and D2 dopamine receptor availability with age in both WT and zQ175 mice. There was no statistically significant difference between the 2 strains in age-related decline of BPND of either 11C-raclopride or 11C-NNC 112. An age-related decrease of D1 and D2 receptors is also seen in humans (36–39), with an approximate decline of 4%–9% per decade. Whether the age-related decline is more profound in HD patients than in healthy individuals is not clear; a 2-y follow-up study did not find a significantly higher rate of decline in the BPND of 11C-raclopride in presymptomatic HD gene carriers (2.6% decline per year) than controls (1.8% decline per year) (40), a result in accordance with our findings in the zQ175 mice. However, manifest HD patients have been reported to show a progressive loss of D2 receptors, with an average decline of 5% per year (41).
Role of PDE10A
In the current study, we found a decrease in the BPND of 18F-MNI-659 in the zQ175 mice compared with WT mice at both 6 and 9 mo of age. This is in line with recent human PET studies reporting a 50% reduction of binding of the PDE10A enzyme in the striatum of HD patients compared with controls (9,11). Additionally, a 70%–80% reduction in PDE10A BPND by 12 wk of age in the R6/2 HD mouse model compared with WT has been reported using another PET radioligand for PDE10A, 18F-JNJ42259152 (42).
In the zQ175 mice, we found no further decrease in BPND of 18F-MNI-659 at 9 mo compared with 6 mo, suggesting a plateau. These results agree with the previously reported 50% reduction in PDE10A messenger RNA levels in the zQ175 mice at 18 wk of age as compared with WT animals, with no further decrease at 41 wk of age (16). To our knowledge, there are no published data regarding the effect of aging on PDE10A in humans, but unpublished data from our research groups suggest that there is a significant negative correlation between age and BPND of 18F-MNI-659. However, these age-related changes are only significant when an age span of almost 40 y is included. In the present study, we used 6- and 9-mo-old mice, and the lack of age effect in both zQ175 and WT animals may be due to their relatively young age and the short interval between the 2 PET measurements.
Serotonin 5-HT2A Receptors
Cortical pathology is also evident in HD (43). To evaluate a potential imaging target for the cortex, we used 11C-MDL 100907, a PET radioligand developed for imaging the 5-HT2A receptor (21,44). Postmortem autoradiography studies have shown reduced serotonin receptor binding in HD brains (12,13,26,45). In the present study, we found a statistically significant reduction of 5-HT2A binding in the striatum, caudal cortex, and hippocampus in zQ175 mice as compared with WT animals. The difference between the 2 strains was evident already at 6 mo, with a 9%–15% lower BPND in zQ175 mice, an effect that increased to almost 20% at 9 mo of age.
The highest density of the 5-HT2A receptors in the rodent brain is within lamina V of the cortex and in the claustrum. Additional regions enriched with receptors are the olfactory system, caudate-putamen, nucleus accumbens, and hippocampus (46,47). One challenge when performing small-animal PET imaging, with special regards to the accuracy of quantification, is the resolution of PET. We used the high-resolution nanoScan PET/MR and PET/CT systems (22,23). The mouse cortex is about 1.2 mm thick, which is comparable to the full width at half maximum of the system. We found similar BPND in the striatum and rostral cortex. An autoradiographic study with 3H-MDL 100907 showed a heterogeneous distribution of the 5-HT2A in the caudate-putamen, with a higher density in the more posterior parts (Supplemental Fig. 2). We used the ROI template available in PMOD for delineation of the ROIs, in which the caudate-putamen and nucleus accumbens are merged into 1 region, that is, the striatum. Because of the close proximity of the striatum to the claustrum and also to the lamina V of the cortex (Supplemental Fig. 3), the activity in the striatum could be influenced by partial-volume effect from these 2 regions, leading to a possible overestimation of BPND. Despite a possible bias in the estimation of BPND in the striatum, a similar effect had probably occurred in both strains of the mice, most likely without affecting the differences between WT and zQ175 animals.
CONCLUSION
We show here that zQ175 mice have altered brain biochemistry, that is, reduced availability of the D1, D2, and 5-HT2A receptors, as well as reduced binding to the PDE10A enzyme, in accordance with findings in HD patients. Our study, together with previous behavioral and neurophysiologic studies on the zQ175 mouse model (15,16), supports the utility of using zQ175 mice as an animal model in HD research. In addition, 11C-raclopride, 18F-MNI-659, 11C-NNC 112, and 11C-MDL 100907 are all potential imaging biomarkers to monitor the neurochemical effects of novel experimental therapies in this HD animal model.
DISCLOSURE
This work was supported by the CHDI Foundation. No other potential conflict of interest relevant to this article was reported.
Acknowledgments
Precursor material for 18F-MNI-659 was kindly provided by MNI (Molecular NeuroImaging New Haven). We would also like to express our gratitude to members of the Karolinska PET group for their participation during the PET imaging as well as to the CHDI Foundation for supporting this work.
Footnotes
Published online Nov. 10, 2016.
- © 2017 by the Society of Nuclear Medicine and Molecular Imaging.
REFERENCES
- Received for publication August 1, 2016.
- Accepted for publication October 21, 2016.


Jump to section
Related Articles
Cited By...
- Enhanced Hippocampal Spare Capacity in Q175DN Mice Despite Elevated mHTT Aggregation
- Synaptic Vesicle Glycoprotein 2A Is Affected in the Central Nervous System of Mice with Huntington Disease and in the Brain of a Human with Huntington Disease Postmortem
- A novel imaging ligand as a biomarker for mutant huntingtin-lowering in Huntingtons disease
- Longitudinal Characterization of mGluR5 Using 11C-ABP688 PET Imaging in the Q175 Mouse Model of Huntington Disease