


Abstract
Metabotropic glutamate receptor 5 (mGluR5) represents a potential therapeutic target for Huntington disease. Using 11C-ABP688 (3-(6-methyl-pyridin-2-ylethynyl)-cyclohex-2-enone-O-11C-methyl-oxime), a noncompetitive and highly selective antagonist for mGluR5, we aimed to longitudinally characterize in vivo changes in mGluR5 by means of PET imaging in the Q175 mouse model of Huntington disease. Methods: 11C-ABP688 PET imaging, followed by a CT scan, was performed on 18 heterozygous mice and 18 wild-type (WT) littermates at 3 different time points (6, 9, and 13 mo old). 11C-ABP688 nondisplaceable binding potential (BPND) was calculated for each time point in striatum and cortex using the cerebellum as the reference region. In addition, voxel-based statistical parametric mapping (SPM) analysis was performed on BPND images. Postmortem validation of mGluR5 level and neuronal density was performed on the mice at 6 mo old. Results: The 11C-ABP688 BPND of heterozygous animals was significantly reduced at all time points in the striatum (−13.1%, −13.5%, and −14.2% at 6, 9, and 13 mo, respectively; P < 0.001 for all) and in the cortex (−9.8%, −10.2%, and −10.6%, respectively; P < 0.01 for all), when compared with WT animals. Longitudinal changes in 11C-ABP688 BPND were also found in heterozygous mice, showing a reduction at 13 mo compared with 6 mo (−10.4%, P < 0.05). SPM analysis confirmed reduced BPND in heterozygous compared with WT mice, as well as a time-related decline in 11C-ABP688 binding in the striatum of heterozygous mice. Postmortem analysis confirmed a mGluR5 decrease in both striatum (−36.6%; P < 0.01) and cortex (−16.6%; P < 0.05) in heterozygous mice, whereas no difference in neuronal density was found. Conclusion: In vivo imaging of mGluR5 using 11C-ABP688 PET/CT revealed a marked reduction in ligand binding in the striatum and cortex of heterozygous mice, compared with WT mice, as well as a temporal decline. This study suggests that 11C-ABP688 PET imaging is a potential biomarker to monitor the progression of, and therapeutic strategies for, Huntington disease.
Huntington disease is an autosomal dominant neurodegenerative disorder characterized by a progressive decline in motor function and cognition and the development of psychiatric symptoms (1). The disease is caused by an expanded CAG repeat in exon 1 of the gene encoding the protein huntingtin (2). The main neuropathologic feature in Huntington disease patients is a progressive neuronal cell loss in the caudate–putamen (striatum in rodents) and neocortical regions (3).
Striatal neurons receive input from different areas of the basal ganglia, as well as glutamatergic input from the thalamus and cortex (4). Thus, glutamate is postulated to play an important role in the pathogenesis of Huntington disease (5,6). Stimulation of metabotropic glutamate receptor 5 (mGluR5) results in the formation of inositol 1,4,5-triphosphate and release of intracellular Ca2+ (6,7). Mutated huntingtin (mHTT) enhances this cell-signaling pathway, resulting in toxic levels of intracellular Ca2+ and intensified activation of protein kinase C (7,8). However, mGluR5-positive modulation can induce activation of neuroprotective cell signaling pathways and promote neuronal survival by activating protein kinase B without inducing Ca2+ release (6,9). Accordingly, preclinical studies found that targeting of mGluR5 with positive allosteric modulators has a positive effect on memory and cognitive function (10) as well as on rescuing pharmacologically induced memory impairment (11). Altogether, these findings suggest that mGluR5 has a pivotal role in Huntington disease and the potential to serve as a therapeutic target to treat Huntington disease.
Although several radiotracers have been developed to investigate in vivo changes in mGluR5 level by PET imaging (12), to our knowledge no in vivo studies characterizing mGluR5 level have been conducted on animal models of Huntington disease. PET imaging of mGluR5 provides a noninvasive quantitative measure of receptor expression and can be used as an effective tool to assess the specificity of mGluR5 drugs and to evaluate their efficacy longitudinally. Among the mGluR5 PET radiotracers available, 11C-ABP688 (3-(6-methyl-pyridin-2-ylethynyl)-cyclohex-2-enone-O-11C-methyl-oxime) is a potent one for mGluR5 thanks to its noncompetitive, allosteric, high-affinity, and highly selective properties (13).
In this study, we investigated the ability of 11C-ABP688 to longitudinally characterize mGluR5 level during disease progression at 6, 9, and 13 mo old in the recently reported Q175 knock-in mouse model of Huntington disease (14,15). In addition, we quantified mGluR5 and neuronal density in a satellite cohort of 6-mo-old mice by means of immunohistochemistry. This animal model displays motor, cognitive, molecular, and electrophysiologic abnormalities, including an in vivo temporal decrease in different striatal markers such as dopamine receptors D1 and D2/3, similar to patients with Huntington disease (14–17).
MATERIALS AND METHODS
Animals
Heterozygous 6-mo-old male Q175 knock-in mice (n = 23) containing the mHTT allele with the expanded CAG repeat within the native mouse Huntington gene (14) and age-matched Q175 wild-type littermates (WT, n = 23) were obtained from Jackson Laboratories. Because homozygosity is rare in patients, heterozygous mice were chosen to better resemble the clinical condition. The recently developed Q175 model was preferred over the well-reported R6/2 Huntington disease model given that the former has a slower disease progression that more closely mimics Huntington disease in humans and provides more opportunities for testing disease-modifying therapies. Eighteen animals per genotype were included in the longitudinal study, and 5 separate mice per genotype were sacrificed at 6 mo old for postmortem quantification of mGluR5 and neuronal density. The animals were single-housed in individually ventilated cages under a 12-h light/dark cycle in a temperature- and humidity-controlled environment with food and water ad libitum. Single-housing was required to avoid the development of dominant–subdominant and aggressive behavior. The animals were acclimatized to the facility for at least 1 wk before the start of procedures. All experiments were approved by the Animal Ethics Review Board of the University of Antwerp, Belgium (approval ECD 2014-92). All applicable European Committee Guidelines (decree 2010/63/CEE) and the Animal Welfare Act of the United States (U.S. Code, title 7, chapter 54, section 2131) for the care and use of animals were followed.
Tracer Radiosynthesis
11C-ABP688 was synthesized using an automated module (Carbo Synthon I; Comecer) by reacting of 0.5 mg of desmethyl-ABP688 (E/Z) with 11C-CH3SO3CF3 in 400 μL of acetone in the presence of 10 μL of NaOH, followed by purification and filtration as previously described (13). The average radiochemical purity was 98.40% ± 0.99%, and the specific activity was 75.80 ± 20.41 GBq/μmol.
11C-ABP688 Dynamic Small-Animal PET Scan
PET/CT was performed on 2 Inveon scanners (Siemens Preclinical Solution) when the mice were 6, 9, and 13 mo old. The animals were anesthetized using isoflurane (Forene; Baxter) in medical oxygen (induction, 5%; maintenance, 1.5%), were catheterized in the tail vein for bolus injection of the tracer, and were positioned on the scanner. Respiration and heart rate were constantly monitored using a monitoring acquisition module (Minerve) during the entire scanning period. Body temperature was maintained at 37°C ± 1°C using a feedback-controlled warm-air flow (Minerve).
At the onset of the 60-min dynamic PET scan, the mice were injected with a 12-s bolus of 11C-ABP688 (1 mL/min) using an automated pump (Pump 11 Elite; Harvard Apparatus). Tracer activity was injected keeping the cold dose within tracer conditions (<1.50 μg/kg). PET data were acquired in list mode. Afterward, a 10-min 80-kV/500-μA CT scan was obtained for attenuation and scatter correction. During disease progression, average body weight dropped significantly in heterozygous mice at 9 mo old (−10.0%, P < 0.001) and 13 mo old (−15.8%, P < 0.0001), compared with WT mice (Supplemental Table 1; supplemental materials are available at http://jnm.snmjournals.org). Additional data on the weight of the animals, injected radioactivity levels, injected mass, and number of animals at each time point can be found in Supplemental Table 1.
Image Processing and Analysis
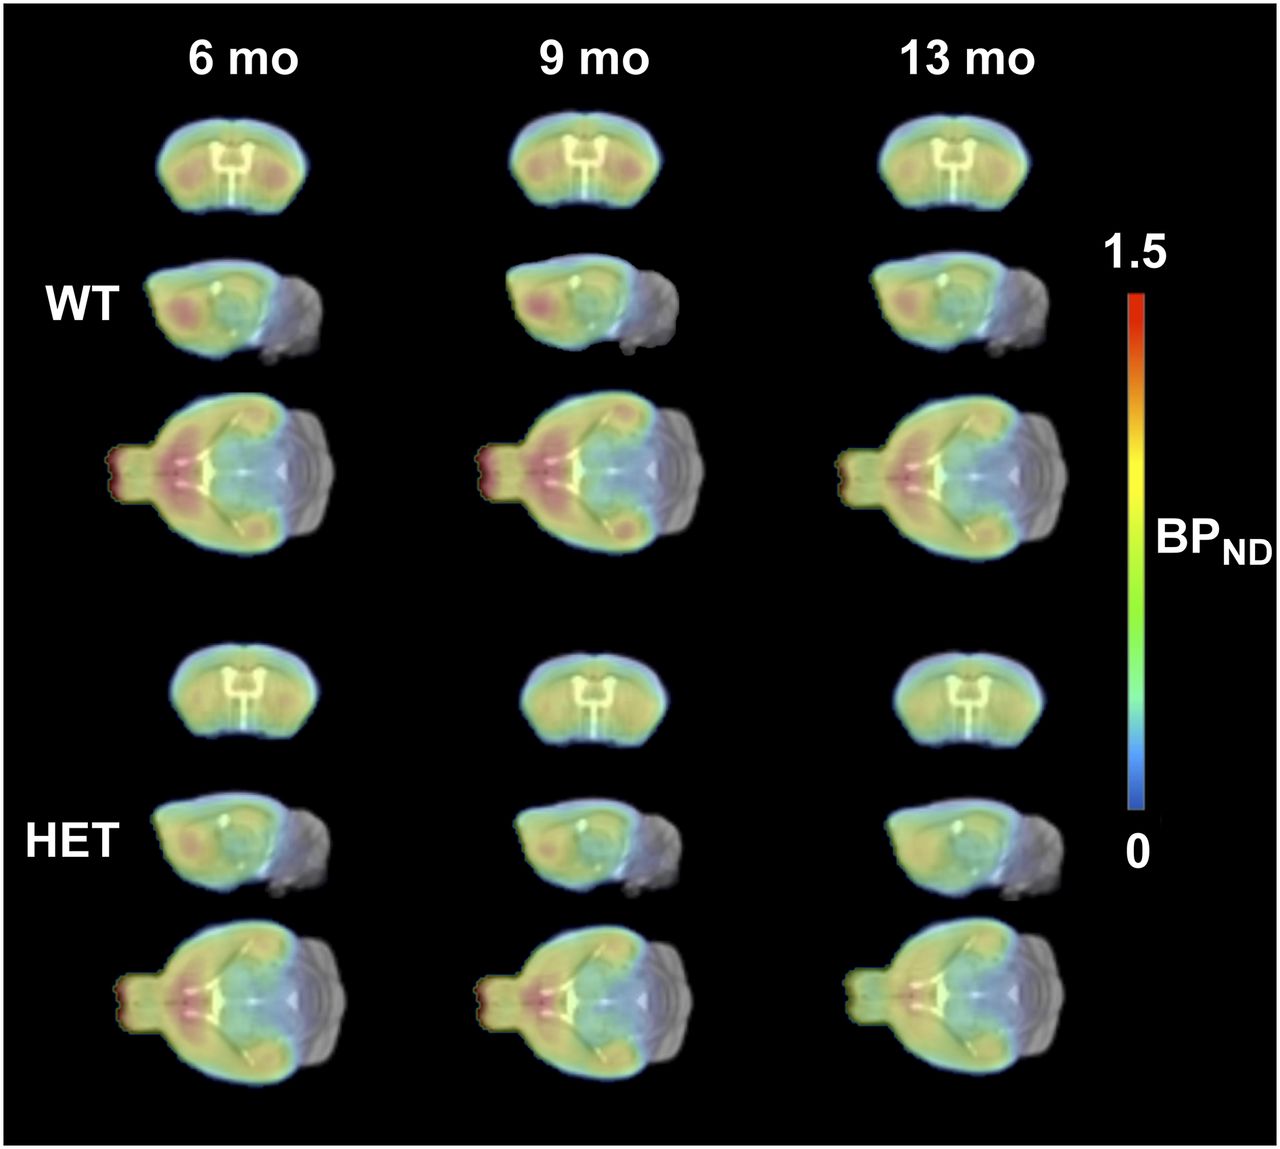
The acquired PET images were charted as histograms and reconstructed into 33 frames of increasing duration (12 × 10 s, 3 × 20 s, 3 × 30 s, 3 × 60 s, 3 × 150 s, and 9 × 300 s). The images were reconstructed using 2-dimensional ordered-subsets expectation maximization with 4 iterations and 16 subsets (18) after Fourier rebinning. Corrections were applied for normalization, dead time, CT-based attenuation, and single-scatter simulation. The image frames were reconstructed on a 128 × 128 × 159 grid with 0.776 × 0.776 × 0.796 mm voxels. The images are group averages (heterozygous and WT) for selected coronal, sagittal, and transversal views of the mouse brain.
PMOD software (version 3.6; PMOD Technologies) was used for any regional and voxel-based analysis of the images. A 11C-ABP688 PET template based on the data of WT mice was used for quantification, because we have previously shown (19) that use of such a template results in reproducible and reliable quantification. Using the predefined volume-of-interest template, time–activity curves of different regions (striatum, cortex, and cerebellum) were extracted from the image. After kinetic modeling, the nondisplaceable binding potential (BPND) for these regions was calculated using the simplified reference tissue model (20) with the cerebellum as the reference tissue, as previously validated in mice (19). The images were smoothed using an isotropic gaussian filter (0.5 mm in full width at half maximum), and a voxel-based analysis with Statistical Parametric Mapping (SPM) was performed using SPM12 (Wellcome Department of Imaging Neuroscience). For SPM analysis, data from heterozygous mice were compared with data from WT mice without missing observations. Statistical t maps were calculated for the peak voxel threshold (P = 0.05, uncorrected) and a cluster threshold of 100 voxels (0.8 mm3). Only significant clusters with a P value of less than 0.05 were considered and reported.
Immunohistochemistry
Animals were sacrificed by decapitation, and the brains were quickly removed and fresh-frozen in 2-metylbuthane at −35°C for 2 min and further preserved at −20°C until staining. Serial coronal sections (20 µm thick) were collected starting at 5.34 mm from bregma (21) to cover the striatum, in triplicate on Superfrost Plus slides (Thermo Fischer Scientific), using a cryostat (Leica). mGluR5 immunohistochemistry was performed to confirm in vivo changes in mGluR5 level, whereas neuronal nuclei (NeuN) immunostaining was aimed at quantifying neuronal density as previously reported (22).
The slides were fixed in 4% paraformaldehyde for 10 min and, after rinses in phosphate-buffered saline (PBS) (pH 7.4), were immersed in water containing 3% H2O2 for 5 min to quench endogenous peroxidases. Then, for mGluR5 immunohistochemistry, blocking solution containing 10% normal goat serum (NGS) and 0.3% Triton X-100 (Dow Chemical Co.) in PBS was added for 1 h. After 3 washes in PBS, avidin was added to the sections for 15 min, rinsed briefly, and subsequently blocked with biotin for 15 min, followed by incubation with polyclonal mGluR5 primary antibody (AB5675 [Millipore] 1:2,500 in PBS with 2% NGS, 2% bovine serum albumin, 10% milk, and 0.1% Triton X-100) overnight at room temperature. Then, the sections were rinsed 3 times in PBS and incubated in biotinylated goat–antirabbit conjugated with horseradish peroxidase (1:1,000; Jackson Immunoresearch) in PBS with 2% NGS, 2% bovine serum albumin, 10% milk, and 0.1% Triton X-100 for 1 h. After 3 washes with PBS, the slides were exposed to the colorimetric diaminobenzidine reaction (3,3′-diaminobenzidine reagent; Dako) for 10 min, and the reaction was stopped with tap water. Sections were dehydrated and mounted with distyrene–plasticizer–xylene medium (Sigma Aldrich).
For NeuN immunohistochemistry, after fixating, blocking (5% NGS and 0.5% Triton X-100 in PBS for 30 min followed by endogenous mouse IgG blocking [goat antimouse Fab fragment IgG, 1:50; Jackson Immunoresearch] in PBS for 1 h), and PBS washes, sections were incubated overnight with the primary antibody (mouse antirat NeuN, 1:2,000; Merck Millipore) with 1% NGS in PBS at room temperature. The following day, after PBS washes, the sections were incubated with peroxidase-conjugated donkey antimouse (IgG-horseradish peroxidase, 1:500; Jackson Immunoresearch) with 1% NGS in PBS for 1 h. After washes of PBS, the slides were exposed to the colorimetric diaminobenzidine reaction, dehydrated, and mounted as described for mGluR5 staining.
Images covering the whole slices were acquired at ×20 magnification with a light microscope using NIS-Elements software (version 4.2; Nikon Instruments). The mGluR5 immunoreactivity was semiquantitatively assessed by calculating the integrated optical density (23) in the regions of interest (i.e., striatum and cortex). The number of NeuN-positive neurons was quantified automatically after optimization of the sampling parameters (intensity threshold and minimum and maximum cell sizes) empirically under masked conditions (24). Images were analyzed using ImageJ software (National Institutes of Health) by an investigator unaware of the treatment. All quantifications were performed bilaterally on triplicate sections, of which the mean score was used for statistical analysis.
Statistical Analysis
The normality of the data distribution was assessed using the Shapiro–Wilk test. Longitudinal analysis was performed with a linear mixed model. Because this method accounts for missing observations, it did not require exclusion of animals if a measurement was missing. Additionally, linear mixed models are more robust than repeated-measures ANOVA. We fitted linear mixed models with genotype (WT and heterozygous), time (6, 9, and 13 mo), and the interaction between genotype and time (genotype × time) as fixed effects. Because the interaction between subject and time (subject × time) was not significant, only subject was included as a random effect and the random intercept model was applied. Post hoc multiple comparison was performed with Tukey–Kramer pairwise comparison to assess regional differences between genotypes for each time point and within genotype longitudinally.
Because sample size was too low to estimate normality, the Mann–Whitney U test was used to investigate differences between genotypes in the immunohistochemistry analysis. Normality testing and postmortem analyses were performed with Prism (version 6.0; GraphPad) statistical software, whereas linear mixed model analysis was performed using JMP Pro (version 13; SAS). The data are shown as mean ± SD. All tests were 2-tailed, except for SPM analysis (1-tailed), and significance was set at a P value of less than 0.05.
RESULTS
Small-Animal 11C-ABP688 PET Imaging
Averaged PET images of 11C-ABP688 BPND for heterozygous and WT mice at each time point are displayed in Figure 1. Striatal and cortical BPND were significantly lower in heterozygous than WT mice at all 3 ages (Fig. 2). At 6 mo, the striatal data were 1.22 ± 0.10 for WT and 1.06 ± 0.15 for heterozygous (difference, −13.1% ± 2.3%; P < 0.001) and the cortical data were 0.80 ± 0.08 for WT and 0.72 ± 0.09 for heterozygous (difference, −9.8% ± 2.1%; P < 0.01). At 9 mo, the striatal data were 1.17 ± 0.13 for WT and 1.01 ± 0.10 for heterozygous (difference, −13.5% ± 2.4%; P < 0.001) and the cortical data were 0.77 ± 0.07 for WT and 0.69 ± 0.07 for heterozygous (difference, −10.2% ± 2.2%; P < 0.01). At 13 mo, the striatal data were 1.11 ± 0.12 for WT and 0.95 ± 0.13 for heterozygous (difference, −14.2% ± 2.5%; P < 0.001) and the cortical data were 0.75 ± 0.08 for WT and 0.66 ± 0.10 for heterozygous (difference, −10.6% ± 2.3%; P < 0.01).

Average PET images of 11C-ABP688 BPND in WT and heterozygous mice at each time point, overlaid onto MRI mouse brain template for anatomic localization. At 6 mo, n = 15 WT and 16 heterozygous mice; at 9 mo n = 15 WT and 12 heterozygous mice; at 13 mo, n = 12 WT and 15 heterozygous mice. HET = heterozygous.

Reduced 11C-ABP688 BPND in heterozygous mice compared with WT mice in both striatum (A) and cortex (B), as well as age-related BPND decrease in striatum. n = 15 WT and 16 heterozygous mice. *P < 0.05. **P < 0.01. ***P < 0.001. HET = heterozygous.
A significant progressive temporal decline in striatal BPND was found between 6 and 13 mo old for heterozygous mice (−10.4% ± 3.2%, P < 0.05) (Fig. 2) but not for WT mice (−6.1% ± 2.3%, P > 0.05).
The voxel-based analysis confirmed that striatal binding was already lower in heterozygous mice than in WT mice at 6 mo old (Fig. 3). In addition, the voxel-based analysis reflected the time-related decline in the striatal BPND of heterozygous mice at 9 and 13 mo old (Fig. 3).

SPM results comparing 11C-ABP688 signal of 12 heterozygous and 12 WT mice. Statistical map of t values (threshold P < 0.05 [uncorrected] and cluster threshold of 100 voxels [0.8 mm3]) overlaid onto MRI mouse brain template for anatomic localization show clusters of reduced 11C-ABP688 uptake in heterozygous compared with WT mice. HET = heterozygous.
Immunohistochemistry
In agreement with the 11C-ABP688 PET results, mGluR5 immunoreactivity at 6 mo old was significantly lower in heterozygous mice than in WT mice for both striatum (7.75 ± 1.21 × 10⁸ for WT and 4.91 ± 0.51 × 10⁸ for heterozygous; difference, −36.6%; P < 0.01) and cortex (2.57 ± 0.27 × 10⁸ for WT and 2.14 ± 0.19 × 10⁸ for heterozygous; difference, −16.6%; P < 0.05) (Supplemental Fig. 1).
In contrast, no statistically significant difference in neuronal density (NeuN counts/μm2) was found between WT and heterozygous mice for either striatum (91.0 ± 5.6 for WT and 87.1 ± 6.9 for heterozygous; difference, −4.2%; P = 0.42) or cortex (108.1 ± 5.3 for WT and 109.4 ± 5.7 for heterozygous; difference, +1.2%; P = 0.42) (Supplemental Fig. 2).
DISCUSSION
The present study investigated changes in mGluR5 level using the PET radioligand 11C-ABP688 as a potential biomarker for progression of Huntington disease in the Q175 mouse model. To the best of our knowledge, this was the first in vivo study to image mGluR5 longitudinally in an animal model of Huntington disease. Our findings indicated that 11C-ABP688, given its noncompetitive, allosteric, high-affinity, and highly selective properties, is a promising radiotracer for imaging changes in mGluR5 level during the progression of Huntington disease. In particular, longitudinal PET quantification of 11C-ABP688 revealed a marked reduction in ligand binding in the striatum and cortex of heterozygous mice, compared with WT littermates. Consistently, postmortem analysis at 6 mo old showed a significant decline in mGluR5 level in both striatum and cortex of heterozygous mice. Noteworthy, no significant difference in neuronal density was found, suggesting the decrease in mGluR5 density to be related not simply to a loss of neurons but more likely to a downregulation of receptor availability. Accordingly, in vitro 11C-ABP688 and 3H-ABP688 autoradiography in postmortem human brain tissue demonstrated a significant decrease in mGluR5 density in Huntington disease patients, compared with controls (22).
One possible limitation of the current study was the lack of MR images. Although MRI might prove critical to the coregistration of certain radiotracers, we previously investigated its benefit to 11C-ABP688 and found nearly perfect agreement in quantification regardless of whether the template was from MRI or from 11C-ABP688 PET (striatum: r = 0.989; r2 = 0.978) (19); thus, we excluded MRI to minimize the number of anesthesia sessions.
mGluR5 is highly expressed in the brain regions affected by Huntington disease, including striatum and cortex (25), and its expression is altered in the knock-in mouse model of Huntington disease (26) and in human samples (24). In addition, mGluR5 is involved in movement control, because mGluR5 knockout mice display enhanced locomotor activity with Huntington disease–related pathologic changes (27). Notably, mGluR5 can physically interact with WT and mHTT, and HTT can modulate mGluR1/5 signaling (28). Altogether, these findings suggest that mGluR5 represents a potential biomarker and candidate therapeutic target in Huntington disease. However, we need to further understand whether mGluR5 activation will slow the development Huntington disease or instead aggravate it, as mGluR5 signaling may result in either activation of neuroprotective pathways or neuronal toxicity (29). This duality translates into 2 opposing strategies, both having the potential to treat Huntington disease: on one hand, positive allosteric modulators can ameliorate pathologic changes and phenotype by activating neuroprotective cell signaling pathways through activation of protein kinase B (9,30); on the other hand, negative allosteric modulators can be an alternative strategy because mHTT enhances the mGluR5 pathway, resulting in toxic levels of intracellular Ca2+ and intensified activation of protein kinase C (7,8). Accordingly, mGluR5 knockout reverses neuropathology and improves motor function (27), and negative allosteric modulators attenuate the decline in motor coordination and improve clearance of mHTT aggregates, possibly by enhancing the autophagy-mediated scavenger activity (31,32).
Even though mGluR5 appears to be markedly involved in the progression of Huntington disease, to date no studies have investigated longitudinal changes in mGluR5 in animal models. The striking reduction in mGluR5 level we saw over time suggests that 11C-ABP688 PET imaging might be a biomarker of progression in Huntington disease, might be used to evaluate treatments targeting mGluR5 (negative or positive allosteric modulators), and might be used to evaluate the effect of HTT-lowering agents on mGluR5 level. For instance, efficacy has been proven for treatment with cystamine, an inhibitor of transglutaminase, which is an enzyme involved in the formation of mHTT (33); therefore, 11C-ABP688 PET imaging during therapy might provide insights on the mechanism of mGluR5 involvement in Huntington disease.
Nonetheless, mGluR5 PET imaging warrants caution and needs to be planned carefully to guarantee adequate statistical power. We found a statistically significant temporal decline in mGluR5 level in heterozygous mice as disease progressed. However, the absolute percentage change in both investigated regions differed only negligibly between heterozygous and WT mice (e.g., in the striatum, the difference was −13.1%, −13.5%, and −14.2% at 6, 9, and 13 mo, respectively). The temporal decline in mGluR5 level may have been an age-related effect, as has been previously reported for rodents (34–36). In the present study, only an age-related trend was found in WT mice (e.g., in the striatum there was a difference of −6.1% ± 2.3% between 6 and 13 mo old; P > 0.05). Nevertheless, a recent study on humans did not show an age-related difference in 11C-ABP688 BPND (37).
However, several studies indicated that mGluR5 availability might differ on a daily basis. In particular, Elmenhorst et al. reported a circadian variation in mGluR5 availability in the rat brain, showing an increase of up to 10% during the sleep phase (38). Similarly, test–retest studies for 11C-ABP688 PET quantification reported an in vivo variation in mGluR5 level in nonhuman primates (39) and humans (40,41), possibly caused by changes in endogenous glutamate level during the day, although this variation was not found in rats (42). A possible explanation could be the use of isoflurane anesthesia during rodent studies; thus, it might be of interest to investigate mGluR5 level during a scan of awake rodents to further examine 11C-ABP688 translational significance. Nevertheless, 11C-ABP688 test–retest studies performed on different days indicated that this tracer provides reliable outcome measures in rodents (43) and humans (44).
Furthermore, a previous study reported that mGluR5 level is altered in humans after sleep deprivation, with a global increase in mGluR5 binding in subjects who are sleep-deprived, compared with those who are not (45). This finding is relevant because sleep disturbance has been reported as one of the earliest abnormalities seen in patients before Huntington disease manifests (46) and has been confirmed in animal models of Huntington disease (47,48). Overall, these variables need to be carefully considered when 11C-ABP688 is being evaluated as a potential biomarker in Huntington disease patients, to avoid possible confounding factors limiting the statistical power of future studies.
As a biomarker to monitor Huntington disease progression, 11C-ABP688 PET shows promise because mGluR5 level changes during the disease and because these changes relate not only to neuronal loss in the striatum but also to direct interaction of mHTT with mGluR5 function.
CONCLUSION
This study suggests that 11C-ABP688 PET imaging is a potential biomarker to monitor the progression of Huntington disease, with prospective application to humans. In addition, a disease-related decrease in mGluR5 level might be helpful either as a potential translational biomarker for disease progression studies or as a way to evaluate disease-modifying treatments.
DISCLOSURE
This work was funded by CHDI Foundation, Inc., a nonprofit biomedical research organization exclusively dedicated to developing therapeutics that will substantially improve the lives of Huntington disease–affected individuals. Daniele Bertoglio has a PhD fellowship from the Research Foundation Flanders (FWO, 11W2516N/11W2518N). No other potential conflict of interest relevant to this article was reported.
Acknowledgments
We thank Philippe Joye and Caroline Berghmans of the Molecular Imaging Center Antwerp (MICA) for their expertise and valuable technical assistance.
Footnotes
Published online May 24, 2018.
- © 2018 by the Society of Nuclear Medicine and Molecular Imaging.
REFERENCES
- Received for publication February 27, 2018.
- Accepted for publication May 22, 2018.


