


Abstract
The cystine transporter (system xC−) is an antiporter of cystine and glutamate. It has relatively low basal expression in most tissues and becomes upregulated in cells under oxidative stress (OS) as one of the genes expressed in response to the antioxidant response element promoter. We have developed 18F-5-fluoroaminosuberic acid (FASu), a PET tracer that targets system xC−. The goal of this study was to evaluate 18F-FASu as a specific gauge for system xC− activity in vivo and its potential for breast cancer imaging. Methods: 18F-FASu specificity toward system xC− was studied by cell inhibition assay, cellular uptake after OS induction with diethyl maleate, with and without anti-xCT small interfering RNA knockdown, in vitro uptake studies, and in vivo uptake in a system xC−–transduced xenograft model. In addition, radiotracer uptake was evaluated in 3 breast cancer models: MDA-MB-231, MCF-7, and ZR-75-1. Results: Reactive oxygen species–inducing diethyl maleate increased glutathione levels and 18F-FASu uptake, whereas gene knockdown with anti-xCT small interfering RNA led to decreased tracer uptake. 18F-FASu uptake was robustly inhibited by system xC− inhibitors or substrates, whereas uptake was significantly higher in transduced cells and tumors expressing xCT than in wild-type HEK293T cells and tumors (P < 0.0001 for cells, P = 0.0086 for tumors). 18F-FASu demonstrated tumor uptake in all 3 breast cancer cell lines studied. Among them, triple-negative breast cancer MDA-MB-231, which has the highest xCT messenger RNA level, had the highest tracer uptake (P = 0.0058 when compared with MCF-7; P < 0.0001 when compared with ZR-75-1). Conclusion: 18F-FASu as a system xC− substrate is a specific PET tracer for functional monitoring of system xC− and OS imaging. By enabling noninvasive analysis of xC− responses in vivo, this biomarker may serve as a valuable target for the diagnosis and treatment monitoring of certain breast cancers.
Oxidative stress (OS) is the result of an imbalance in cellular reactive oxygen species and antioxidants, and the cellular response to OS has been recognized as a critical regulatory mechanism for cancer and cancer stem cells (1,2). During OS, the expression of antioxidant response–regulated genes, including the key subunit of the xC− cystine transporter system (xCT, SLC7A11), are upregulated through the KEAP1–Nrf2 pathway (3), which leads to increased biosynthesis of glutathione. Glutathione is the predominant endogenous cellular antioxidant and plays a critical role in the defensive cellular response to OS by neutralizing free radicals and reactive oxygen and nitrogen compounds (4,5). The rate-limiting precursor for glutathione synthesis is cysteine, which cells can obtain through uptake of its oxidized form, cystine. System xC− plays its primary role by importing cystine to provide cysteine for glutathione synthesis in response to OS. In addition, xC− serves as a mediator of physiologic redox potential across the cell membrane, working in concert with other transporters to establish an appropriate level of cystine/cysteine on both sides of the cell membrane (4). System xC− transporter activity and expression in normal cells is typically low but is significantly upregulated in cells under OS (6). Thus, xC− transporter activity is a promising platform from which to develop targeted treatments for cancer, with several groups exploring the feasibility of targeting the unique xC− subunit, xCT, for cancer therapeutics (7–12). Tumors with increased xCT activity are associated with resistance to chemotherapy, and inhibition of xCT has been shown to sensitize cancer cells to chemotherapeutic drugs such as doxorubicin (12,13), gemcitabine, celastrol (14), and etoposide (15). In addition, immunohistochemical analysis of xCT protein expression has been shown to correlate with tumor staging (16). Consequently, the xC− transporter may be a useful diagnostic target for cancer imaging, and using this transporter as a functional reporter of OS may provide valuable information for clinical cancer management, including early detection, staging, patient stratification, monitoring of response to therapy, and development of new therapeutics.
We developed a cystine/glutamate analog, 18F-5-fluoro-aminosuberic acid (FASu), as a potent cystine transporter substrate with the goal of assessing its potential as a diagnostic tracer of OS via xC− activity (17). We previously reported the design, synthesis, and in vivo evaluation of 18F-18F-FASu in EL4 and SKOV3 tumor models (17). Our previous study on 18F-FASu demonstrated high tumor-to-background ratios in both tumor types, prompting us to evaluate the specificity of this tracer for xCT and its potential utility in the detection and monitoring of other tumor types. Herein we report the in vitro and in vivo studies that establish 18F-FASu uptake via system xC− in 3 breast cancer models. Our studies include MCF-7, ZR-75-1, and a triple-negative breast cancer model, MDA-MB-231, representing a range of breast cancer subtypes. We are particularly interested in triple-negative breast cancer, which maintains low expression levels of estrogen receptor, progesterone receptor, and human epidermal growth factor receptor 2 and is typically associated with poor patient outcomes, including lower overall survival rates as well as aggressive and early recurrence (18). The cystine transporter is commonly expressed and functional in triple-negative breast cancer, and inhibition with sulfasalazine can increase reactive oxygen species and slow cell growth in MDA-MB-231 tumors (8). An exploratory clinical study with 18F-(4S)-4-(3-18F-fluoropropyl)-l-glutamate, a glutamate analog that targets system xC−, showed significant uptake in a subset of breast cancer lesions (19). The purpose of this study was to evaluate the relationship between system xC− and 18F-FASu uptake in models of human breast cancer.
MATERIALS AND METHODS
Radiosynthesis of 18F-FASu
Radiosyntheses were performed on a TRACERlab FXFN module (GE Healthcare) in a lead-shielded hot cell using our reported method (17). Reverse-phase high-performance liquid (HPLC) chromatography was carried out on an Agilent 1200 series system equipped with a diode array detector and a Raytest GABI Star scintillation detector using a Phenomenex Monolithic C18 4.6 × 100 mm column. Chemicals and reagents were purchased from Sigma Aldrich, Acros Organics, and Fisher Scientific. Radiofluorination 18F− was produced in a TR13 cyclotron from bombardment of H218O at 20 μA. The produced H218O/18F− was delivered to an FXFN automated synthesis module, where the 18F− was trapped on a QMA resin. The resin was purged with helium, and the fluoride was subsequently released using a mixture of Kryptofix[2.2.2] (10.1 mg in 200 μL of acetonitrile) and K2CO3 (2.1 mg in 200 μL of water). The solvent was removed by the repeated volatilization of acetonitrile (1.5 mL) under reduced pressure. The precursor (di-tert-butyl 2-((bis-tert-butoxycarbonyl)amino)-5-(tosyloxy)octanedioate, compound 1, Fig. 1), 1.4 mg, was previously dried in vacuo and dissolved in 500 μL of anhydrous dimethyl sulfoxide in preparation for labeling. The precursor was added to Kryptofix[2.2.2]/18F−, and the reaction was heated at 95°C for 20 min, after which the reaction mixture was cooled to 35°C, diluted by 7 mL of H2O, and then loaded onto a Waters tC18 Plus Sep-Pak. The Sep-Pak was washed with 17 mL of distilled, deionized H2O, and di-tert-butyl 2-((bis-tert-butoxycarbonyl)amino)-5-fluorooctanedioate (compound 2, Fig. 1) was eluted using 1.5 mL of acetonitrile. In a separate apparatus, the solvent was removed under the flow of N2 at 95°C. Trifluoroacetic acid (500 μL) and anisole (8 μL) were added, and the mixture was heated at 95°C for 7 min. After trifluoroacetic acid was removed in vacuo, the residue was dissolved in 0.6 mL of phosphate-buffered saline and then passed through a Waters tC18 light Sep-Pak. The Sep-Pak was washed with an additional 0.6 mL of phosphate-buffered saline. The combined phosphate-buffered saline solution that contained 18F-FASu was filtered through a 0.22-μm membrane to generate the final product. Decay-corrected radiochemical yield was 18% ± 6% (n = 6), radiochemical purity was more than 98%, and specific activity was 17.5 ± 7 GBq/mmol (n = 6). The identities of compound 2 and 18F-FASu were confirmed by HPLC comparison with the standards.

Radiosynthesis of 18F-FASu. DMSO = dimethyl sulfoxide; TFA = trifluoroacetic acid.
Quality control of the radiosynthesis was performed by ultraviolet and radio-HPLC. The chromatograms are shown in Supplemental Figure 1. The retention time difference between 18F-FASu and FASu was 0.27 min, in line with the delay between the ultraviolet detector and the γ-detector.
The HPLC method was as follows: Phenomenex Monolithic C18 column, 100 mm × 4.6 mm, 1 mL/min; A: 0.1% trifluoroacetic acid in H2O, B: 0.1% trifluoroacetic acid in acetonitrile; gradient flow from 100% A at 0 min to 20% A and 80% B in 15 min.
In Vivo and In Vitro Stability Studies
For the serum stability study, 0.74 MBq of 18F-FASu in 10 μL of phosphate-buffered saline was incubated with 100 μL of Rag2M plasma for 5, 15, 30, 45, 60, 90, and 120 min. After each incubation, the sample was centrifuged through a membrane with a molecular weight cutoff of 10 kDa (Microcon, 145,000 rpm; Millipore) and analyzed by HPLC. No degradation was observed until 60 min. At 90 min, a small shoulder peak (20%) appeared. At 120 min, the same shoulder peak was observed at 27% compound to primary product peak.
For in vivo stability studies, urine and blood samples were collected from two Rag2M mice at 10 and 60 min after injection. The blood samples were centrifuged to collect the serum. Both serum and urine were passed through a 10-kDa membrane to remove protein, followed by HPLC analysis. No metabolites were observed for urine samples at 10 or 60 min. For the blood samples, no degradation was present at 10 min, and 15.5% ± 0.5% degradation was observed at 60 min.
Cell Culture and Uptake Experiments
The HEK-293T cell line was purchased from Clontech Laboratories. The ZR-75-1 cell line was purchased from ATCC. The MCF-7 cell line was obtained as a gift from Dr. C. Kent Osborne (Baylor College of Medicine) and authenticated by DDC Medical. The MDA-MD-231 cell line was obtained as a gift from Dr. Connie Eaves and authenticated by DDC Medical.
The MDA-MB-231 cell line was cultured in complete Dulbecco modified Eagle medium (with 4,500 mg/L glucose + 10% fetal bovine serum + 1% penicillin/streptomycin). ZR-75-1 was cultured in complete RPMI-1640 (with 10% fetal bovine serum + 1% penicillin/streptomycin). MCF-7 was cultured in complete Dulbecco modified Eagle medium with 1% minimum-essential-medium nonessential amino acid solution. Cells were maintained in 10-cm tissue culture dishes in a humidified incubator at 37°C with 5% CO2 and routinely subcultured at approximately 95% confluency.
For uptake studies, cells were seeded into 24-well plates (1 × 10⁵ cells/mL) such that confluency was achieved the next day. Each plate was washed 3 times with cold HEPES (4-(2-hydroxyethyl)-1-piperazineethanesulfonic acid)–Hanks balanced salt solution, and then 0.148 MBq of 18F-FASu in 400 μL of HEPES–Hanks balanced salt solution was added. Cell numbers were established from a single well using a Moxi Z Mini Automated Cell Counter (Orflo Technologies). Subsequently, the samples were incubated at 37°C with orbital shaking for the indicated duration. After incubation, supernatants were removed, cells were washed twice with cold HEPES–Hanks balanced salt solution, 400 μL of 1 M NaOH were added to the cells, the NaOH lysate was collected 10 min later, and 25 μL of the lysate was taken to assess the protein concentration using a Pierce bicinchoninic acid protein assay kit (Thermo Fisher Scientific). The activity in the solution and lysate was measured using a PerkinElmer Wizard 2480 γ-counter and normalized to the protein concentration.
For diethyl maleate (DEM)–induced OS experiments, DEM was added at various concentrations approximately 24 h before harvesting. The uptake study was conducted using the method described above.
For amino acid transporter inhibition experiments, all chemicals were purchased from Sigma-Aldrich and used without further modification. l-Glu, d-Asp, 2-amino-2-norbornanecarboxylic acid (BCH), l-Leu, and l-Ser were used at a 2 mM concentration, and sulfasalazine was used at a 1.0 mM concentration. The inhibitors were added to MDA-MB-231 cells and incubated with 18F-FASu at 37°C with 5% CO2 for 60 min.
Small Interfering RNA (siRNA) Knockdown Experiments
MDA-MB-231 cells were seeded at 1 × 10⁵ cells/mL in a 24-well plate with complete Dulbecco modified Eagle medium 24 h before transfection with siRNA (xCT siRNA and nontargeting control siRNA, both from Santa Cruz Biotechnologies). Cells were transfected at 80% confluency with a mixture containing 25 nM siRNA, 1.5 μL of TransitIT siQuest transfection reagent (Mirus), and Opti-MEM reduced serum medium (Life Technologies) prepared and added according to the manufacturers’ directions. The cells were left to incubate at 37°C with 5% CO2 for 24 h. Then, 0.1 mM DEM was added to the cells and incubated an additional 24 h, followed by a tracer uptake study using the method described above.
Glutathione Quantification
Glutathione content was determined, in triplicate, using the Thiol Detection Assay Kit from Cayman Chemical per the manufacturer’s instructions. The fluorescent signal was recorded using a FlexStation 3 spectrophotometer (Molecular Devices). The glutathione content in each sample was estimated from the standard curve and normalized to protein content.
HEK::xCT Cell Line
The lentiviral plasmid Lv205 (pReceiver-ORF-IRES-eGFP-IRES-Puro) containing the open reading frame of human SLC7A11 (GeneCopoeia) was used to generate virus particles using a second-generation packaging system. HEK-293T cells grown in antibiotic-free medium were transduced using 3:1 plasmids (Lv205-xCT and the packaging plasmids) to the transduction reagent ratio following the manufacturer’s instructions (transit-LT1; Mirus) and incubated at 37°C. The cell culture supernatant containing the virus was harvested 48 and 72 h after the transduction, passed through a 0.45-μm low-protein binding filter, and directly incubated on HEK-293T cells grown to 50% confluency. After 48 h of incubation, cells were passaged 3 times with complete medium before those harboring the xCT-plasmid were selected by adding puromycin at 3 μg/mL.
The green fluorescent protein tag of HEK::xCT allows confirmation of the expression of xCT using confocal microscopy. The green fluorescent protein and normal image overlay are shown in Supplemental Figure 2 (supplemental materials are available at http://jnm.snmjournals.org).
Quantitative Polymerase Chain Reaction (PCR)
Transcriptional expression of xCT (SLC7A11) in MDA-MB-231, MCF-7, and ZR-75 cells was determined relative to hypoxanthine phosphoribosyltransferase 1 (HPRT1). Total RNA was purified using the GenElute Mammalian Total RNA Miniprep Kit (Sigma), treated with amplification grade DNase I (Sigma), and measured using a NanoDrop spectrophotometer. A 50-ng quantity of total RNA from each sample was reverse-transcribed in a 20-μL reaction using a SuperScript VILO cDNA synthesis kit (Invitrogen). Quantitative PCR was set up in 384-well plates and performed on a QuantStudio 6K Flex Real-Time PCR system. Each 10-μL reaction contains 1 μL of template cDNA, 500 μM forward and reverse primers, 250 μM probe (IDT), and 1× SsoAdvanced Universal Probes Supermix (Bio Rad). MDA-MB-231 was assayed in triplicate; MCF-7 and ZR-75 were assayed in 2× triplicate. The concentration of each target was determined by interpolating the threshold cycle value from respective standard curves of known concentrations.
The IDT PrimeTime quantitative PCR primers were Hs.PT.58.38930943 for SLC7A11 and Hs.PT.58v.45621572 for HPRT1.
To construct the SLC7A11 and HPRT1 standard curves, total RNA from MDA-MB-231 cells was purified and reverse-transcribed, and SLC7A11 and HPRT1 genes were amplified using the same primers as for the quantitative PCR reaction and Q5 High-Fidelity DNA polymerase (New England BioLabs) per the manufacturer’s instructions. PCR products were separated on a 2% agarose gel, and target bands were extracted. The DNA was purified using the Monarch DNA Gel Extraction Kit (New England BioLabs) and quantified using the Qubit dsDNA HS assay kit (Thermo Fisher). Standard curves were constructed using 10-fold serial dilutions and assayed by quantitative PCR in triplicate (Supplemental Fig. 3).
Small-Animal PET and Biodistribution Studies
All animal experiments were conducted in accordance with the guidelines established by the Canadian Council on Animal Care and approved by the Animal Care Committee of the University of British Columbia. Female immunodeficient RAG2M mice (12–14 wk, 19–26 g) were obtained from an in-house breeding colony at the Animal Resource Centre of the British Columbia Cancer Research Centre.
MDA-MB-231, ZR-75-1, MCF-7, and HEK-293T tumors were inoculated subcutaneously with 5–10 × 106 cells in Matrigel (Corning) on the dorsal flank of the mice. MCF-7 and ZR-75-1 required implantation of a 17β-estradiol releasing pellet (0.36 mg/60 d, Innovative Research of America) 7 d before inoculation.
Once palpable tumors measuring about 7–10 mm were obtained (∼2–4 wk), the mice were anesthetized by 2% isoflurane inhalation and intravenously injected with about 3.7 MBq of 18F-FASu. The activity in the syringe was counted before and after injection to determine the exact injected dose.
For blocking experiments, the radiotracer was coinjected with a 100 mg/kg dose of nonradioactive aminosuberic acid. After the injections, the mice were allowed to recover and roam freely in their cages for 60 min. The animals were then anesthetized by 2% isoflurane inhalation and euthanized by CO2 at various time points. Blood was promptly withdrawn via a cardiac puncture, and the tissues of interest were harvested, rinsed in phosphate-buffered saline, blotted dry, and weighed. The radioactivity of the collected mouse tissues was counted on a γ-counter and expressed as the percentage injected dose per gram of tissue (%ID/g).
Mice destined for a static emission scan were anesthetized with 2% isoflurane inhalation 1 or 2 h after intravenous injection of the tracer and placed on the scanner. A baseline CT scan was obtained for localization and attenuation correction. During the acquisition, anesthesia was maintained and the mice were kept warm with a heating pad. A single static emission scan was acquired for 15 min. Afterward, the mice were euthanized and the organs harvested for biodistribution as described above.
Statistical Analysis
Test statistics and P values were calculated using Minitab Express analysis software. The descriptive statistics are reported as mean ± SD when applicable. Means were compared using a 2-sample t test, assuming equal variance. A P value of less than 0.05 was considered significant.
RESULTS
In Vitro Uptake Specificity Studies
To examine the uptake specificity of 18F-FASu in cancer cell lines, we studied tracer uptake in the triple-negative breast cancer cell line MDA-MB-231 at 60 min in the presence of substrates or inhibitors of common amino acids (Table 1). The results showed no statistically significant difference between uptake with and without d-Asp, l-Leu, or BCH, whereas uptake increased to 126% ± 14% in the presence of l-Ser, indicating uptake is not through excitatory amino acid transporters, system L, B0, B0+, A, or ACS. Tracer uptake was suppressed only by l-Glu, l-ASu, and sulfasalazine, all of which are substrates or inhibitors of system xC−, indicating that among the transporters analyzed here, uptake of 18F-FASu is specific to system xC−.
18F-FASu Uptake in MDA-MB-231 in Presence of Common Amino Acid Transporter Substrates and Inhibitors (n = 4)
It has been reported that DEM, as an electrophilic oxidant, induces xCT expression and concomitantly increases cellular glutathione levels (20–22). Cellular uptake of 18F-FASu showed a dose-dependent increase after DEM incubation (Fig. 2A). The uptake gradually increased with the addition of 2, 5, 10, and 20 μM DEM and plateaued at a higher concentration. Cellular glutathione levels showed a similar trend over the same DEM concentration range (Fig. 2B). These results indicate that with increased OS inducer, higher levels of glutathione are maintained, which correlates with higher tracer uptake. In contrast, when system xC− was knocked down on incubation with xCT siRNA, 18F-FASu uptake decreased significantly compared with the cells incubated with nontargeting control siRNA (62% ± 5%, P = 0.0017) or without siRNA (68% ± 3%, P = 0.0010, Fig. 2C).
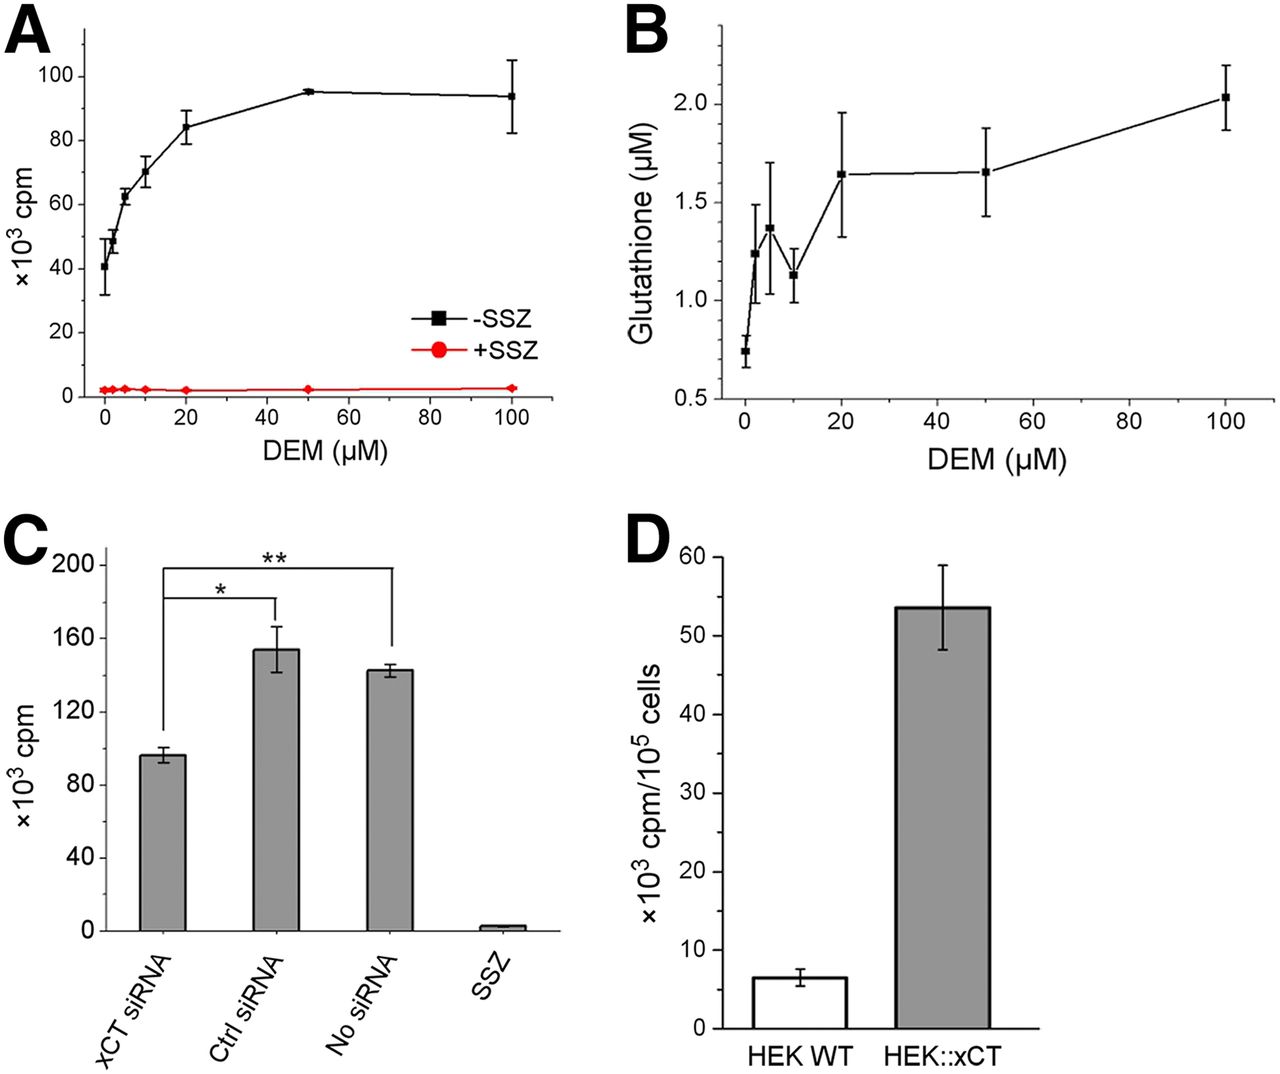
18F-FASu uptake specificity study. (A) 18F-FASu uptake in MDA-MB-231 cells at 60 min with addition of DEM at 0, 2, 5, 10, 20, 50, and 100 μM to induce OS. (B) Glutathione concentration in MDA-MB-231 cells with addition of DEM at 0, 2, 5, 10, 20, 50, and 100 μM. (C) Uptake in MDA-MB-231 cells after addition of xCT siRNA, control siRNA, no siRNA, or 500 μM sulfasalazine. (D) Uptake in HEK wild-type and HEK::xCT cells at 60 min (P < 0.0001). *P = 0.0017. **P = 0.0010. SSZ = sulfasalazine.
Between the 2 subunits of system xC−, xCT is unique to system xC−, leading us to establish a positive control cell line by transducing HEK293T (HEK wild-type) cells with an xCT expression vector (HEK::xCT). The cell uptake of 18F-FASu at 1 h in HEK::xCT cells was 5.4 ± 0.5 × 10⁴ cpm/105 cells, whereas the uptake in wild-type cells was only 6.5 ± 1.1 × 10³ cpm/105 cells (P < 0.0001, Fig. 2D) under the same conditions.
In Vivo Uptake Specificity Study in xCT Transduced Tumor Xenograft
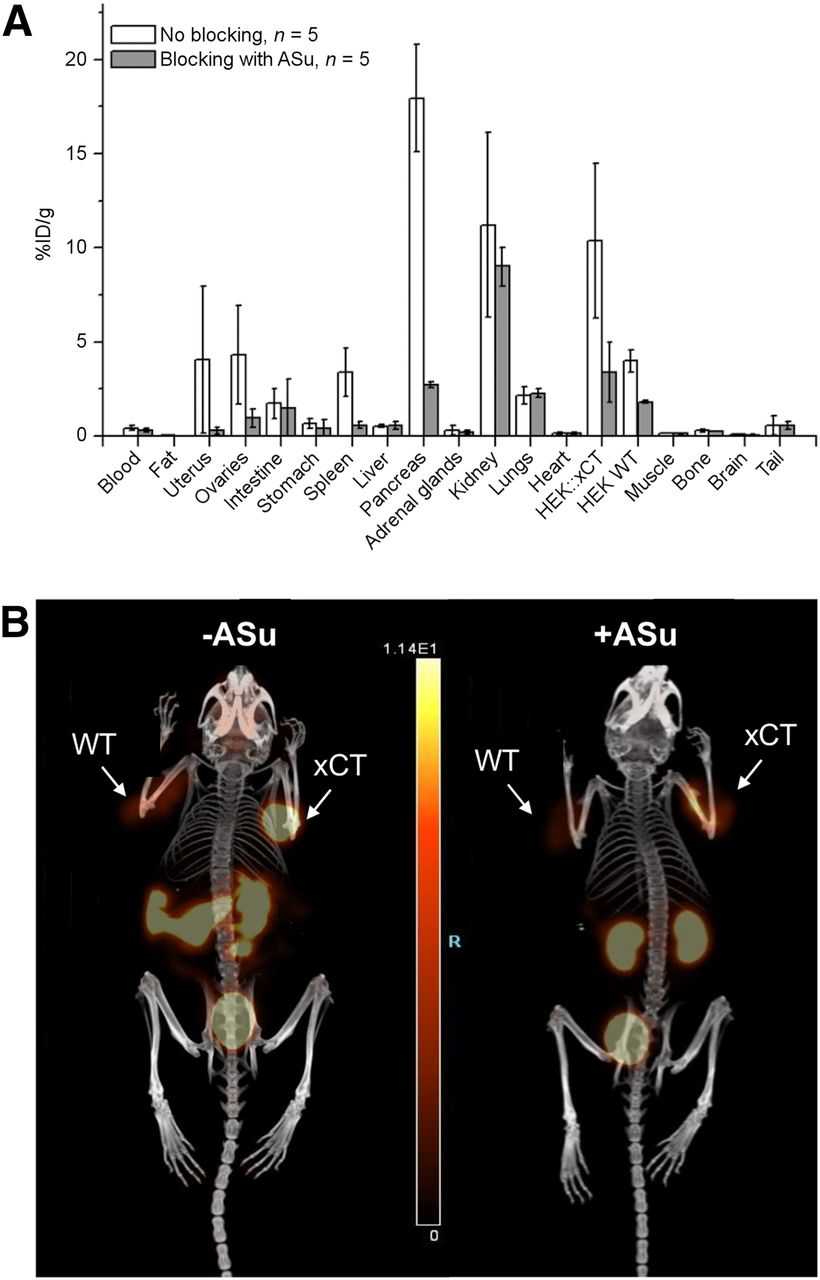
A biodistribution study was also performed using female mice inoculated with both HEK::xCT and HEK wild-type tumors. The average tumor uptake was 10.4 ± 4.1 %ID/g (n = 5) for HEK::xCT and 4.0 ± 0.6 %ID/g (n = 5) for HEK wild-type (Fig. 3A). Both tumors exhibited lower uptake when coinjected with aminosuberic acid as a blocking agent (Fig. 3A). HEK::xCT uptake decreased by 67% (n = 3), whereas the HEK wild-type tumor saw a 54% decline (n = 3). Figure 3B shows a static PET image acquired at 1 h after injection, which confirmed higher uptake in HEK::xCT and lower uptake in HEK wild-type. In addition to tumor, kidneys (11.2 ± 4.9 %ID/g), and bladder, appreciable uptake was also observed in pancreas (18.0 ± 2.8 %ID/g), spleen (3.4 ± 1.3 %ID/g), ovaries (4.3 ± 2.6 %ID/g), and uterus (4.1 ± 3.9 %ID/g), all of which decreased with coinjection of aminosuberic acid. Uptake in blood (0.43 ± 0.11 %ID/g) and muscles (0.17 ± 0.02 %ID/g) was much lower than in tumors.

(A) Biodistribution with (n = 5) and without (n = 5) coinjection of 100 mg/kg dose of aminosuberic acid in mice bearing both HEK::xCT and HEK wild-type tumors. (B) PET maximum-intensity projection at 45–60 min after injection. Kidneys and bladder are visible on both images, whereas pancreas and spleen are visible only in unblocked condition. WT = HEK wild-type tumor; xCT = HEK::xCT tumor.
Human Breast Cancer Cell Line In Vitro Data
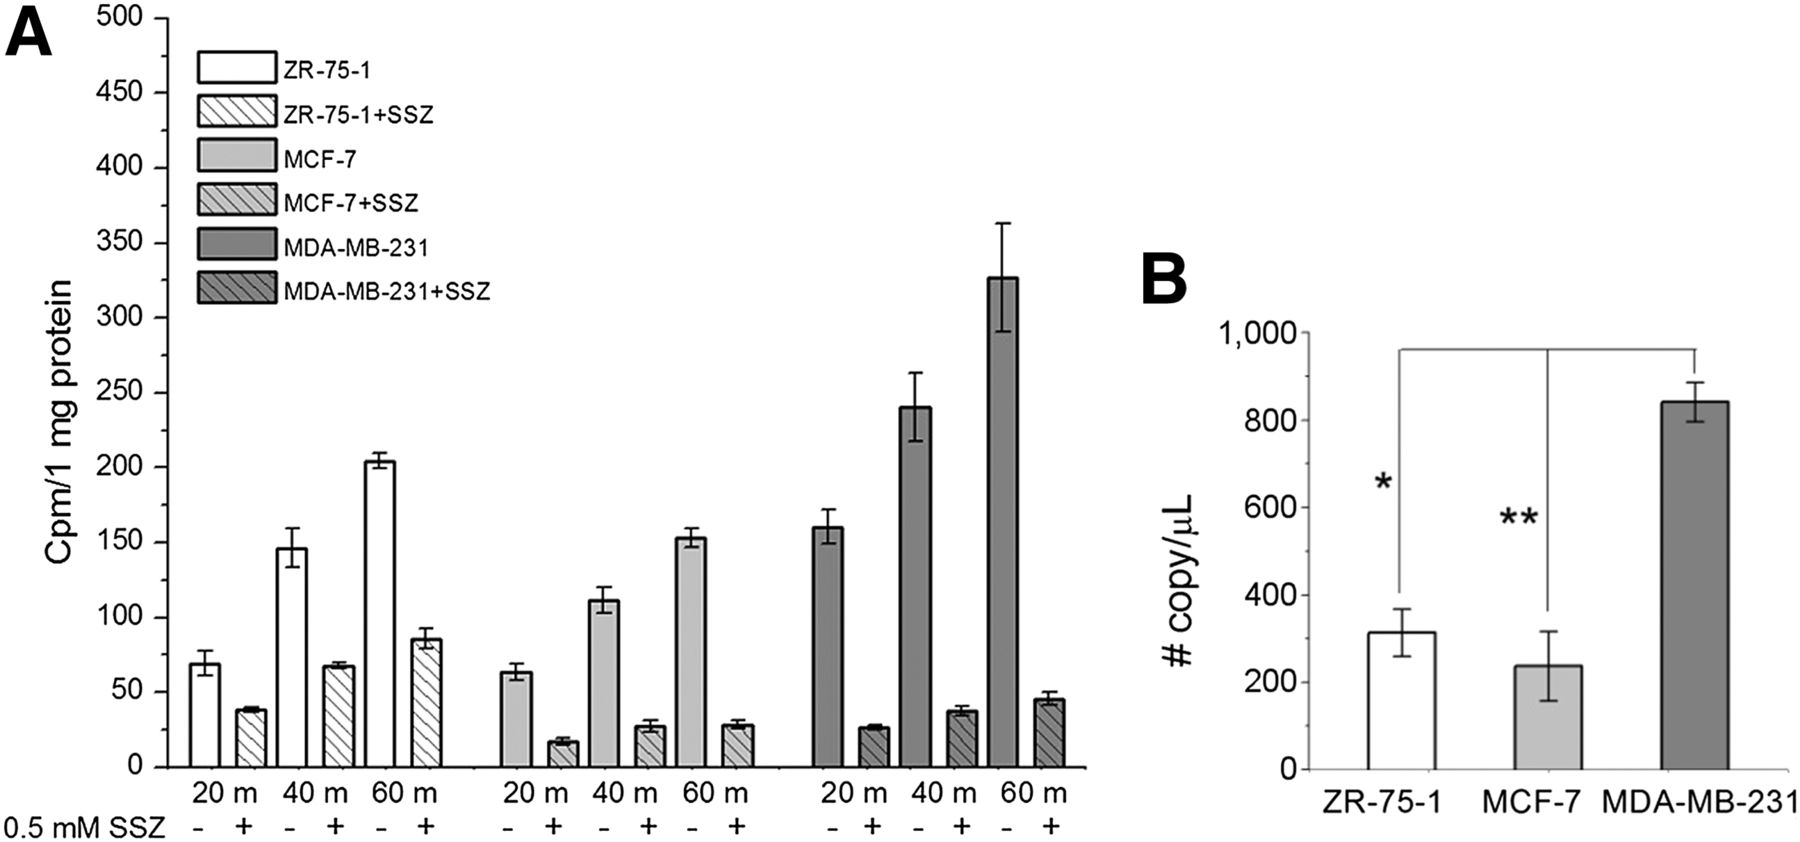
MDA-MB-231, MCF-7, and ZR-75-1 have modest to low reported xCT messenger RNA expression among the breast cancer cell lines (23). We measured the copy number of SLC7A11 (xCT) transcripts in MDA-MB-231, MCF-7 and ZR-75-1 cell lines using absolute quantitative PCR (Fig. 4B). MDA-MB-231 cells expressed the highest SLC7A11 level of the 3 cell lines (842 ± 45 copies/μL for MDA-MB-231, 237 ± 80 copies/μL for MCF-7, and 314 ± 54 copies/μL for ZR-75-1). Uptake of 18F-FASu in the cells increased over 60 min (Fig. 4A). MDA-MB-231 had the highest uptake of the 3 cell lines, whereas MCF-7 had the lowest uptake over 60 min. This is consistent with the trend in messenger RNA expression level measured. For MDA-MB-231 and MCF-7, uptake was suppressed by 86% ± 13% and 82% ± 9% (n = 4), respectively, by adding the system xC− inhibitor sulfasalazine, whereas uptake in ZR-75-1 was suppressed by only 58% ± 5% (n = 4) with sulfasalazine, indicating that ZR-75-1 cells may exhibit an alternative, unknown, uptake mechanism.

(A) 18F-FASu uptake in MDA-MB-231, MCF-7, and ZR-75-1 cell lines at 20, 40, and 60 min with and without system xC− inhibitor sulfasalazine (0.5 mM). (B) xCT messenger RNA expression levels in ZR-75-1, MCF-7, and MDA-MB-231 cells. *P < 0.0001. **P < 0.0001. SSZ = sulfasalazine.
Human Breast Cancer Tumor Xenograft In Vivo Data
In vivo MDA-MB-231 tumor uptake in RAG2M mice at 5, 30, 60, and 120 min after injection was studied. The tumor-to-blood ratio continuously increased to 7.2 at 120 min (Fig. 5A). The tumor-to-muscle ratio increased to 8.1 at 60 min and remained at this level through 120 min after injection. The PET imaging results at 2 h after injection, along with the biodistribution analysis of 18F-FASu in MDA-MB-231 tumor–bearing mice, are shown in Figures 5B and 5C. The highest organ uptake was in pancreas, probably because of the high xCT level in this organ (24). The kidneys also had high uptake, suggesting a preference of renal clearance for this radiotracer. Other organs exhibiting high uptake included spleen, uterus, and ovaries, which are also reported to have relatively higher levels of xCT expression (25).
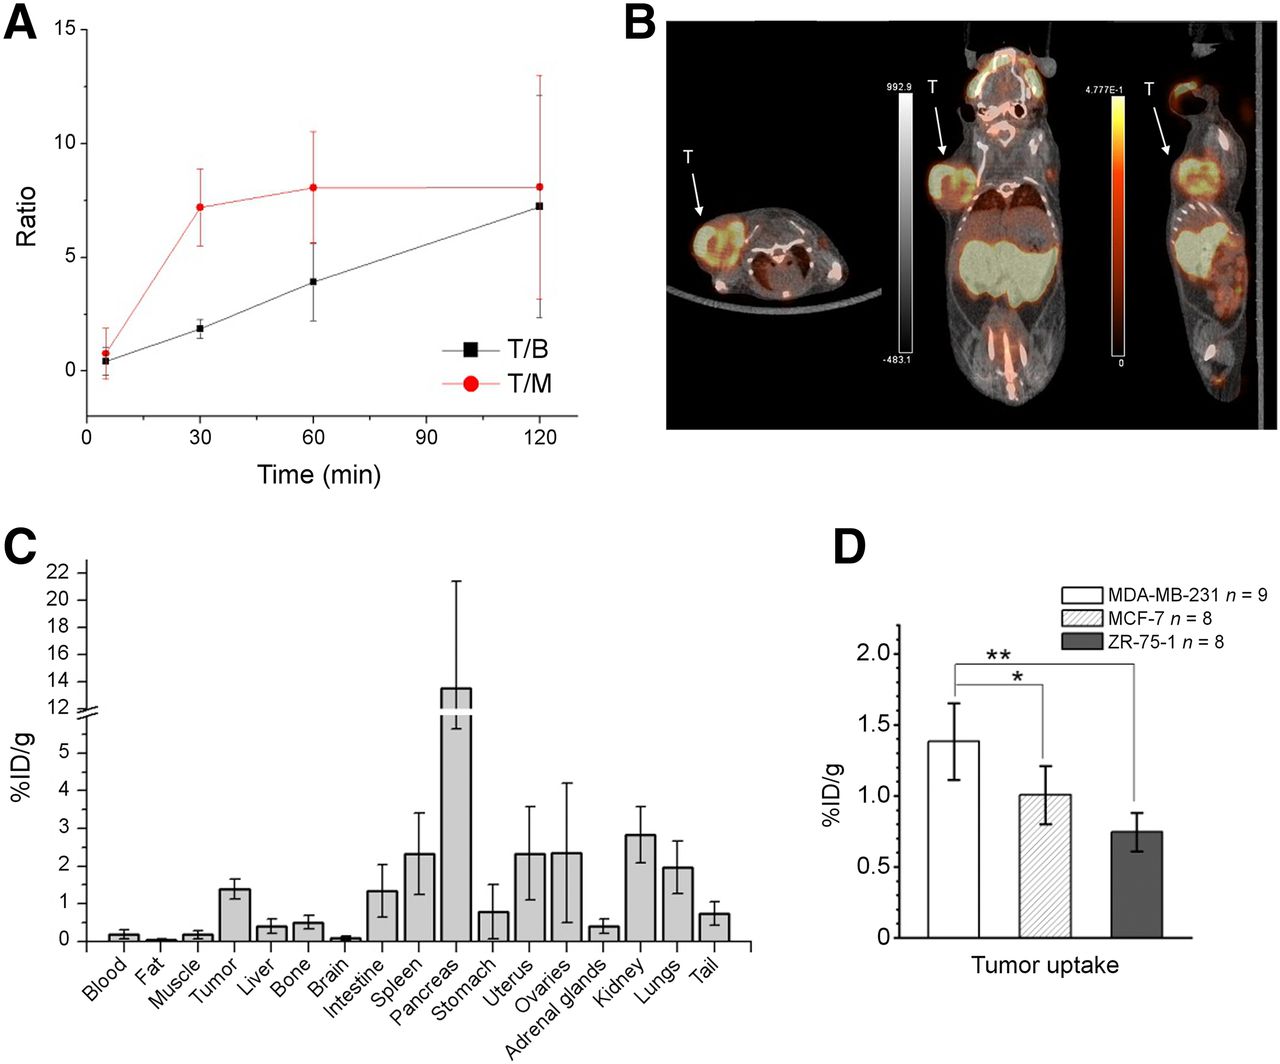
18F-FASu PET image and biodistribution in breast cancer tumor–bearing mice. (A) Tumor-to-blood and tumor-to-muscle uptake ratio at various time points in MDA-MB-231 tumor–bearing mice. (B) PET imaging of MDA-MB-231 tumor–bearing mouse at 2 h after injection (fused PET/CT axial, coronal, and sagittal slices). (C) Biodistribution in MDA-MB-231 tumor–bearing mice at 2 h after injection. (D) Comparison of tumor uptake in mice bearing MDA-MB-231, MCF-7, and ZR-75-1 tumors at 2 h after injection. *P = 0.0058. **P < 0.0001. T = tumor; T/B = tumor-to-blood ratio; T/M = tumor-to-muscle ratio.
At 2 h after injection, uptake in MDA-MB-231, MCF-7 and ZR-75-1 tumors was 1.38 ± 0.27 %ID/g (n = 9), 1.01 ± 0.20 %ID/g (n = 8), and 0.75 ± 0.14 %ID/g (n = 8), respectively (Fig. 5D). Whole-body biodistribution is shown in the supplemental data. Uptake in MDA-MB-231 tumors was higher than in ZR-75-1 or MCF-7 tumors (P < 0.0001 when compared with ZR-75-1, P = 0.0058 when compared with MCF-7), consistent with the higher messenger RNA expression level measured in MDA-MB-231 cells.
DISCUSSION
Clinical functional imaging in oncology has long relied on the analysis of enhanced glucose utilization—as monitored by 18F-FDG—for tumor detection. The success of 18F-FDG is due, in part, to the fact that it is a substrate for a ubiquitous cellular pathway and holds relevance for a wide number of clinical indications. OS is a common pathogenic process in many diseases, and the cystine transporter, as part of the antioxidant response element, provides a biomarker for OS imaging. A specific radiotracer driven by OS may have value in detection, staging, and therapy response monitoring (4). Here, we have reported the use of 18F-FASu as a cystine/glutamate analog for monitoring system xC− in 3 models of breast cancer. The goal was to evaluate 18F-FASu as an indirect, noninvasive indicator of cellular OS via system xC−.
Using a transduced HEK::xCT cell line, we established a positive control to help examine the specificity of 18F-FASu toward system xC−. HEK::xCT showed much higher 18F-FASu cellular uptake than did HEK wild-type (P < 0.0001). Studies on mice bearing both HEK::xCT and HEK wild-type tumors demonstrated significantly higher uptake in HEK::xCT than in HEK wild-type (P = 0.0086).
We also studied tracer specificity using cell-based uptake experiments and inhibition assays in a triple-negative breast cancer cell line, MDA-MB-231. We observed strong inhibition with l-Cys and l-Glu, two natural substrates of system xC−, and significant blocking in the presence of sulfasalazine, a known xC− inhibitor. There was no inhibition with d-Asp, l-Leu, l-Ser, or BCH, establishing a negligible substrate role for systems L, A, ACS, B0, B0+, and excitatory amino acid transporter activity.
Additional evidence for specificity came from xCT siRNA knockdown studies that showed reduced tracer uptake when cells were treated with anti-xCT siRNA but not with control siRNA. Finally, under conditions in which OS was induced by DEM, we showed that both intracellular glutathione levels and tracer uptake increase with increased DEM dose. The results indicate a positive correlation between cellular OS and 18F-FASu uptake.
We then applied this tracer to assess system xC− in 3 different breast cancer cell lines: ZR-75-1 (ER+/PR+/Her2−), MCF-7 (ER+/PR+/Her2−), and MDA-MB-231 (ER−/PR−/Her2−). We found that the triple-negative breast cancer cell line MDA-MB-231 had higher tracer uptake in vitro and higher tumor uptake in vivo. These results further confirm that 18F-FASu can be used as a noninvasive indicator of system xC− activity. These results also validate system xC− as a biomarker across different breast cancer subtypes. Although 18F-FDG PET has shown its potential in diagnosing breast cancers, variable sensitivity and specificity, along with inconsistencies for small and low-grade lesions, limit its clinical use in the detection of these tumors (26). Because 18F-FDG is not used for primary breast cancer detection, alternative biomarkers could provide a different perspective to meet the challenges of diagnosing and monitoring breast cancer subtypes. Previous studies have established triple-negative breast cancer as having higher xCT expression and higher cystine consumption, which support the potential utility of this biomarker for xCT PET in clinical breast cancer management (8).
18F-(4S)-4-(3-18F-fluoropropyl)-l-glutamate is another system xC− PET tracer that has been used in patients with non–small cell lung, breast, and liver cancers (19,27). Although similar in target, these two tracers maintain key differences in their respective structural arrangement of the carbon backbone. 18F-(4S)-4-(3-18F-fluoropropyl)-l-glutamate maintains a 4-bond separation between carboxyl groups, whereas 18F-FASu has 7, making the latter closer in structural orientation to cystine. We presume that the affinity and specificity of the two tracers toward system xC− will be different, and work comparing these tracers is currently under way to establish their respective value as specific xCT transporter imaging agents.
CONCLUSION
The data within support our hypothesis for using 18F-FASu as a tracer to monitor system xC− in vivo. 18F-FASu is a specific tracer for system xC− in 3 separate human breast cancer models. Further studies are under way to better understand the effect of optical purity on tumor uptake and image quality. Experiments are also under way to compare 18F-FASu with 18F-FDG (OS vs. glucose metabolism) and 18F-(4S)-4-(3-18F-fluoropropyl)-l-glutamate (structurally unique xC− tracers). We expect that the ability to assess xC− via PET will contribute to an understanding of its role in disease and will speed the development of interventions that moderate OS-related disease processes.
DISCLOSURE
Financial support was received from CIHR (201403COP, 329895). Michael Rishel, Bruce Johnson, and Jack Webster were supported by NIH 5R01EB014250-04. TRIUMF receives federal funding via a contribution agreement with the National Research Council of Canada. Bruce Johnson and Michael Rishel are employed by GE Global Research. No other potential conflict of interest relevant to this article was reported.
Acknowledgments
We thank the TRIUMF TR13 cyclotron operators, the BC Cancer Research Centre PET imaging staff, Lily Southcott, Iulia Dude, and Sofya Langman for their technical help.
Footnotes
Published online Oct. 27, 2016.
- © 2017 by the Society of Nuclear Medicine and Molecular Imaging.
REFERENCES
- Received for publication July 11, 2016.
- Accepted for publication November 7, 2016.


Jump to section
Related Articles
Cited By...
- Comparative Evaluation of [18F]5-Fluoroaminosuberic Acid and (4S)-4-3-[18F]fluoropropyl)-L-Glutamate as System Formula-Targeting Radiopharmaceuticals
- Comparative Evaluation of [18F]5-Fluoroaminosuberic Acid and (4S)-4-3-[18F]fluoropropyl)-L-Glutamate as System Formula-Targeting Radiopharmaceuticals
- Clinical Evaluation of (4S)-4-(3-[18F]Fluoropropyl)-L-glutamate (18F-FSPG) for PET/CT Imaging in Patients with Newly Diagnosed and Recurrent Prostate Cancer
- The Characterization of 18F-hGTS13 for Molecular Imaging of xC- Transporter Activity with PET
- Cystine/glutamate antiporter xCT (SLC7A11) facilitates oncogenic RAS transformation by preserving intracellular redox balance
- Assessment of Tumor Redox Status through (S)-4-(3-[18F]fluoropropyl)-L-Glutamic Acid PET Imaging of System xc- Activity