


Abstract
1973
Objectives Recent increases in PET image contrast and resolution has primarily come from PET reconstruction algorithms as opposed to hardware improvements. New algorithms search to decrease noise and increase spatial resolution using modeling and/or adaptive filtering/smoothing. Q.Clear, a Bayesian penalized-likelihood reconstruction algorithm by GE Healthcare, is designed to improve image quality and quantification by controlling or penalizing noise during image reconstruction and, hence, increase signal to noise ratio in reconstructed images. In the current work, Q.Clear reconstructions were evaluated based on the standardized NEMA protocol relevant for the clinical use of Q.Clear including evaluation of the effect and optimum choice of the beta parameter that controls the strength of the regularizing term relative to the data statistics in the algorithm.
Methods The NEMA IQ phantom was PET/CT scanned on a GE Discovery D710 according to the NEMA NU 2-2001 protocol using a background start activity of 3.4 kBq/cc 18F-FDG. The three hot spheres ranging from 10 mm to 22 mm in diameter was filled with 18F-FDG with a 4:1 activity ratio compared to the background. Two spheres of 28 mm and 37 mm were left cold as prescribed in the protocol. Acquired data were reconstructed from sinograms by either ordered subset expectation maximum (OSEM) or Q.Clear algorithms. Reconstructed images were compared with and without both point-spread function (PSF) and time of flight (TOF) for OSEM, while only TOF data effect could be evaluated as PSF is incorporated in Q.Clear. The noise penalizing determining factor in Q.Clear, beta, was varied between allowed outer limits of 1 to 10000 in uneven steps with the smallest increment around the default beta value of 350. After reconstruction, the images were evaluated and compared following the NEMA IQ protocol using an automated region of interest (ROI) placement, hence, avoiding introduction of human bias. Contrast recovery and background variability were calculated for each ROI in all reconstructed image sets and assessed quantitatively.
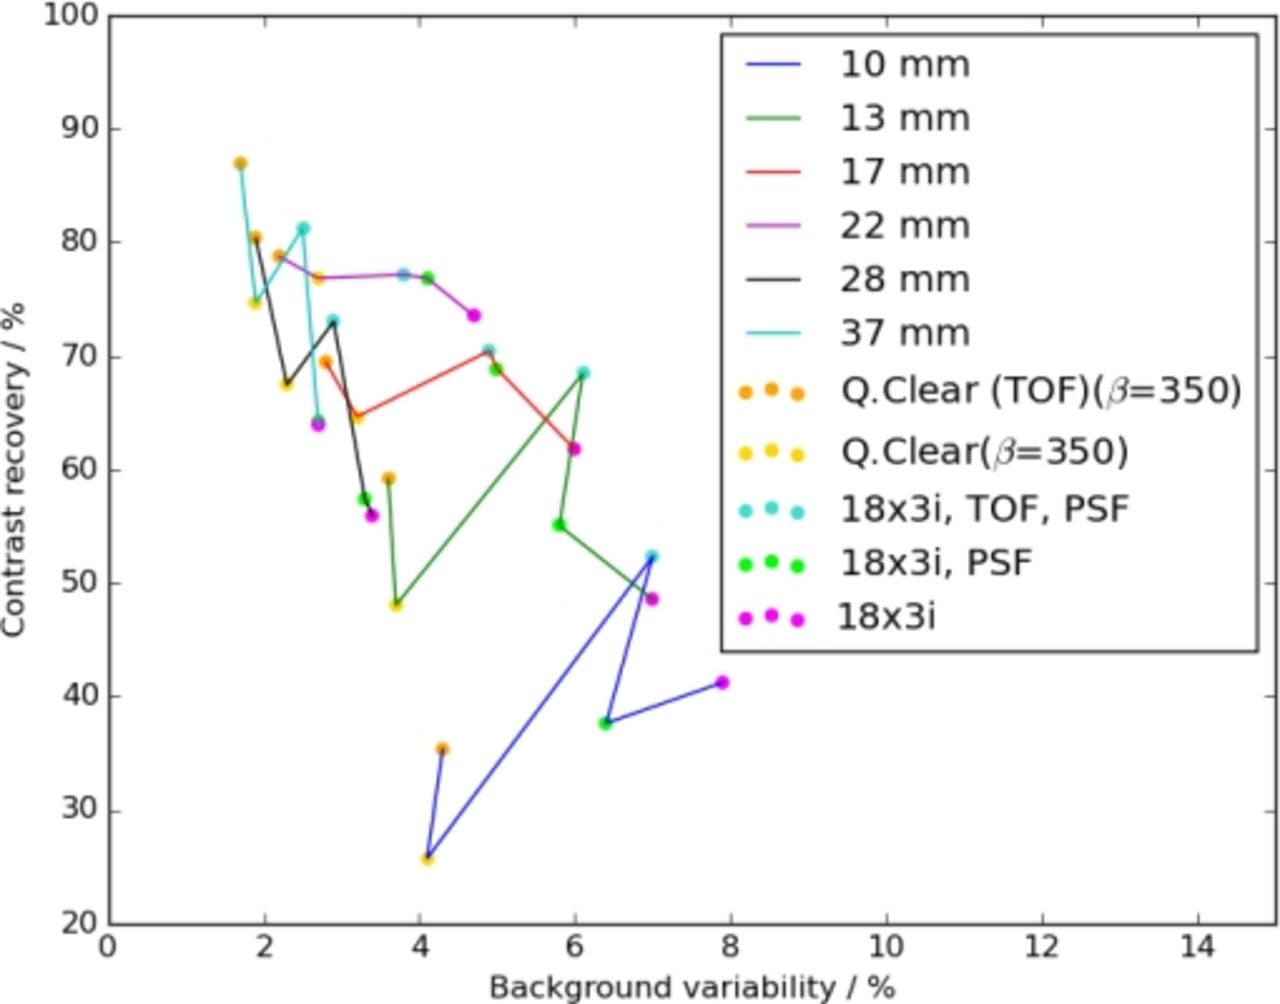
Results Background variability increased with decreasing beta values and sphere sizes reaching a maximum variability at a minimum beta value of 1 and a sphere size of 10 mm. This combination, however, also had the highest contrast recovery of 93% (reconstructed from TOF data). The Q.Clear with TOF data reconstruction reached maximum contrast recovery to background variability ratio, i.e. highest detectability of small lesions at the lowest amount of noise, at lower beta values for smaller hot spheres increasing with larger spheres to stabilize at 17 mm. The same tendency was observed for Q.Clear reconstructions without TOF data, although the optimum beta values were in general lower than for reconstructions with TOF data applied. For comparable background variabilities, i.e. comparable noise levels in the images, a contrast recovery increase of approximately 15% across all sizes with the largest gain at smaller sizes was observed in both OSEM and Q.Clear reconstructed images.
Conclusions For small structure detectability and localization, the results suggest that lower beta values are a better choice as the highest contrast recoveries at all sizes were found at beta equal to 1. The noise in these images is subsequently also the highest. No consistent optimum beta value was found across all sphere sizes from the contrast recovery to background variability ratio. In general, lower beta values should be preferred for small structure detectability and quantification, while higher beta values can be used for larger structures, if heavier smoothing is preferred visually.

In this issue


Jump to section
Related Articles
Cited By...
- No citing articles found.