


Abstract
Inaccuracy in MR image–based attenuation correction (MR-AC) leads to errors in quantification and the misinterpretation of lesions in brain PET/MRI studies. To resolve this problem, we proposed an improved ultrashort echo time MR-AC method that was based on a multiphase level-set algorithm with main magnetic field (B0) inhomogeneity correction. We also assessed the feasibility of this level-set–based MR-AC method (MR-AClevel), compared with CT-AC and MR-AC provided by the manufacturer of the PET/MRI scanner (MR-ACmMR). Methods: Ten healthy volunteers and 20 Parkinson disease patients underwent 18F-FDG and 18F-fluorinated-N-3-fluoropropyl-2-β-carboxymethoxy-3-β-(4-iodophenyl)nortropane (18F-FP-CIT) PET scans, respectively, using both PET/MRI and PET/CT scanners. The level-set–based segmentation algorithm automatically delimited air, bone, and soft tissue from the ultrashort echo time MR images. For the comparison, MR-AC maps were coregistered to reference CT. PET sinogram data obtained from PET/CT studies were then reconstructed using the CT-AC, MR-ACmMR, and MR-AClevel maps. The accuracies of SUV, SUVr (SUV and its ratio to the cerebellum), and specific–to–nonspecific binding ratios obtained using MR-AClevel and MR-ACmMR were compared with CT-AC using region-of-interest– and voxel-based analyses. Results: There was remarkable improvement in the segmentation of air cavities and bones and the quantitative accuracy of PET measurement using the level set. Although the striatal and cerebellar activities in 18F-FP-CIT PET and frontal activity in 18F-FDG PET were significantly underestimated by the MR-ACmMR, the MR-AClevel provided PET images almost equivalent to the CT-AC images. PET quantification error was reduced by a factor of 3 using MR-AClevel (SUV error < 10% in MR-AClevel and < 30% in MR-ACmMR [version VB18P], and < 5% in MR-AClevel and < 15% in MR-ACmMR [VB20P]). Conclusion: The results of this study indicate that our new multiphase level-set–based MR-AC method improves the quantitative accuracy of brain PET in PET/MRI studies.
The development of tomographic imaging technologies has made dramatic progress in recent decades. Among the modern medical imaging systems, PET and MRI have greatly contributed to understanding normal and abnormal brain functions and evaluating various neurologic disorders (1–4). Although PET is the most sensitive medical imaging device, providing both functional and biochemical information, it has limited spatial resolution, signal-to-noise ratio, and anatomic information. Conversely, MRI offers detailed anatomic information about the brain along with excellent soft-tissue contrast and various types of hemodynamic information (i.e., perfusion and diffusion). Accordingly, the combination of PET and MRI can provide a 1-stop shop for clinical examination and new methodology for exploring the brain with multiparametric and complementary imaging information (5,6).
In addition, fully integrated PET/MRI scanners based on semiconductor photosensors, such as avalanche photodiodes and silicon photomultipliers, allow the simultaneous acquisition of both image datasets, which possess several distinct advantages over the sequential scan in conventional PET/CT examinations (7–11). Accurate spatiotemporal correlation of PET/MRI signals permits the studies to demonstrate the relationship between neurotransmitter release and hemodynamic change in the brain under various pathologic and pharmacologic circumstances. Head motion correction of PET images using the motion information derived from the rapidly acquired time series of MR images is another advantage of simultaneous PET/MRI scans. Moreover, the MRI-based extraction of arterial input function for PET kinetic analysis and partial-volume correction of PET has become easier to perform and more accurate (5,6,9,12–14).
However, the accuracy of attenuation correction of brain PET in PET/MRI studies is still questionable. Because the MRI signal is not directly related to the photon attenuation, PET attenuation correction in PET/MRI relies on MRI segmentation, population-based standard templates, or joint activity and attenuation estimation (15–18). The template-based method is robust but has limitations in accommodating the wide interindividual anatomic variability in patients’ brains (19–22). The MRI segmentation–based method using a 2-point Dixon sequence does not provide the bone segment, leading to the underestimation of uptake around the bone (23–27). Although the reconstruction algorithms for the joint estimation of activity and attenuation have great potential, the PET timing resolution that determines the accuracy of these algorithms is not good enough in current PET/MRI scanners (28–30).
The MRI-based attenuation correction (MR-AC) using an ultrashort echo time (UTE) MRI sequence derives the bone segment based on the difference between 2 MR images obtained at different echo times (ultrashort and typical times) (31,32). Thus, the most widely used clinical PET/MRI system (Biograph mMR; Siemens Healthcare) offers the UTE-based MR-AC along with the Dixon-based method for brain PET/MRI studies. However, the initial versions of the UTE sequence (i.e., mMR software version VB18P) yielded frequent segmentation errors at the boundary between soft tissue, bone, and air, and misclassification of the ventricle as air (33–35). Although a recent upgrade of the software from VB18P to VB20P offers more reliable attenuation maps than before, significant segmentation errors in the regions around the inferior part of the brain (i.e., sinus and lower skull structures) still exist. Moreover, considerable quantification errors because of the inaccurate UTE MR-AC have been reported in several articles (33–35).
Here, we propose an advanced UTE MR-AC method that is based on a multiphase level-set algorithm (36–38) to provide more accurate attenuation maps than those currently used in brain PET/MRI studies. The quantitative accuracy of this new method, providing a 3-segment (air, bone, and soft tissue) attenuation map, was compared with CT-based and mMR-providing attenuation corrections. For this comparison, we used image datasets obtained from 18F-fluorinated-N-3-fluoropropyl-2-β-carboxymethoxy-3-β-(4-iodophenyl)nortropane (18F-FP-CIT) and 18F-FDG brain PET/MRI and PET/CT studies.
MATERIALS AND METHODS
Patient Population
We evaluated our new MR-AC method using 2 different brain PET datasets. One of these was the 18F-FP-CIT PET/CT and PET/MRI data acquired in our previous study for evaluating the accuracy of existing MR-AC methods in patients with Parkinson disease (35). Four more PET studies have been added since the publication of the previous study; thus, a total of 20 patients (11 men, 9 women; mean age ± SD, 59.6 ± 9.1 y; age range, 54–71 y) were enrolled in this study. The other was 18F-FDG PET/CT and PET/MRI data of 10 prospectively enrolled healthy normal volunteers (6 men, 4 women; mean age ± SD, 57.7 ± 5.4 y; age range, 51–67 y) without any medical diseases or abnormalities uncovered in neuropsychologic screening tests. All these studies were approved by the Institutional Review Board of our institute, and all study participants signed an informed consent form.
PET/CT and PET/MRI Acquisition
PET/CT data were acquired using a Biograph mCT40 scanner (Siemens Healthcare) in 18F-FP-CIT studies and a Biograph TruePoint40 scanner in 18F-FDG studies. A Biograph mMR system was used for PET/MRI data acquisition in both studies. Although the mMR software version of VB18P was used in the 18F-FP-CIT studies, the software was upgraded to VB20P for the 18F-FDG studies. The VB20P is the latest version and provides improved UTE image quality by incorporating gradient delay correction, streak artifact suppression, and a more advanced MR-AC method. In this new version, skull segment is generated using a template-based approach and combined with the soft-tissue map obtained by applying MRI segmentation.
In the 18F-FP-CIT studies, a PET/MRI scan was obtained 110 min after the injection of a tracer (192 MBq on average) and followed by a PET/CT scan. In the 18F-FDG studies, the sequence of PET/MRI and PET/CT was randomly determined, and the first scan was obtained 40 min after the injection of the tracer (259 MBq on average). PET scan duration for 18F-FP-CIT and 18F-FDG was 10 min.
PET/CT Acquisition
PET/CT imaging was performed in a single PET bed position and the participants’ heads were positioned in a head holder attached to the patient bed. The PET/CT scan followed the routine clinical protocol for brain studies including a topogram scan, an attenuation CT scan, and a 10-min PET emission scan. For PET attenuation correction, the CT images were reconstructed in a 512 × 512 × 112 matrix with voxel sizes of 0.59 × 0.59 × 3 mm. The emission PET data were acquired in sinogram format.
PET/MR Acquisition
In PET/MRI, the participants’ heads were positioned in the mMR head coil. MR images were acquired simultaneously with PET using a dual-echo UTE sequence (echo time, 0.07 and 2.46 ms; repetition time, 11.9 ms; flip angle, 10°). The UTE images were reconstructed into a 192 × 192 × 192 matrix with an isotropic voxel size of 1.33 mm (Supplemental Fig. 1; supplemental materials are available at http://jnm.snmjournals.org). A T1-weighted 3-dimensional ultrafast gradient echo sequence was also acquired in a 208 × 256 × 256 matrix with voxel sizes of 1.0 × 0.98 × 0.98 mm.
MR-Based Attenuation Map Using Level-Set Algorithm
The T2 relaxation time of protons in bone tissue is much faster than in other tissues. Thus, bone tissues with short T2 can be distinguished from soft tissue by taking the subtraction or division between the first UTE image (UTE1) and the second longer TE image (UTE2). However, these images, especially UTE2, are sensitive to off-resonance effects because of main magnetic field (B0) inhomogeneity and susceptibility, causing inhomogeneity artifacts that make accurate image segmentation difficult (39). Thus, we generated a UTE MR-based attenuation map based on a level-set algorithm in which the intensity inhomogeneity correction was incorporated. These procedures were performed using in-house–developed code written in Matlab (R2014a; The MathWorks).
Level-Set Algorithm
Two-phase level-set segmentation based on the Chan and Vese multiphase model was applied to both the UTE1 and the UTE2, in which 2 level-set functions were evolved simultaneously (37). Local intensity clustering properties and region-based information were considered as proposed by Li et al. to unify the segmentation and inhomogeneity correction within a single evolving framework (38). Figure 1 shows the results of the level-set segmentation (the supplemental note provides detailed information on the level-set algorithm used in this study). The final evolved contours (red: level-set function 1 = 0; blue: level-set function 2 = 0) were overlaid on the MR images. The regions delimitated by the contours were represented in the binary images by assigning 1 to the inside of the contour and 0 to the outside. (UxLy is the binary image from the yth level-set function of the xth UTE in Figure 1. The symbol C labeled behind y indicates that the binary image is generated with inhomogeneity correction.)
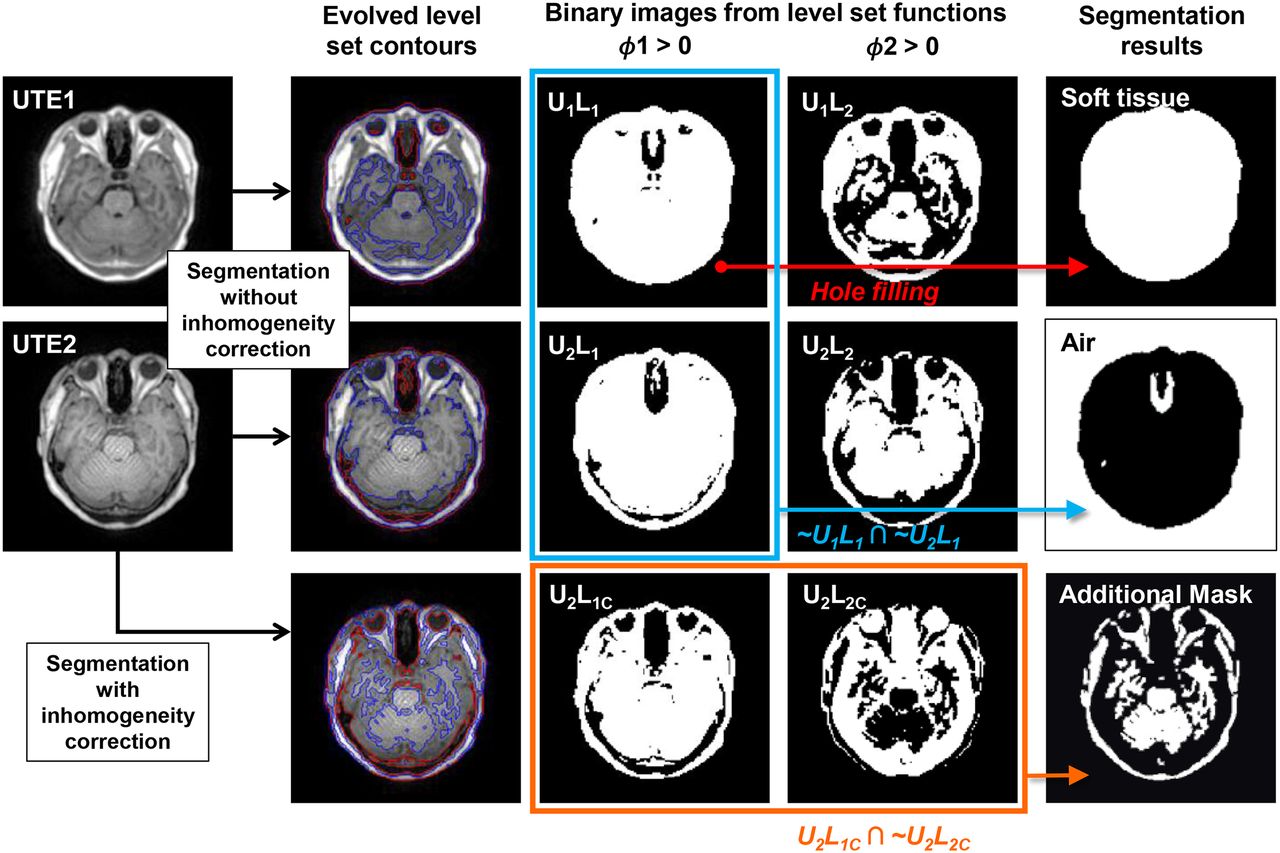
Generation of soft-tissue and air maps and additional mask using 2-phase level-set segmentation and morphologic and binary operations. Final evolved contours (red: level-set function 1 = 0, blue: level-set function 2 = 0) were overlaid on MR images. UxLy was binary image from xth level-set function of yth UTE. Soft-tissue and air maps were generated by filling holes in U1L1 and multiplying 2 binary images (∼U1L1 and ∼U2L1). Additionally, mask for trimming bone map was generated from binary images of level-set functions obtained using level-set segmentation with inhomogeneity correction (U2L1C ∩ ∼U2L2C).
Generation of Attenuation Map
The procedure for generating the attenuation map is similar to Keereman’s scheme (31). However, the accuracy of segmentation of each region was improved by the level-set method.
The soft-tissue map was obtained by applying a hole-filling operation to the U1L1 that encloses almost all of the structures in the head. Air has a negligibly low signal in both UTE images. Thus, we obtained an air map by multiplying ∼U1L1 and ∼U2L1 (Fig. 1). To generate the bone map, we started from the initial bone map generated by applying a threshold to the difference image (dUTE) between UTE1 and UTE2 (Fig. 2). The threshold was empirically determined and 50% of the mean intensity of dUTE pixels greater than 10. This initial bone map was then masked by the morphologically eroded soft-tissue map to correct for the misclassified voxels around the outer boundary of the skull with air. To further trim out the remaining misclassified soft tissue as bone in the dUTE image, we applied an additional mask generated by multiplying U2L1C and ∼U2L2C (Figs. 1 and 2).
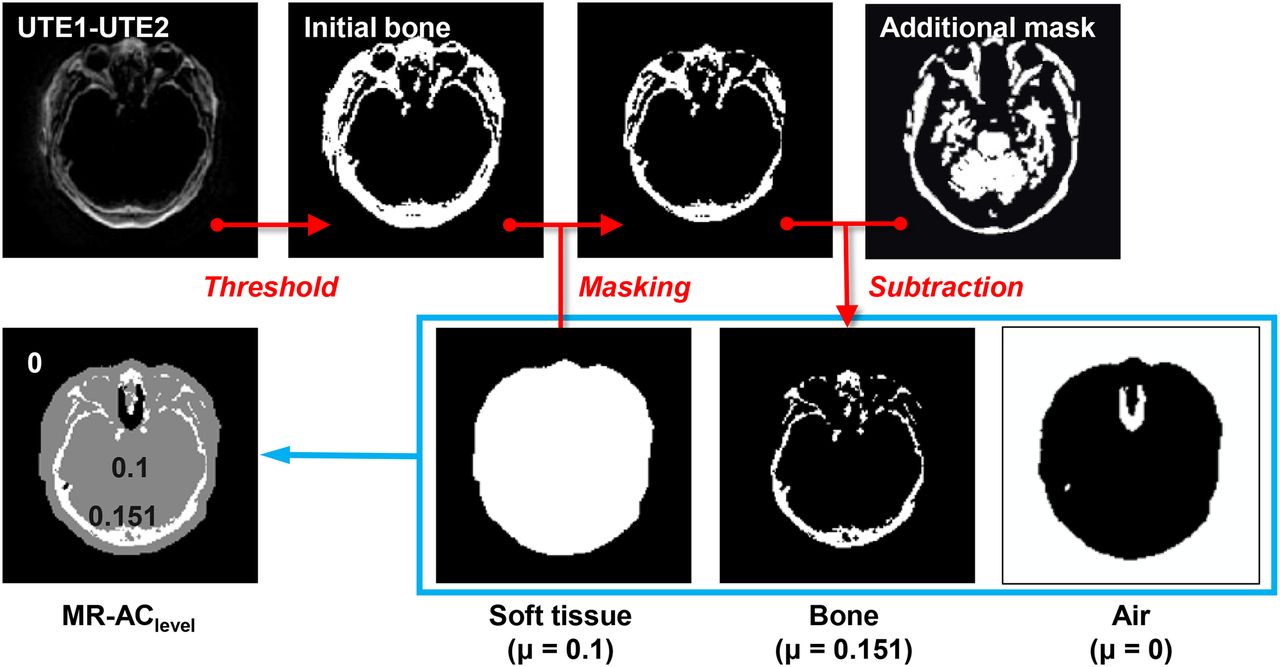
Generation of bone map and final level-set–based attenuation map (MR-AClevel). Initial bone map generated by applying a threshold to difference image between UTE1 and UTE2 was further trimmed to yield final bone map by masking it with soft-tissue map and additional mask. MR-AClevel map was then generated by assigning attenuation coefficients to soft-tissue, bone, and air maps and combining them.
Finally, we added the bone segment to the initial attenuation map, and assigned the attenuation coefficients for soft tissue and bone (0.1 and 0.151 cm−1). The computing time for generation of the attenuation map using the level-set method was approximately 5 min when this method was implemented using Matlab code (version R2014a) and executed on a personal computer with Intel Core i5-2500 Processor (3.3 GHz).
Image Processing and Reconstruction
Reconstructed PET images were generated from emission data in the PET/CT studies using 3 different attenuation maps. The first one was the MR-based attenuation map that is offered by the Biograph mMR software (MR-ACmMR map). The second one was the MR-based attenuation map generated using the proposed multiphase level-set method (MR-AClevel map). The last one was the CT-based attenuation map conventionally used in PET/CT studies, which was converted from the CT images to 511-keV attenuation coefficients using a bilinear transformation (CT-AC map).
For each participant, 2 MR-based attenuation maps were coregistered and resliced to the CT-AC map using the statistical parametric mapping (SPM8; University of College London) software through the coregistration of T1 3-dimensional MRI to CT. The PET/CT head holder was visible in the CT-AC map, whereas the UTE images were without the head holder. Therefore, the head holder shown in the CT image was extracted using a region-growing segmentation algorithm and added to the MR-based attenuation maps to allow a fair comparison. All PET images were reconstructed using the ordinary Poisson ordered-subset expectation maximization (subsets, 14; iterations, 3) algorithm through e7tool from Siemens Healthcare. After reconstruction, all PET data were spatially normalized to the SPM standard MRI T1 template to eliminate intersubject anatomic variability. The overall image processing steps are summarized in Supplemental Figure 2.
Image Analysis
The quantitative accuracies of the 2 MR-AC methods relative to CT-AC were compared using the similarity measurements of attenuation maps and absolute and relative differences between PET images.
The accuracy of the attenuation maps were evaluated using Dice similarity coefficients (40–42) that measure the overlap of the segmented bone and air regions of MR-AC maps with respect to those of CT-AC maps (1 for perfect overlap and 0 for no overlapping) according to the following equation:
where N is the number of bone (or air) voxels in each image. In the CT-AC map, the voxels with μ greater than 0.1134 (=300 Hounsfield units) were classified into bone and the voxels with μ less than 0.0475 (= −500 Hounsfield units) were air (32,41). The Dice coefficients were calculated for the entire head and for the cranial region, separately (40).
We measured the PET activity concentration in 5 regions of interest (ROIs) (caudate nucleus, putamen, thalamus, occipital, and cerebellum) for 18F-FP-CIT studies and 10 ROIs (frontal, temporal, parietal, occipital, insula, striatum, precuneus, amygdala/hippocampus, thalamus, and cerebellum) for 18F-FDG studies using an automatic ROI-delineation method with statistical probabilistic anatomic maps (43). The mean SUV of each ROI and its ratio to the cerebellum (SUVr) were calculated. The relative ratio of specific binding (binding ratio, [Cspecific – Cnonspecific]/Cnonspecific) was also calculated to assess the 18F-FP-CIT binding in the caudate nucleus and putamen (Cspecific and Cnonspecific: activity concentrations in specific and nonspecific [cerebellum] binding regions, respectively).
For the voxelwise comparison, all the PET images were spatially normalized as shown in Supplemental Figure 2, mean PET images of MR-AC and CT-AC were generated, and their absolute and relative difference maps were generated.
RESULTS
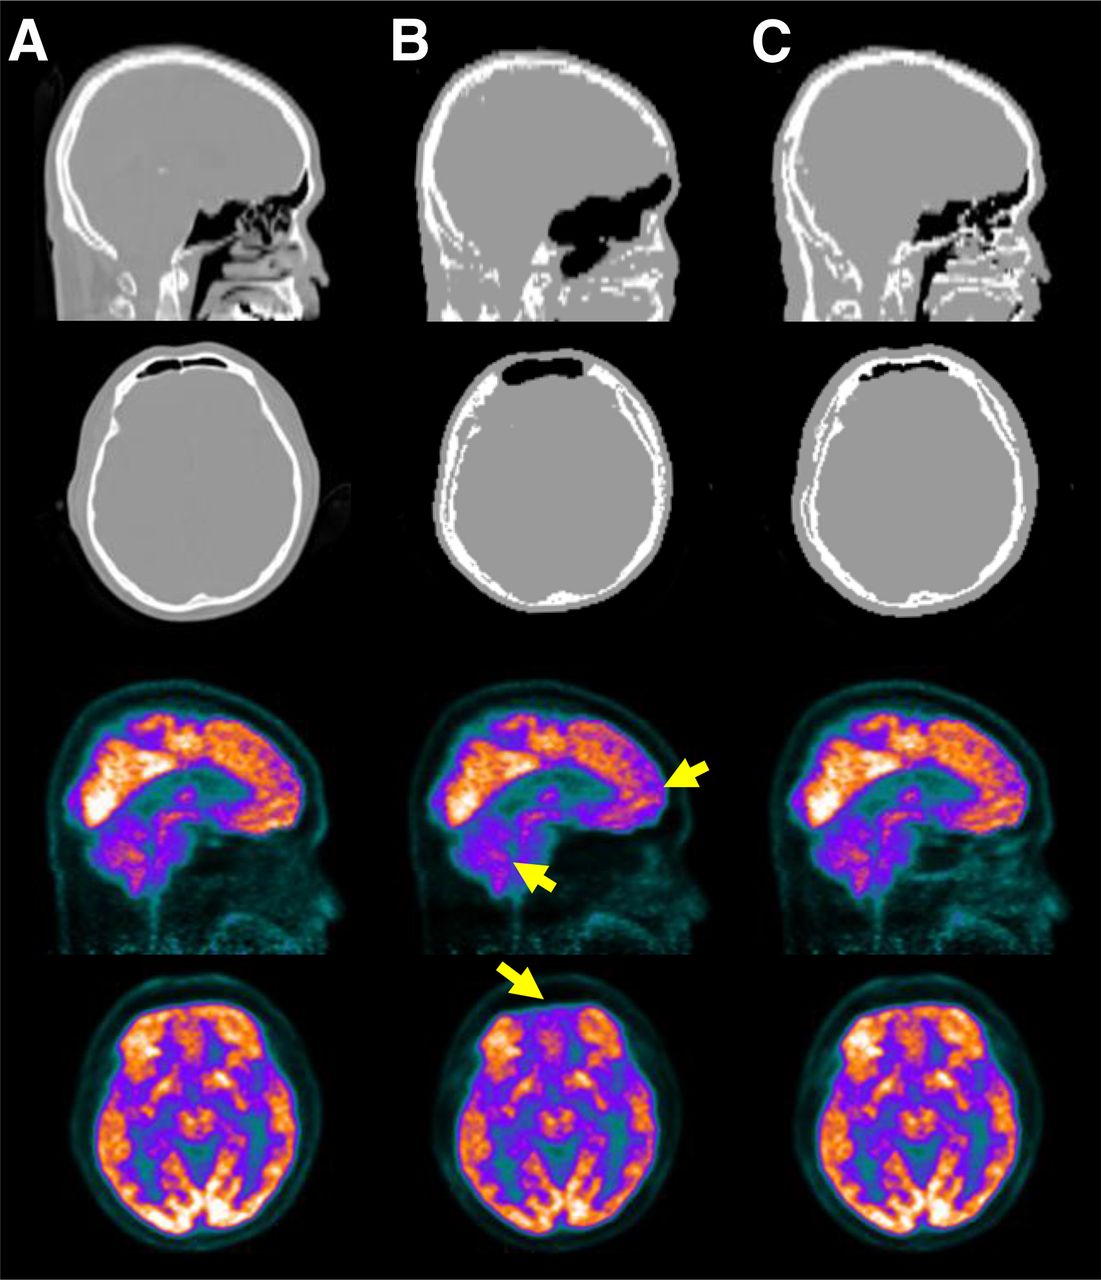
The results of CT-AC, MR-ACmMR, and MR-AClevel applied to the same emission data acquired using PET/CT machines are compared in Figures 3 and 4 (Fig. 3 for 18F-FP-CIT PET with VB18P mMR software, Fig. 4 for 18F-FDG PET and VB20P). The MR-ACmMR map gave larger air cavities than CT regardless of the version of mMR software. The bone tissue in the MR-ACmMR map was underestimated in VB18P (Fig. 3B) and overestimated in VB20P (Fig. 4B). On the contrary, MR-AClevel maps (Figs. 3C and 4C) showed more similar properties with CT (Figs. 3A and 4A) in the size and shape of the air cavities and bones. Although the striatal and cerebellar activity in 18F-FP-CIT PET and frontal activity in 18F-FDG PET were remarkably underestimated in MR-ACmMR relative to CT-AC (Figs. 3B and 4B), MR-AClevel did not show this discrepancy from CT-AC (Figs. 3C and 4C).

Attenuation maps and 18F-FP-CIT PET images corrected using them. (A) CT. (B) MR-ACmMR: MR-based attenuation map generated using mMR software version VB18P. (C) MR-AClevel: MR-based attenuation map generated using level-set method.

Attenuation maps and 18F-FDG PET images corrected using them. (A) CT. (B) MR-ACmMR using mMR software version VB20P. (C) MR-AClevel.
The Dice similarity coefficients between MR-AC and CT-AC maps are summarized in Table 1. The mean Dice coefficients for bone in MR-AClevel were 0.60 and 0.79 (VB18P and VB20P) for the whole head and 0.71 and 0.83 for the cranial region only, and all of them were higher than those in MR-ACmMR. There was the same trend for air regions.
Dice Similarity Coefficients for Whole Head and Cranial Bone (Mean ± SD)
The superiority of MR-AClevel to MR-ACmMR was confirmed in the ROI- and voxel-based quantitative comparisons. Figures 5 and 6 show the results of ROI-based analysis on 18F-FP-CIT and 18F-FDG PET data, respectively. In 18F-FP-CIT studies with MR-ACmMR, the percentage difference of SUV from CT-AC was greater than –20% in most ROIs (Fig. 5A). The percentage difference was most remarkable in the cerebellum, leading to the overestimation of SUVr, which was highest in the putamen (Fig. 5B). Conversely, the percentage difference of 18F-FP-CIT PET with MR-AClevel from CT-AC was smaller than 10% in both SUV and SUVr. The binding ratio values offered by the MR-AC methods were linearly correlated with those by CT-AC; nevertheless, the MR-AClevel (putamen: y = 1.04x ± 0.016; caudate: y = 1.04x ± 0.021) yielded a smaller bias than MR-ACmMR (putamen: y = 1.11x ± 0.038; caudate: y = 1.14x ± 0.073) (Supplemental Figs. 3–6).

Percentage difference of SUV (A) and SUVr (B) from CT-AC in 18F-FP-CIT PET.
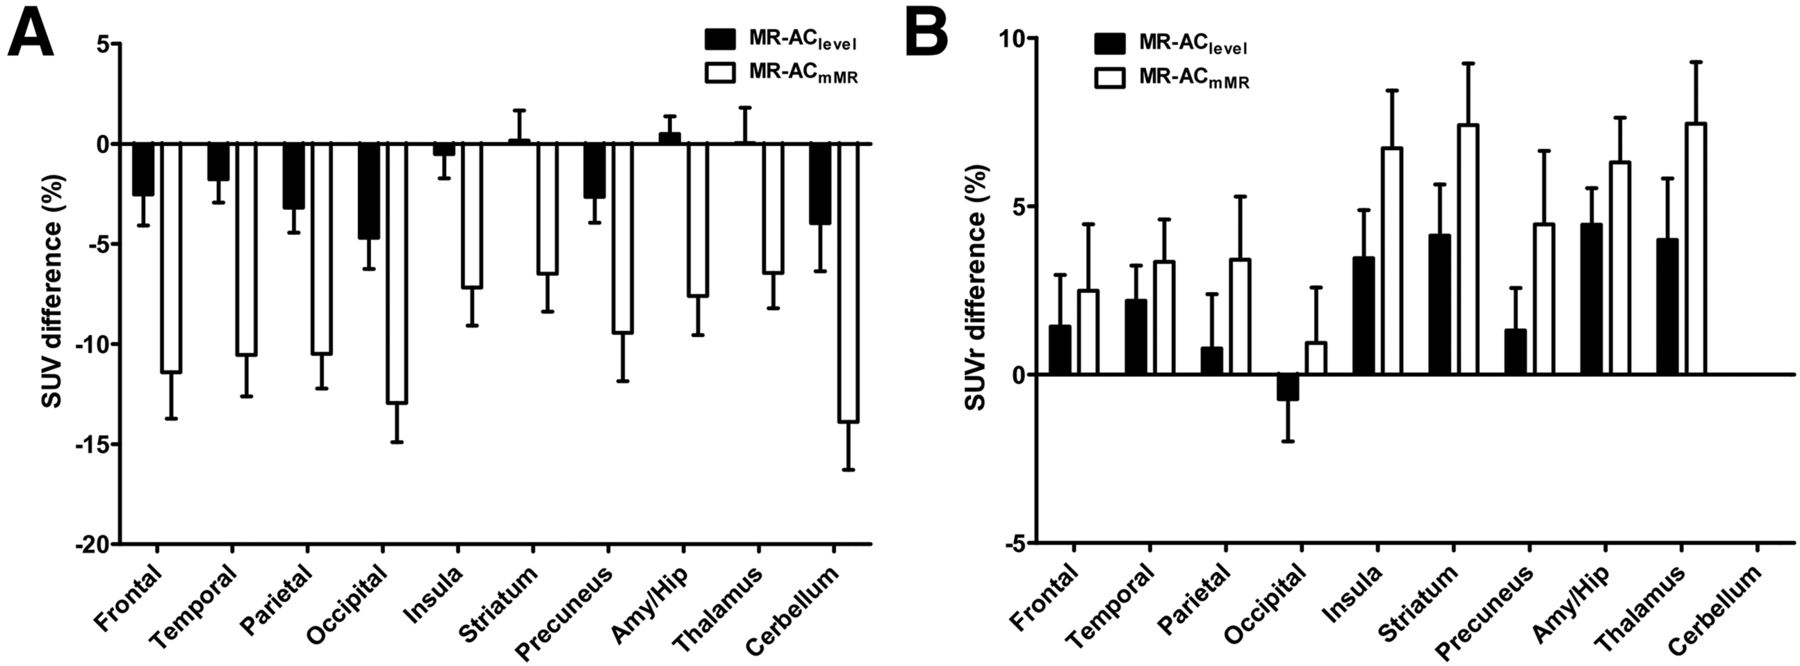
Percentage difference of SUV (A) and SUVr (B) from CT-AC in 18F-FDG PET.
The 18F-FDG PET tests showed a trend similar to the 18F-FP-CIT PET tests, whereas the percentage differences in SUV and SUVr between MR-AC and CT-AC were roughly half of those in 18F-FP-CIT PET (Fig. 6; Supplemental Figs. 7–9). Figure 7 shows that there was a remarkable difference in almost every brain region in the voxelwise comparison between MR-ACmMR and CT-AC. On the contrary, the difference between MR-AClevel and CT-AC was limited to the brain cortex. In both methods, the outer boundary of brain cortex, which is vulnerable to the brain size mismatch and registration error between CT and MRI and errors in skull segmentation, showed the largest differences.

Absolute (left) and percentage (right) difference of SUV in 18F-FDG PET images. (A) MR-AClevel with respect to CT-AC. (B) MR-ACmMR with respect to CT-AC.
DISCUSSION
In this study, we developed a new UTE MR-AC map based on a unified multiphase level-set segmentation and inhomogeneity correction method and demonstrated the superior performance of this method over the currently used MR-AC map in an mMR PET/MRI scanner. The remarkable improvements in the segmentation of air cavities and bone and the quantitative accuracy of PET measurement using the level-set method were shown in both the 18F-FP-CIT PET data using VB18P mMR software and the 18F-FDG PET data using VB20P.
The major upgrade of mMR software from VB18P to VB20P seems to be effective in the elimination of misclassification of cerebrospinal fluid in ventricles as air and the correction of bone underestimation shown in previous reports (33–35). The percentage error of MR-ACmMR in SUV and SUVr quantification relative to CT-AC was reduced approximately by half, although we could not confirm this error reduction using the exact same dataset. However, the current VB20P version still yields air cavity and bone segmentation errors as shown in Figure 4B. However, the MR-AClevel offered improved segmentation results, leading to the reduction of PET quantification error by a factor of approximately 3 as shown in Figure 5 (SUV error < 10% in MR-AClevel and < 30% in MR-ACmMR with VB18P, and < 5% in MR-AClevel and < 15% in MR-ACmMR with VB20P). The evaluation of attenuation maps using Dice coefficients confirmed the improvements in the MR-AC maps achieved by the level-set method (Table 1). For VB20P UTE datasets, MR-AClevel yielded the Dice coefficient for bone of 0.83 in the cranial region whereas MR-ACmMR offered 0.74 in this study and 0.65 in a previous study (40).
The results suggest that UTE MR-AClevel provides more accurate PET quantification than Dixon-based AC methods that yielded around 10%–20% errors in the study by Dickson et al. (33) and 5%–15% in the study by Izquierdo-Garcia et al. (17) depending on brain regions (larger error in cortical regions). Recent advanced template-based approaches (17) and new approaches with R2* to Hounsfield unit conversion (41) and zero-echo time (42) show results similar to our approach or great potential for further improvement of MR-AC. The combination of our approach with those methods would be the interesting next step that we can take to improve the MR-AC in brain and potentially in whole-body PET/MRI studies.
The advanced results using the level-set method can be attributed to the combined effects of various factors in this study. These factors include the inhomogeneity correction of UTE images incorporated into the level-set segmentation, which led to the more reliable segmentation results. The assorted boundary information provided by the multiphase level-set segmentations applied to both the UTE images were useful for determining the complex boundaries among different segments and trimming the segmentation results through morphologic operations on the binary images.
Although MR-AClevel yielded SUV quantification results almost equivalent to CT-AC in most brain regions, the errors in the cerebellum and occipital cortex were larger than in other regions (Figs. 5A and 6A). The errors in these most common reference regions in brain PET studies resulted in positive biases in binding ratios and SUVr estimations (Figs. 5B and 6B; Supplemental Figs. 5 and 6). It is most likely that the errors in these posterior and inferior brain regions are related to the misclassification of fat tissues in the neck as bone. This misclassification, also observed in Figures 3C and 4C, is likely caused by the image intensity brightening at the periphery of UTE images mainly because of the inhomogeneous B1 field associated with multichannel phased array coils (39,44).
Thus, we expect to achieve more accurate UTE segmentation and MR-based attenuation correction through the further optimization of UTE sequences (i.e., the reduction of off-resonance effects, robustness enhancement of non-Cartesian data acquisition, and saturation of fat tissues) (45).
CONCLUSION
We have developed a UTE MR-AC method using level-set segmentation with inhomogeneity correction for brain PET/MRI studies and demonstrated the feasibility of this method in brain PET/MRI studies with 18F-FP-CIT and 18F-FDG. The MR-based attenuation maps generated using level-set segmentation and PET images corrected for attenuation and scatter were superior to those offered by the manufacturer of the PET/MRI system in terms of the similarity to the CT-AC. This method will be useful for improving the quantitative accuracy of brain PET in PET/MRI studies.
DISCLOSURE
The costs of publication of this article were defrayed in part by the payment of page charges. Therefore, and solely to indicate this fact, this article is hereby marked “advertisement” in accordance with 18 USC section 1734. This work was supported by grants from the Ministry of Trade, Industry & Energy (10030030); the National Research Foundation of Korea (NRF-2014M3C7034000); and the Korea Health Industry Development Institute (HI13C01630200) and an Intramural Research Grant of Seoul National University (grant 0420130670, 2013-1290). No other potential conflict of interest relevant to this article was reported.
Footnotes
Published online Dec. 23, 2015.
- © 2016 by the Society of Nuclear Medicine and Molecular Imaging, Inc.
REFERENCES
- Received for publication July 9, 2015.
- Accepted for publication November 25, 2015.


