


Abstract
This study examined the value of a novel 1-step labeled integrin αvβ3–targeting 18F-AlF-NOTA-PRGD2 (denoted as 18F-RGD) scan in assessing sensitivity to concurrent chemoradiotherapy (CCRT) in patients with newly diagnosed glioblastoma multiforme (GBM). Methods: Twenty-five patients with newly diagnosed GBM were enrolled in this study 3–5 wk after surgical resection. All participants were investigated with 18F-RGD PET/CT on baseline (T1) and at the third week (T2) after the start of CCRT. Tumor volume, maximal and mean standardized uptake value of the tumor (SUVmax, SUVmean), and tumor-to-nontumor ratios of the tumor volume were obtained. The MRI treatment response was assessed at the 11th week (T3). The change in the lesion volume from T1 to T3 on MRI was used as an endpoint to evaluate the predictive ability of 18F-RGD PET/CT. Results: With 18F-RGD PET/CT imaging, we successfully visualized the residual lesions of GBM. Twenty-five and 23 18F-RGD PET/CT scans at baseline and the third week, respectively, were available for analysis. We found that 18F-RGD PET/CT parameters, both pretreatment SUVmax on baseline (P < 0.05) and intratreatment SUVmax at the third week (SUVmaxT2) (P < 0.05) and tumor-to-nontumor ratios at the third week (P < 0.05), were predictive of treatment sensitivity to CCRT. Additionally, the change of volume from T1 to T2 on MRI was also predictive (P < 0.05). According to receiver-operating-characteristic curve analysis, the most significant parameter was SUVmaxT2 (area under the curve, 0.846). The threshold of SUVmaxT2 was 1.35, and its sensitivity, specificity, and accuracy were 84.6%, 90.0% and 87.0%, respectively. Conclusion: 18F-RGD PET/CT allows for the noninvasive visualization of GBM lesions and the prediction of sensitivity to CCRT as early as 3 wk after treatment initiation.
Glioblastoma multiforme (GBM) is the most common malignant primary brain tumor (1). Resection followed by combined radiotherapy and temozolomide chemotherapy is the standard therapy protocol for patients with GBM (2–4). Even with the standard therapy, the prognosis is poor, with a median overall survival of approximately 15 mo (3,5).
Poor prognosis of GBM is mostly attributed to its high invasiveness and frequent recurrence. Studies have shown that the recurrent lesions are mostly located in areas 2 cm from the precursor lesions (6,7), and recurrence in situ occurs earlier than distant metastasis. Better control of the original lesions may thus help to improve the curative effect. Identifying the nonresponders and changing the treatment plan earlier are important for effective therapy. Therefore, the early assessment of sensitivity to concurrent chemoradiotherapy (CCRT) is the premise of personalized treatment for patients with GBM.
MRI is the most important diagnostic tool for assessing brain neoplasms. Assessment of treatment efficacy of GBM is usually performed by gadolinium-enhanced MRI in 2- to 3-mo intervals during treatment (2). However, conventional imaging techniques usually fail to detect the effects of radio- and chemotherapy at early time points because morphologic treatment effects may be visible only after several weeks or months (8–10). PET allows for the assessment of tumor changes at the molecular level and may offer the possibility of detecting the tumor response to therapy at a relatively early stage (9). However, recent studies have demonstrated that the diagnostic accuracy of 18F-FDG PET is weakened by high physiologic glucose metabolism in the brain areas in which glioma is prone to occur (11–13).
Various techniques have been developed to monitor the tumor response to therapy, including 18F-AlF-NOTA-PRGD2 PET/CT (denoted as 18F-RGD PET/CT). Arginine-glycine-aspartic acid (RGD) is a tripeptide sequence that can specifically bind to the integrin αvβ3 receptor, which plays an important role in promoting, sustaining, and regulating the angiogenesis and is expressed on tumor angiogenesis (9,10). It is widely accepted that the imaging of tumor angiogenesis can be used not only for the early detection of cancers but also for the monitoring of treatment outcomes (14). Haubner et al. (15) invented the first imaging agent for integrin, l8F-galacto-RGD, and successfully applied it in 9 patients with good tolerance and no adverse reactions. Schnell et al. (16) reported the first clinical research on 18F-galacto-RGD PET/CT scans in GBM patients and found that GBM demonstrated significant but heterogeneous RGD uptake, with the maximum uptake occurring in the highly proliferating and infiltrating areas of tumors, in which αvβ3 expression was prominent in tumor microvessels. Thereafter, l8F-fluciclatide-RGD, l8F-RGD-K5, and l8F-FP-PRGD2 emerged. Studies showed that tumor uptake correlated well with the expression of integrin αvβ3. However, the radiochemical syntheses of these 18F-labeled RGD tracers are complicated and time-consuming, which limits the clinical applications of this imaging agent.
In this prospective clinical study, a novel 1-step labeled integrin αvβ3–targeting PET probe, 18F-AlF-NOTA-PRGD2, was used to evaluate sensitivity to CCRT in patients with newly diagnosed GBM.
MATERIALS AND METHODS
Patients
Twenty-five patients with newly diagnosed GBM and residual postoperative lesions were enrolled prospectively in this study (Table 1). There were 15 men and 10 women, with a median age of 49.5 y (age range, 30–64 y). All patients gave written consent to participate in this study, which was approved by the ethics committee of Shandong Tumor Hospital, and met the following inclusion criteria—patients had a histologically confirmed diagnosis of GBM and previously undergone surgical resection, they had MRI-based residuum postoperatively, and they were at least 18 y old and had the ability to provide written and informed consent. Further criteria included a Karnofsky performance score 70 or greater, adequate hematologic values, and sufficient hepatic and renal function. The exclusion criteria were pregnancy and inability to complete the required examinations.
Patient Characteristics
Treatment
All patients were treated with radiotherapy and temozolomide 3–5 wk after surgery. In all patients, a total dose of 60 Gy was administered to the planning target volume, defined as the contrast-enhanced area from pre- and postoperative MRI including a safety margin of 2 cm and including the surrounding preoperative edema. The dose was prescribed to the reference point of the International Commission on Radiation Units and Measurements, and the fractionation was 2 Gy daily, 5 times weekly. Concurrent temozolomide was administered at 75 mg/m2/d during radiation over 6 wk, followed by a 4-wk rest phase (no temozolomide) and cycles of adjuvant temozolomide on days 1–5 of each 28-d cycle. The first adjuvant cycle was dosed at 150 mg/m2/d. If tolerated, subsequent cycles of adjuvant temozolomide were dosed at 200 mg/m2/d.
18F-RGD PET/CT Imaging
PET/CT imaging was performed on a dedicated PET system (Discovery LS; GE Healthcare). The simple lyophilized kit for labeling the PRGD2 peptide was purchased from Jiangsu Institute of Nuclear Medicine, and the synthesis process was performed in accordance with previous studies (17). The radiochemical purity of the 18F-RGD exceeded 95%, and its specific radioactivity exceeded 37 GBq (1,000 mCi)/μmol. There was no specific subject preparation, and patients did not undergo fasting and did not receive CT contrast agents. 18F-RGD (224.56 ± 38.2 MBq) was injected intravenously in all patients, who were then allowed to rest for about 50 min. Scanning was performed with an integrated in-line PET/CT system (Discovery LS; GE Healthcare). PET emission images were obtained for the whole head, and the spiral CT component was performed with an x-ray tube voltage peak of 140 kV, 80 mA, a pitch of 6:1, a slice thickness of 4.25 mm, and a rotation speed of 0.8 s per rotation. A full-ring dedicated PET scan of the same axial range followed. Patients were in normal shallow respiration during image acquisition. The images were attenuation-corrected with the transmission data from CT. The attenuation-corrected PET images, CT images, and fused PET/CT images, displayed as coronal, sagittal, and transaxial slices, were viewed on a Xeleris workstation (GE Healthcare).
Image Analysis
Standard visual image interpretation was performed independently by 2 experienced nuclear medicine physicians for 18F-RGD PET/CT studies with MRI as a reference. The radiotracer concentration in the regions of interest was normalized to the injected dose per kilogram of the patient’s body weight to derive the SUV.
Tumor volumes (TVs) were defined as the sum of the metabolic volumes of the remaining tumors, which were derived from attenuation-corrected 18F-RGD PET images. TV was obtained by including all voxels that fell within an SUV threshold determined by the SUVmean of the contralateral striatum. In cases in which the tumor involved the striatum bilaterally, a threshold of 1.5 of the SUVmean of the normal hemispheric background was used (18). The normal reference brain region was defined by drawing regions of interest involving the entire contralateral hemisphere at the level of the centrum semiovale (8).
MRI
All patients underwent routine MRI using a 3.0-T MRI system with pulse sequences supplied by the scanner manufacturer. Sequences including axial proton density, T1- and T2-weighted fast spin-echo images, and fluid-attenuated inversion recovery images were included. In addition, gadopentetate dimeglumine–enhanced (Magnevist; Berlex) axial and coronal T1-weighted images were acquired after contrast injection. The first MRI scan was obtained immediately before the start of CCRT (pretreatment, T1), the second MRI scan was obtained on the third week after the start of standard treatment (intratreatment, T2), and the third MRI scan was acquired 4 wk after the completion of CCRT (posttreatment, T3).
The volume of GBM lesions (VOL) was calculated simply as the lesion area multiplied by the slice thickness (19). The lesion areas were obtained by manual outlines from T1-enhanced images combined with T2 fluid-attenuated inversion recovery images of MRI. The changes of lesion volume (ΔVOLT1–2, ΔVOLT1–3) were calculated by (VOLT2 − VOLT1)/VOLT1 and (VOLT3 − VOLT1)/VOLT1.
Statistical Analysis
A statistical analysis was performed using the commercial software SPSS 17.0 (MedCalc Software) and MedCalc 11.0.1.0 (MedCalc Software Bvba, used to perform receiver-operating-characteristic [ROC] curve analysis). Twenty-five patients were classified as responders and nonresponders according to the median value of ΔVOLT1–3 based on MR images. The 2-sample t test and Wilcoxon rank-sum test were used to compare the difference between the responder and nonresponder groups. Multiple clinical variables such as age, sex, and Karnofsky performance score were tested by univariate and multivariate analyses to identify the relationship between these clinical variables and the short-term outcome. The ROC curve analysis was used to obtain the threshold and determine the diagnostic accuracy of 18F-RGD PET parameters in identifying responders and nonresponders.
RESULTS
Tumor Response
All 25 patients completed the entire CCRT, and 25, 24, and 25 MRI scans at T1, T2, and T3, respectively, were available for analysis. In our study, we used 2 methods to evaluate radiographic response rate. According to the Response Assessment in Neuro-Oncology (RANO) criteria, 11 patients were classified as responders (44%), including 4 complete response and 7 partial response, and 14 patients were classified as nonresponders (56%), including 10 stable disease and 4 progressive disease. According to the volume of residual lesions on MRI (Tables 2 and 3), 25 patients were classified as responders (11 patients) and nonresponders (14 patients) according to median value of ΔVOLT1–3 (58%).
Tumor Response Comparison by Different Criteria in Patients with Newly Diagnosed Glioblastoma
Lesion Volume Change on MRI in Patients with Newly Diagnosed Glioblastoma
The data obtained from the 2 methods described above are shown in Table 2.
18F-RGD PET/CT Imaging Ability
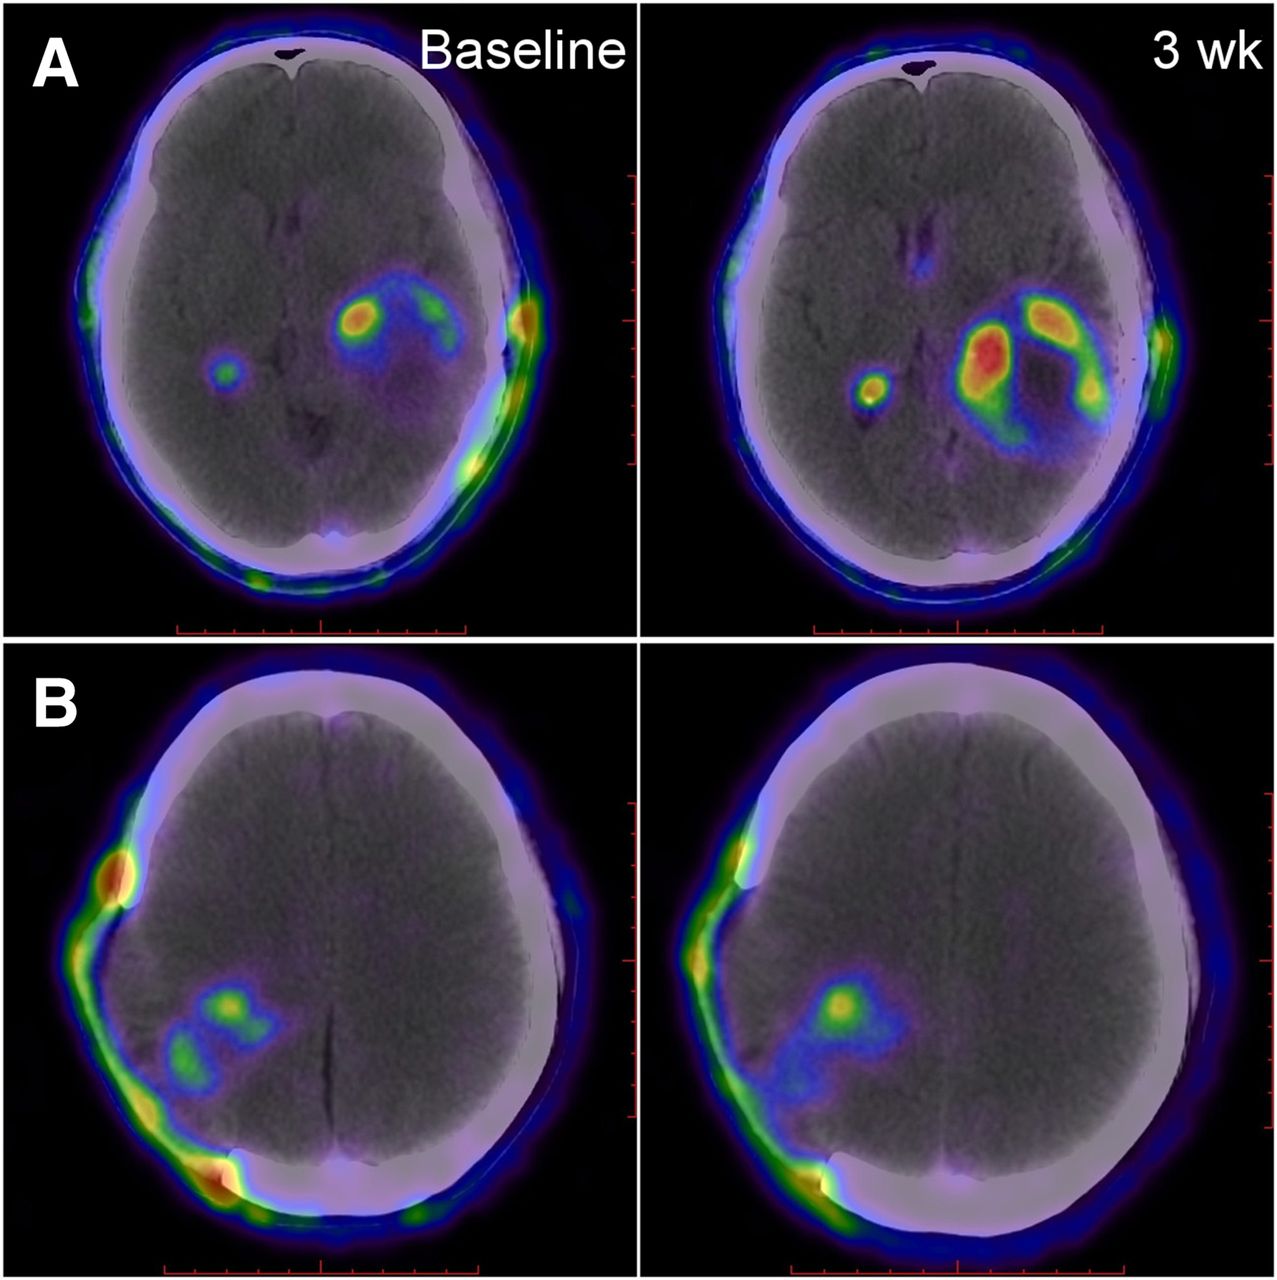
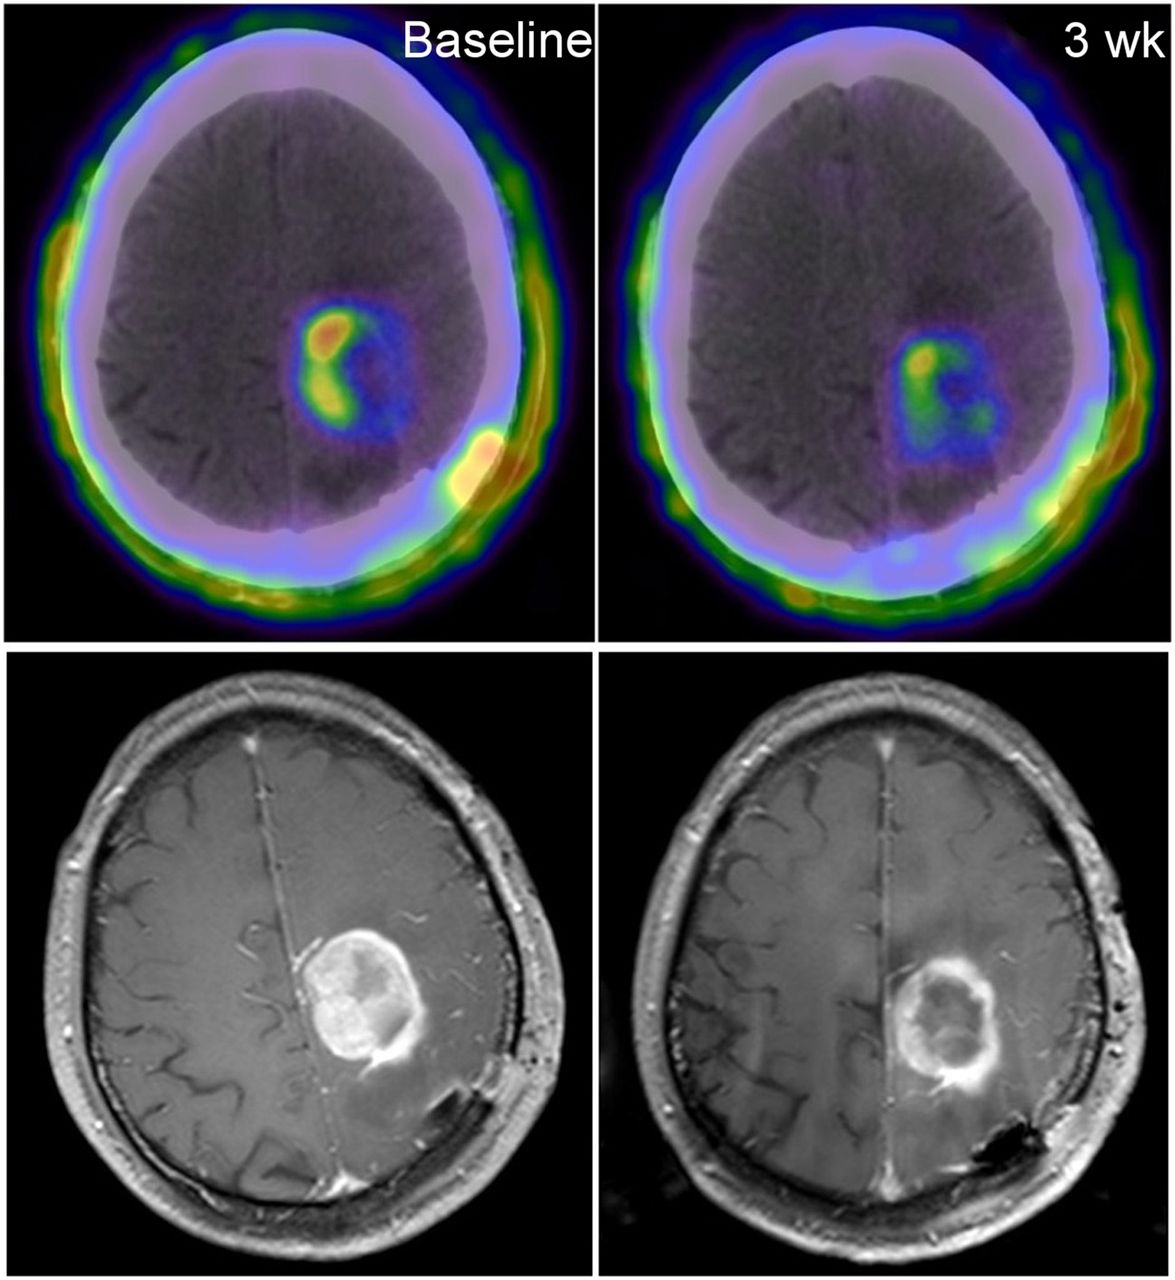
With 18F-RGD PET/CT imaging, the lesions of all the patients were well visualized (Fig. 1). The residual lesions of GBM had a good uptake of 18F-RGD, whereas the normal brain tissue maintained a low level of uptake of the imaging probe. The high target-to-background ratios made the PET imaging contrasting. As demonstrated, along with the target lesions, the choroid plexus of the ventricle and injury to the scalp and skull inevitably exhibited good uptake of the imaging probe. However, this did not obstruct our observation of the lesions. In addition, relative to MR imaging, lesions were imaged more clearly (Fig. 2).

Comparison of 18F-RGD PET/CT and MRI at baseline and 3 wk (patient 19; Table 2).
18F-RGD PET/CT Parameters
All 25 patients completed the 18F-RGD PET/CT scans at T1, and 23 completed them at T2. When the 2 groups were compared, significant differences were found in SUVmaxT1 (the maximal SUV on baseline) and T/NTT1 (tumor-to-nontumor [T/NT] ratios on baseline) between responders and nonresponders. The SUVmaxT1 of responders was lower than that of nonresponders (1.37 ± 0.40 vs. 2.14 ± 1.00, P < 0.05). The T/NTT1 of responders was also lower than that of nonresponders (17.59 ± 6.87 vs. 26, 17.11, P < 0.05).
The difference in intratreatment parameters (such as SUVmaxT2, T/NTT2 [T/NT ratios on the third week] and TVT2 [tumor volume on the third week]) between the 2 groups was also statistically significant. The SUVmaxT2, T/NTT2, and TVT2 of responders were lower than those of nonresponders (1.03 ± 0.39 vs. 2.19 ± 1.12, P < 0.05; 13.11, 9.51 vs. 36.58 ± 25.90, P < 0.05; and 14,621.30 ± 11,613.37 vs. 34,304.00, 49164.00, P < 0.05, respectively).
In addition, the change of TV (ΔTV) of the 2 groups was also different. The ΔTV of responders was higher than that of nonresponders (−52.95% ± 26.80% vs. –12.93% ± 42.53%, P < 0.05). However, 18F-RGD PET SUVmean and its changes through therapy were not different between the 2 groups.
18F-RGD PET/CT Parameters Compared with Other Predictors
Multiple clinical variables were tested by univariate and multivariate analyses. According to univariate analyses, baseline characteristics, such as patients’ age, sex, and baseline Karnofsky performance score, did not predict short-term outcome. According to multivariate analyses, baseline characteristics considered in the multivariate models, the pretreatment parameter SUVmaxT1 (P < 0.05), and the intratreatment parameters SUVmaxT2 (P < 0.05) and T/NTT2 (P < 0.05) were significant predictors of CCRT sensitivity. However, the changes of TV (P = 0.06) and TVT2 (P = 0.072) were not predictive for short-term outcome.
Optimal 18F-RGD PET/CT Criteria for Sensitivity of Chemoradiotherapy Prediction
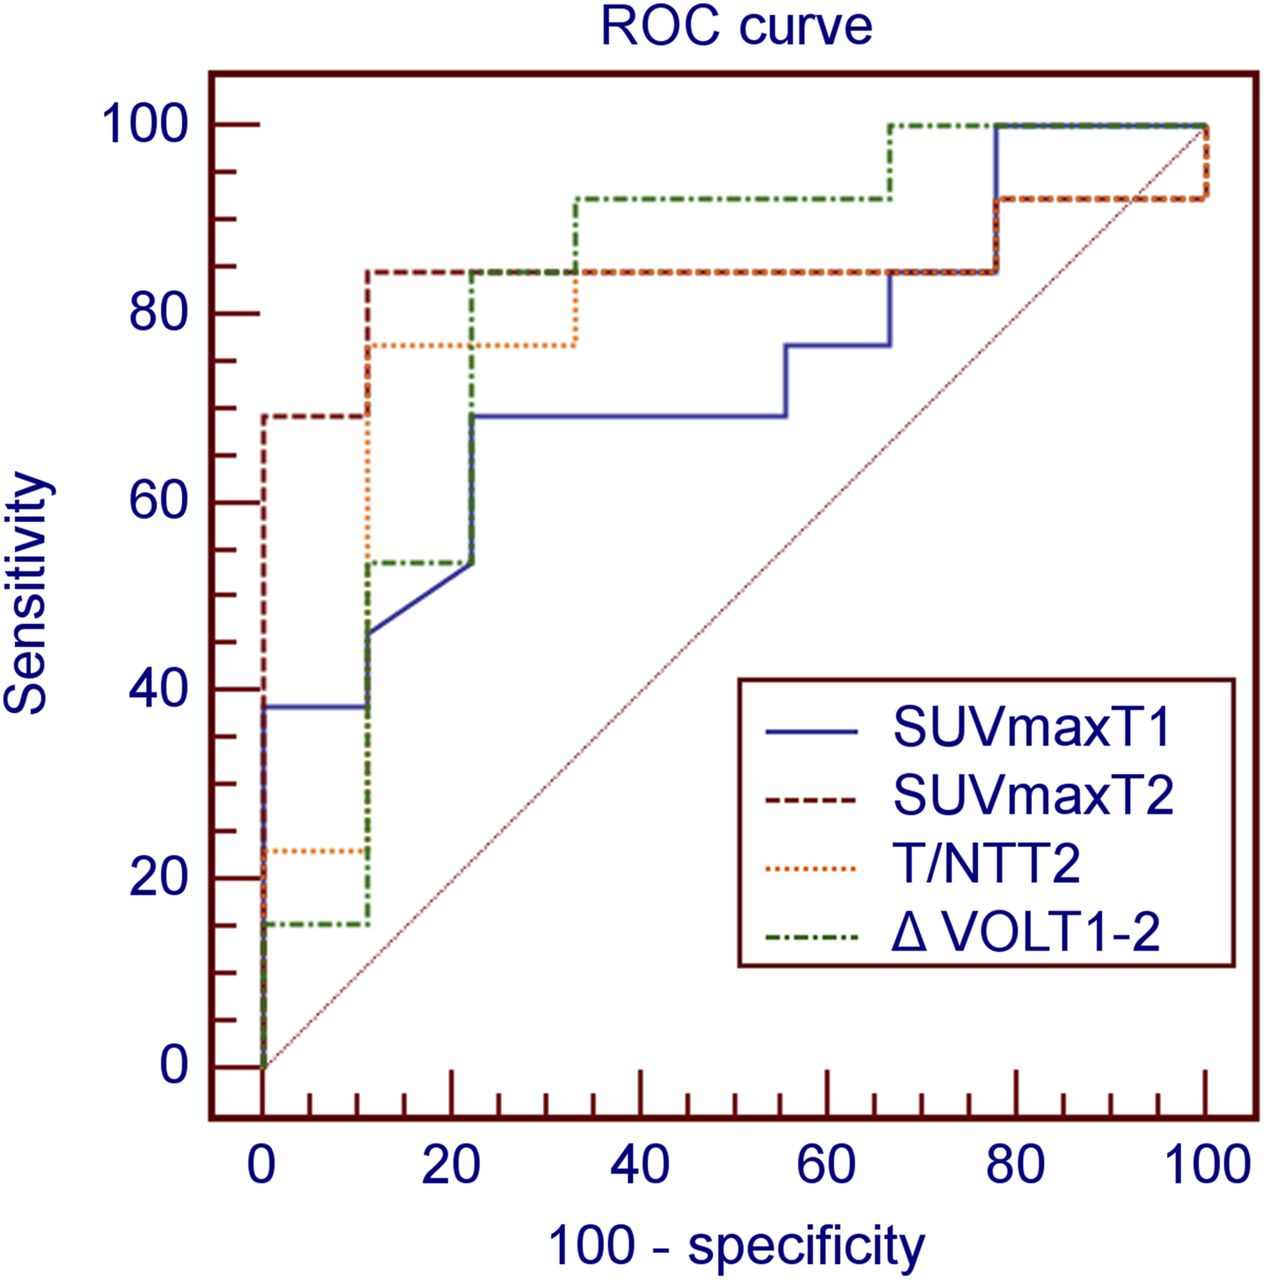
ROC curve analysis was performed to determine the diagnostic accuracy of the 3 parameters (SUVmaxT1, SUVmaxT2, and T/NTT2) in identifying responders. By ROC curve analysis, the most significant parameter was SUVmaxT2 (area under the curve [AUC], 0.846) (Fig. 3). The threshold of SUVmaxT2 was 1.35, and its sensitivity, specificity, and accuracy were 84.6%, 90.0%, and 87.0%, respectively. The threshold of T/NTT2 (AUC, 0.785) was 19.30 and its sensitivity, specificity, and accuracy were 76.9%, 90.0%, and 82.6%, respectively. The threshold of SUVmaxT1 (AUC, 0.737) was 1.57, and its sensitivity, specificity, and accuracy were 71.4%, 81.8%, and 76.0%, respectively.

ROC curves of parameters.
In addition, we compared the predictive ability of 18F-RGD PET/CT parameters and the volumetric parameters of MR images. Statistical analyses revealed that VOLT1 and VOLT2 were not predictive of short-term outcome (P > 0.05 and >0.05, respectively), but ΔVOLT1–2 did predict short-term outcome (P < 0.05). According to ROC curve analysis, the threshold of ΔVOLT1–2 (AUC, 0.786) was −27.68%, and its sensitivity, specificity, and accuracy were 71.4%, 80.0%, and 75.0%, respectively (Fig. 3). Consequently, by contrast, the predictive ability of 18F-RGD PET SUVmaxT2 was superior to ΔVOLT1–2 of MRI relative to the sensitivity to CCRT.
DISCUSSION
In this study, a novel 1-step labeled integrin αvβ3–targeting 18F-RGD was used to image the residual GBM. Similar to the other approved imaging agents, 18F-RGD shows excellent capability for both in vitro serum stability and in vivo tumor imaging (14). As for the other RGD imaging agents above, the advantage of this novel imaging agent is its simple and convenient process of radiosynthesis, which can be completed within 30 min. Its radiosynthesis improves its efficiency of imaging and clinical application. As shown in Figures 1 and 2, with 18F-RGD PET/CT, lesions of GBM are well imaged with a good tumor-to-background ratio. Furthermore, both the lesions and their infiltrative area into the surrounding brain parenchyma were well imaged.
We have found that the parameters of 18F-RGD PET/CT can predict sensitivity to CCRT as early as the third week when the dose of radiation reached 30 Gy. 18F-RGD PET/CT intratreatment parameters, such as SUVmaxT2 (P < 0.05) and T/NTT2 (P < 0.05), are prognostic of treatment sensitivity to CCRT. According to ROC curves, the most significant parameter was SUVmaxT2 (AUC, 0.833) to predict the short-term outcome. The threshold of SUVmaxT2 was 1.35, and its sensitivity, specificity and accuracy were 83.3%, 88.9%, and 85.7%, respectively. The threshold of T/NTT2 (AUC, 0.769) was 19.30, and its sensitivity, specificity, and accuracy were 75.0%, 88.9%, and 81.0%, respectively.
Moreover, 18F-RGD PET/CT pretreatment parameters can also predict the short-term outcome. It identified nonresponders when the SUVmaxT1 (AUC, 0.737) was greater than 1.57, and its sensitivity, specificity, and accuracy were 71.4%, 81.8%, and 76.0%, respectively. However, the pretreatment parameters of 18F-RGD PET/CT are not as valuable as intratreatment parameters. In addition, we compared the predictive ability of 18F-RGD PET/CT parameters and the volumetric parameters on MRI. By ROC curve analysis, the predictive ability of 18F-RGD PET/CT parameters were superior to the volumetric parameters of MRI.
Why can the SUVmaxT2 reflect sensitivity to CCRT? Recent work suggests that integrin αvβ3 is expressed at high levels on the surface of both glioma cells and endothelial cells of angiogenesis (20). The expression of αvβ3 on tumors is related to its proliferative and metastatic properties (21,22). GBM cells can differentiate into endothelial cells and pericytes, thus providing a means of tumor vascularization (23). Angiogenesis (the formation of new blood vessels from existing ones) is a vital process in the progression of GBM and is responsible for the growth of tumors. Therefore, angiogenesis imaging with RGD PET may reflect the treatment sensitivity of GBM. When CCRT is attributed to the tumor, angiogenesis shrink may be before tumor cell death and the amount of αvβ3 will drop before tumor shrinkage. Thereby, to some extent, the value of SUV on RGD PET may reflect the sensitivity to concurrent CCRT.
Why was it that the intratreatment parameters at the T2 time point were more precise than those at T1? In our study, all participants underwent partial surgical resection. As a consequence, the postoperative repair of normal brain tissues followed by extensive angiogenesis made the expression of αvβ3 upregulated at baseline (3–5 wk after surgical resection). The upregulated expression of αvβ3 of injured normal brain tissues induced by surgical resection made the pretreatment PET parameters of the operation area and residual lesion complicated. At the third week of treatment, the influence of repair following resection was weakened.18F-RGD parameters at this time point can reflect the real level of αvβ3 expressed on cells and angiogenesis of GBM.
Additionally, several factors need to be further clarified. (1) Why was the lesion volume change determined by MRI used as the gold standard instead of RANO criteria in this study? In fact, we have correlated PET data to treatment response measured by RANO criteria, and there was no PET difference between responders and nonresponders. The results were unreasonable when inappropriate criteria were used. For example, participants 1 and 2 exhibited changes in lesion volume of −73% and −70%, respectively; however, according to the RANO criteria, they were classified as nonresponders. Participant 12 was classified as a responder but had a lesion volume that was reduced by 55%. The most important reason may be that the residual lesions after resection were characterized by cavities and irregular shapes, and the 2-dimensional measurement per RANO criteria cannot reflect the real response of GBM after CCRT. Several studies (24–26) have shown that volumetric measurement is superior to 2-dimensional measurement in evaluating the radiographic response of GBM. Wen et al. (27) believed that the use of volumetric assessment would allow for more accurate determination of the contrast-enhancing and nonenhancing volumes and overcome the limitations of 2-dimensional measurements of lesions surrounding a surgical cavity. Therefore, in our study, we chose the change of lesion volume as the evaluation criteria. (2) Contrary to other studies (8,28), it seems that all changes in 18F-RGD parameters (ΔSUVmax, ΔT/NT, and ΔTV) have no close relationship to short-term outcome in this study. Perhaps this mostly depends on the influence from baseline parameters. For example, according to ΔSUVmax = (SUVmaxT2 − SUVmaxT1)/SUVmaxT1, if the confounding factor of SUVmaxT1 is too large, ΔSUVmax cannot represent the real change ratio of the 2 time points. Maybe it is more valuable for baseline and the change of parameters to evaluate the treatment response of patients who have not undergone surgical resection. (3) Is there any inflammatory reaction at the intratreatment phase and will this affect the tracer uptake? There may be traumatic inflammation caused by operation that exists until the intratreatment phase. But the level of inflammation should keep going down from operation to the intratreatment phase. Studies (29,30) showed that inflammation increased the uptake of RGD tracer. Thereby, the inflammation influence to SUVmaxT2 is smaller than that to SUVmaxT1. (4) What is the relationship between tumor blood perfusion and tracer uptake? Lu N et al. (31) reported that higher levels of tumor angiogenesis (accordingly, the tracer uptake will be high) were accompanied by higher blood perfusion of tumor. However, the direct relationship of tumor blood perfusion and RGD tracer uptake has not yet been reported. (5) Will the local blood–brain barrier disruption affect the tracer uptake? Most GBM patients have variable regions of disruption of blood–brain barrier. Generally blood–brain barrier disruption will upregulate the tracer uptake (32,33). (6) Are there any changes of integrin αvβ3 induced by CCRT? In the current study, there was a significant SUVmax decrease from T1 to T2 (SUVmaxT1 vs. SUVmaxT2, 1.37 ± 0.40 vs. 1.03 ± 0.40, P < 0.05) in the responder group, whereas there was no significant change in the nonresponder group (2.14 ± 1.00 vs. 2.19 ± 1.12, P > 0.05). Thereby, CCRT can lead to reduction of αvβ3 in sensitive tumors.
In conclusion, 18F-RGD PET/CT can predict treatment sensitivity to CCRT in patients with newly diagnosed GBM as early as the third week after treatment initiation, and patients may have worse efficacy of CCRT with SUVmax (the third week) higher than 1.35. This may be a great help to the adjustment of the clinical therapy scheme (34) and personalized treatment. In addition, considering the ease of preparation and good imaging qualities, 18F-AlF-NOTA-PRGD2 may be a promising alternative to other RGD agents for PET imaging of integrin αvβ3 expression (14).
The limitation of this study was the small number of included patients. These results must be validated in a larger prospective study.
CONCLUSION
This study demonstrated that PET imaging using 18F-RGD allows for the noninvasive visualization of GBM lesions. Additionally, 18F-RGD PET/CT provided a powerful tool to assess sensitivity to CCRT in patients with newly diagnosed GBM. In this study, the prediction of treatment response was early and time-saving, and 18F-RGD PET/CT is appropriate for clinical use to supply valuable information. A further and larger validation study is needed to test the potential of 18F-RGD PET/CT in guiding treatment decisions.
DISCLOSURE
The costs of publication of this article were defrayed in part by the payment of page charges. Therefore, and solely to indicate this fact, this article is hereby marked “advertisement” in accordance with 18 USC section 1734. This study was funded by the Natural Science Foundation of China (NSFC81472812, NSFC81372413, and NSFC81172133), the Outstanding Youth Natural Science Foundation of Shandong Province (2014JQ223), and Natural Science Foundation of Shandong Province, China (ZR2012HL41). No other potential conflict of interest relevant to this article was reported.
Footnotes
Published online Oct. 29, 2015.
- © 2016 by the Society of Nuclear Medicine and Molecular Imaging, Inc.
REFERENCES
- Received for publication August 13, 2015.
- Accepted for publication October 16, 2015.


Jump to section
Related Articles
Cited By...
- The Role of Radiation Oncology in Immuno-Oncology
- In Vivo Characterization of 4 68Ga-Labeled Multimeric RGD Peptides to Image {alpha}v{beta}3 Integrin Expression in 2 Human Tumor Xenograft Mouse Models
- Recent Advances in 18F Radiochemistry: A Focus on B-18F, Si-18F, Al-18F, and C-18F Radiofluorination via Spirocyclic Iodonium Ylides
- RGD PET: From Lesion Detection to Therapy Response Monitoring