
Main menu

  • Home
  • Content
    • Current
    • Ahead of print
    • Past Issues
    • JNM Supplement
    • SNMMI Annual Meeting Abstracts
    • Continuing Education
    • JNM Podcasts
  • Subscriptions
    • Subscribers
    • Institutional and Non-member
    • Rates
    • Journal Claims
    • Corporate & Special Sales
  • Authors
    • Submit to JNM
    • Information for Authors
    • Assignment of Copyright
    • AQARA requirements
  • Info
    • Reviewers
    • Permissions
    • Advertisers
  • About
    • About Us
    • Editorial Board
    • Contact Information
  • More
    • Alerts
    • Feedback
    • Help
    • SNMMI Journals
  • SNMMI
    • JNM
    • JNMT
    • SNMMI Journals
    • SNMMI

User menu

  • Subscribe
  • My alerts
  • Log in
  • My Cart

Search

  • Advanced search
Journal of Nuclear Medicine
  • SNMMI
    • JNM
    • JNMT
    • SNMMI Journals
    • SNMMI
  • Subscribe
  • My alerts
  • Log in
  • My Cart
Journal of Nuclear Medicine

Advanced Search

  • Home
  • Content
    • Current
    • Ahead of print
    • Past Issues
    • JNM Supplement
    • SNMMI Annual Meeting Abstracts
    • Continuing Education
    • JNM Podcasts
  • Subscriptions
    • Subscribers
    • Institutional and Non-member
    • Rates
    • Journal Claims
    • Corporate & Special Sales
  • Authors
    • Submit to JNM
    • Information for Authors
    • Assignment of Copyright
    • AQARA requirements
  • Info
    • Reviewers
    • Permissions
    • Advertisers
  • About
    • About Us
    • Editorial Board
    • Contact Information
  • More
    • Alerts
    • Feedback
    • Help
    • SNMMI Journals
  • View or Listen to JNM Podcast
  • Visit JNM on Facebook
  • Join JNM on LinkedIn
  • Follow JNM on Twitter
  • Subscribe to our RSS feeds
Research ArticleBasic Science Investigations

Detection of Cyclooxygenase-1 in Activated Microglia During Amyloid Plaque Progression: PET Studies in Alzheimer’s Disease Model Mice

Miho Shukuri, Aya Mawatari, Masahiro Ohno, Masaaki Suzuki, Hisashi Doi, Yasuyoshi Watanabe and Hirotaka Onoe
Journal of Nuclear Medicine February 2016, 57 (2) 291-296; DOI: https://doi.org/10.2967/jnumed.115.166116
Miho Shukuri
1Division of Bio-Function Dynamics Imaging, Center for Life Science Technologies, RIKEN, Kobe, Hyogo, Japan
2Laboratory of Physical Chemistry, Showa Pharmaceutical University, Machida, Tokyo, Japan; and
  • Find this author on Google Scholar
  • Find this author on PubMed
  • Search for this author on this site
Aya Mawatari
1Division of Bio-Function Dynamics Imaging, Center for Life Science Technologies, RIKEN, Kobe, Hyogo, Japan
  • Find this author on Google Scholar
  • Find this author on PubMed
  • Search for this author on this site
Masahiro Ohno
1Division of Bio-Function Dynamics Imaging, Center for Life Science Technologies, RIKEN, Kobe, Hyogo, Japan
  • Find this author on Google Scholar
  • Find this author on PubMed
  • Search for this author on this site
Masaaki Suzuki
3National Center for Geriatrics and Gerontology, Obu, Aichi, Japan
  • Find this author on Google Scholar
  • Find this author on PubMed
  • Search for this author on this site
Hisashi Doi
1Division of Bio-Function Dynamics Imaging, Center for Life Science Technologies, RIKEN, Kobe, Hyogo, Japan
  • Find this author on Google Scholar
  • Find this author on PubMed
  • Search for this author on this site
Yasuyoshi Watanabe
1Division of Bio-Function Dynamics Imaging, Center for Life Science Technologies, RIKEN, Kobe, Hyogo, Japan
  • Find this author on Google Scholar
  • Find this author on PubMed
  • Search for this author on this site
Hirotaka Onoe
1Division of Bio-Function Dynamics Imaging, Center for Life Science Technologies, RIKEN, Kobe, Hyogo, Japan
  • Find this author on Google Scholar
  • Find this author on PubMed
  • Search for this author on this site
  • Article
  • Figures & Data
  • Supplemental
  • Info & Metrics
  • PDF
Loading

Article Figures & Data

Figures

  • Tables
  • Additional Files
  • FIGURE 1.
    • Download figure
    • Open in new tab
    • Download powerpoint
    FIGURE 1.

    Synthesis of (R)- and (S)-11C-KTP-Me via rapid C-11C-methylation and chiral resolution.

  • FIGURE 2.
    • Download figure
    • Open in new tab
    • Download powerpoint
    FIGURE 2.

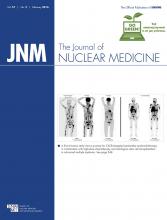
    Representative PET images and time–radioactivity curves of each 11C-KTP-Me enantiomer in rat brain after lipopolysaccharide injection. (A) Transaxial rat brain views of SUV-summed PET images from 5 to 45 min after tracer injection were coregistered with individual MR images at baseline. (S)-11C-KTP-Me showed higher accumulation and superior specificity in rat brain hemisphere than (RS)- and (R)-11C-KTP-Me. (B) Quantitative time–radioactivity curves of each 11C-KTP-Me enantiomer in contralateral (Contra) and ipsilateral (Ipsi) striatum. Data are expressed as SUV and are mean ± SD ((R)-[11C]KTP-Me, n = 3; others, n = 4).

  • FIGURE 3.
    • Download figure
    • Open in new tab
    • Download powerpoint
    FIGURE 3.

    Age-dependent changes in (S)-11C-KTP-Me accumulation in brain of APP-Tg 2576 and wild-type mice. Representative ex vivo autoradiographs of coronal sections of mice at 15 min after PET tracer injection. Progressive and remarkable increases in (S)-11C-KTP-Me in frontal cortex, parietal occipital cortex, and hippocampus of APP-Tg mice from 16 mo old. Range bar represents intensity of photostimulated luminescence (PSL/mm2).

  • FIGURE 4.
    • Download figure
    • Open in new tab
    • Download powerpoint
    FIGURE 4.

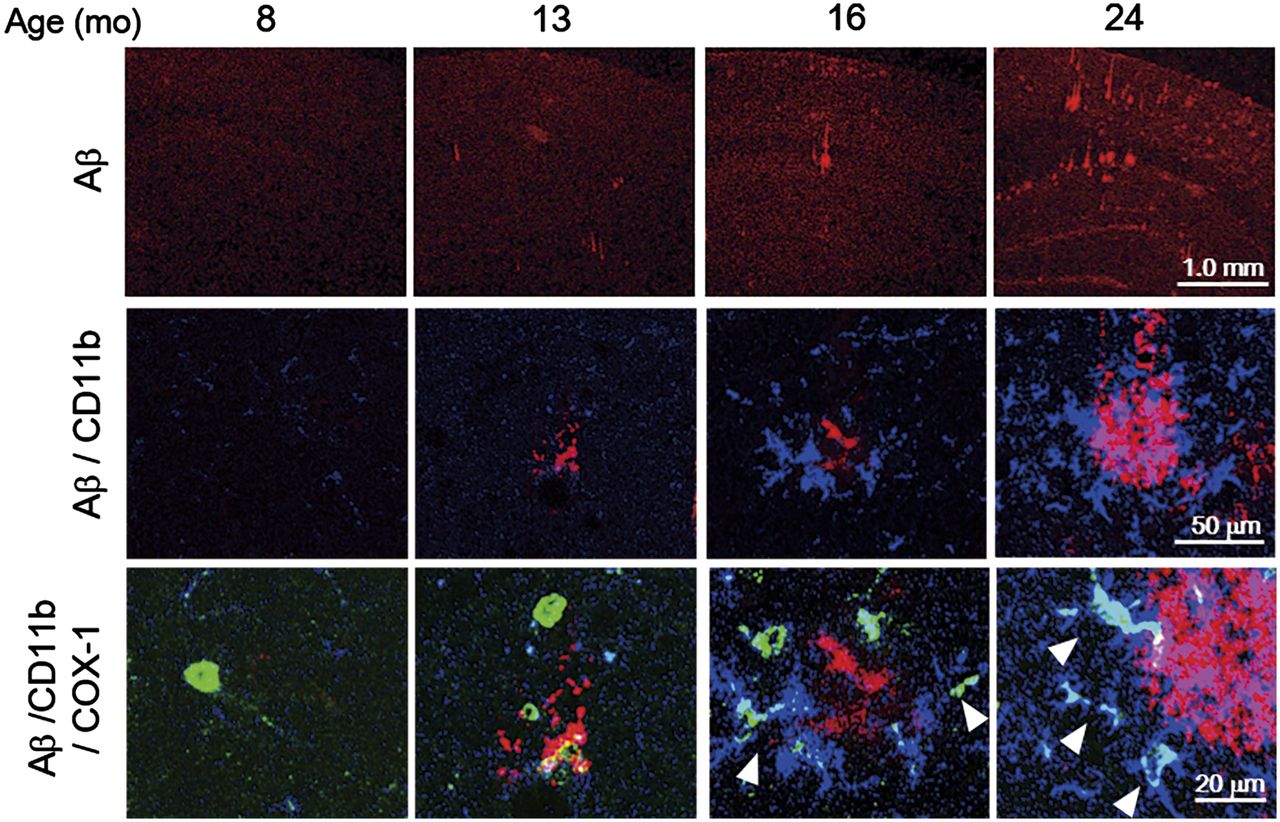
    Age-dependent changes in regional brain uptake of (S)-11C-KTP-Me in APP-Tg 2576 and wild-type mice obtained from quantification of ex vivo autoradiography. Significant increases in (S)-11C-KTP-Me accumulation in APP-Tg mice are shown in all brain regions at 16 and 24 mo old compared with wild-type mice. Data are expressed as percentage injected dose per gram (%ID/g) and are mean ± SD (8 mo, n = 3; 13 and 24 mo, n = 4; 16 mo, n = 5). *P < 0.05, frontal cortex of APP-Tg mice vs. wild-type mice. ††P < 0.01, parietal cortex of APP-Tg mice vs. wild-type mice. ‡‡P < 0.01, hippocampus of APP-Tg mice vs. wild-type mice. §P < 0.05, cerebellum of APP-Tg mice vs. wild-type mice. CERE = cerebellum; F-CTX = frontal cortex; HIP = hippocampus; P-CTX = parietal cortex; STR = striatum.

  • FIGURE 5.
    • Download figure
    • Open in new tab
    • Download powerpoint
    FIGURE 5.

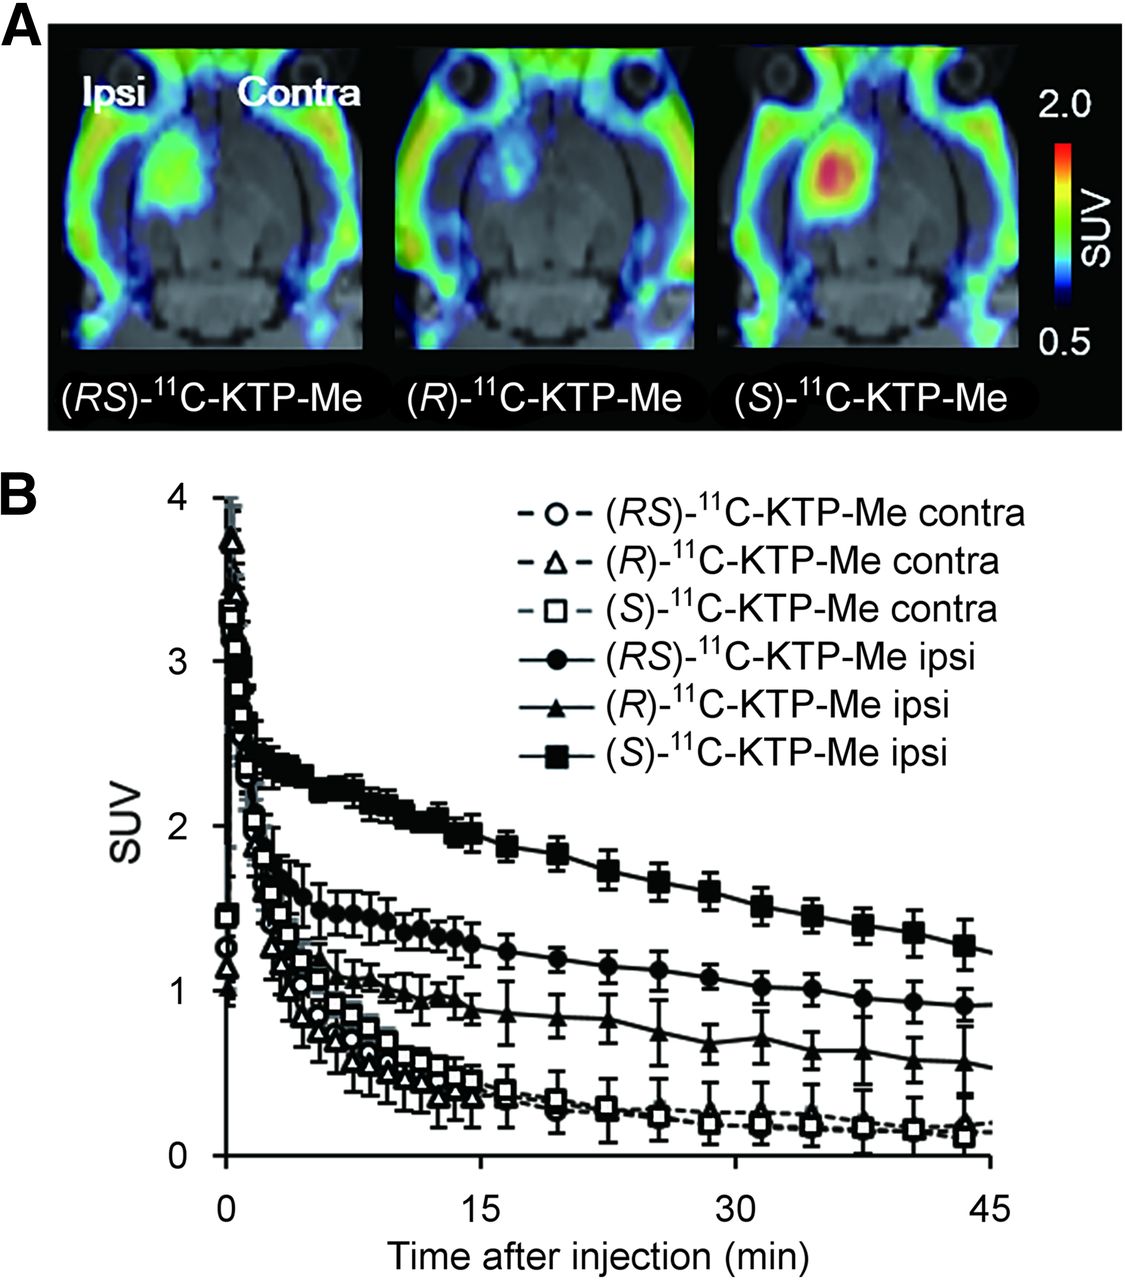
    Age-dependent correlation between COX-1–expressing activated microglia and Aβ plaque formation in APP-Tg 2576 mouse brain. Representative photomicrographs of triple immunofluorescent labeling for Aβ1–16 (red), CD11b (blue), and COX-1 (green) in hippocampus of APP-Tg mice at 8, 13, 16, and 24 mo old. Arrows indicate cells coexpressing CD11b and COX-1. Population and fluorescence intensity of COX-1–expressing CD11b-positive activated microglia showed age-dependent increase from 16 mo old, which was well correlated with formation of Aβ oligomers.

Tables

  • Figures
  • Additional Files
    • View popup
    TABLE 1

    Inhibitory Effects of Ketoprofen Enantiomers on Ovine COX-1 and COX-2 Activities (IC50, μM)

    Substrate(RS)-ketoprofen(R)-ketoprofen(S)-ketoprofen
    COX-10.031126.70.011
    COX-21.04470.70.195
    • View popup
    TABLE 2

    Regional Brain Accumulation of 11C-KTP-Me Enantiomers in Rat Brain After Intrastriatal Injection of Lipopolysaccharide

    Region(RS)-11C-KTP-Me(R)-11C-KTP-Me(S)-11C-KTP-Me
    Ipsilateral striatum1.14 ± 0.1010.79 ± 0.145*1.70 ± 0.092†
    Contralateral striatum0.30 ± 0.0190.20 ± 0.0090.34 ± 0.031
    Cerebellum0.22 ± 0.0500.16 ± 0.0370.21 ± 0.018
    • ↵* P < 0.05 (R)-11C-KTP-Me vs. (RS)-11C-KTP-Me.

    • ↵† P < 0.001 (S)-11C-KTP-Me vs. (RS)-11C-KTP-Me.

    • Absorbed doses of 11C-KTP-Me enantiomers were calculated using summed PET images from 5 to 45 min after tracer injection and are expressed as SUV. Data are expressed as mean ± SD ((R)-11C-KTP-Me, n = 3; others, n = 4).

Additional Files

  • Figures
  • Tables
  • Supplemental Data

    Files in this Data Supplement:

    • Supplemental Data
PreviousNext
Back to top

In this issue

Journal of Nuclear Medicine: 57 (2)
Journal of Nuclear Medicine
Vol. 57, Issue 2
February 1, 2016
  • Table of Contents
  • Table of Contents (PDF)
  • About the Cover
  • Index by author
Print
Download PDF
Article Alerts
Sign In to Email Alerts with your Email Address
Email Article

Thank you for your interest in spreading the word on Journal of Nuclear Medicine.

NOTE: We only request your email address so that the person you are recommending the page to knows that you wanted them to see it, and that it is not junk mail. We do not capture any email address.

Enter multiple addresses on separate lines or separate them with commas.
Detection of Cyclooxygenase-1 in Activated Microglia During Amyloid Plaque Progression: PET Studies in Alzheimer’s Disease Model Mice
(Your Name) has sent you a message from Journal of Nuclear Medicine
(Your Name) thought you would like to see the Journal of Nuclear Medicine web site.
Citation Tools
Detection of Cyclooxygenase-1 in Activated Microglia During Amyloid Plaque Progression: PET Studies in Alzheimer’s Disease Model Mice
Miho Shukuri, Aya Mawatari, Masahiro Ohno, Masaaki Suzuki, Hisashi Doi, Yasuyoshi Watanabe, Hirotaka Onoe
Journal of Nuclear Medicine Feb 2016, 57 (2) 291-296; DOI: 10.2967/jnumed.115.166116

Citation Manager Formats

  • BibTeX
  • Bookends
  • EasyBib
  • EndNote (tagged)
  • EndNote 8 (xml)
  • Medlars
  • Mendeley
  • Papers
  • RefWorks Tagged
  • Ref Manager
  • RIS
  • Zotero
Share
Detection of Cyclooxygenase-1 in Activated Microglia During Amyloid Plaque Progression: PET Studies in Alzheimer’s Disease Model Mice
Miho Shukuri, Aya Mawatari, Masahiro Ohno, Masaaki Suzuki, Hisashi Doi, Yasuyoshi Watanabe, Hirotaka Onoe
Journal of Nuclear Medicine Feb 2016, 57 (2) 291-296; DOI: 10.2967/jnumed.115.166116
Twitter logo Facebook logo LinkedIn logo Mendeley logo
  • Tweet Widget
  • Facebook Like
  • Google Plus One
Bookmark this article

Jump to section

  • Article
    • Abstract
    • MATERIALS AND METHODS
    • RESULTS
    • DISCUSSION
    • CONCLUSION
    • DISCLOSURE
    • Acknowledgments
    • Footnotes
    • REFERENCES
  • Figures & Data
  • Supplemental
  • Info & Metrics
  • PDF

Related Articles

  • This Month in JNM
  • PubMed
  • Google Scholar

Cited By...

  • Synthesis and Preclinical Evaluation of 18F-Labeled Ketoprofen Methyl Esters for Cyclooxygenase-1 Imaging in Neuroinflammation
  • A modest increase in 11C-PK11195-PET TSPO binding in depression is not associated with serum C-reactive protein or body mass index
  • Evaluation of Two Potent and Selective PET Radioligands to Image COX-1 and COX-2 in Rhesus Monkeys
  • Google Scholar

More in this TOC Section

  • Tumor Uptake of Anti-CD20 Fabs Depends on Tumor Perfusion
  • How Sensitive Is the Upper Gastrointestinal Tract to 90Y Radioembolization? A Histologic and Dosimetric Analysis in a Porcine Model
  • 11C-Methionine PET of Myocardial Inflammation in a Rat Model of Experimental Autoimmune Myocarditis
Show more Basic Science Investigations

Similar Articles

Keywords

  • Animal Imaging
  • Molecular imaging
  • PET
  • Alzheimer’s disease
  • cyclooxygenase
  • microglia
  • neuroinflammation
SNMMI

© 2025 SNMMI

Powered by HighWire