


Abstract
Our objective was to assess the feasibility of 18F-FDG PET/CT for noninvasive monitoring of treatment response after allogeneic stem cell transplantation (SCT) for myelofibrosis. Methods: Twelve patients with myelofibrosis underwent 18F-FDG PET/CT before and after SCT. Bone marrow uptake, spleen uptake, and spleen size were assessed before and after SCT and compared with hematologic response criteria and bone marrow biopsies. Results: All patients who did not achieve complete remission remained PET-positive (P = 0.02). Extent of disease, bone marrow metabolism, spleen metabolism, and spleen volume decreased significantly in patients with complete remission (P = 0.03). PET/CT after SCT had a sensitivity of 1.0 (95% confidence interval [CI], 0.54–1.0), a specificity of 0.83 (95% CI, 0.36–1.0), a negative predictive value of 1.0 (95% CI, 0.48–1.0), and a positive predictive value of 0.86 (95% CI, 0.42–1.0) for diagnosis of residual disease. Conclusion: 18F-FDG PET/CT is feasible for noninvasive monitoring of treatment response after allogeneic SCT for myelofibrosis.
Myelofibrosis is a BCR-ABL1–negative hematopoietic stem cell disorder characterized by marked bone marrow inflammation, reactive marrow fibrosis replacing normal hematopoiesis, and consecutive extramedullary hematopoiesis (1,2). The only potentially curative treatment approach is allogeneic hematopoietic stem cell transplantation (SCT), leading to 5-y survival rates of 51%–61% (3). A noninvasive imaging-derived surrogate parameter for bone marrow involvement would be desirable not only for initial evaluation of disease extent but also for monitoring and adjustment of therapy.
A recent study has demonstrated the feasibility of 18F-FDG PET/CT for noninvasive visualization and quantitation of the extent and activity of bone marrow involvement in a cohort of patients before SCT (4). In that study, the metabolic activity of the bone marrow as determined by 18F-FDG PET was significantly associated with the histopathologic grade of fibrosis, and the extent of disease on PET decreased with time after diagnosis. These results suggest that PET may also be suitable for therapy monitoring. Typically, invasive histopathology shows rapid regression of fibrosis after SCT (5). A recent report indicated that the bone marrow signal on 18F-FDG PET normalizes after SCT (6).
Therefore, the aim of this study was to assess the feasibility of 18F-FDG PET/CT for monitoring therapy response in myelofibrosis patients undergoing SCT.
MATERIALS AND METHODS
Study Population
We retrospectively analyzed data from 12 patients (10 men and 2 women; median age, 62.9 y; 95% confidence interval [CI], 60.8–67.4 y) with primary (n = 9) or secondary (n = 3) myelofibrosis. This was a feasibility study. Therefore, no power analysis or sample size justification was provided. The purpose of this pilot study was to generate the hypotheses for verification in future studies. The patients underwent an 18F-FDG PET/CT scan between October 2010 and October 2014 to assess the bone marrow compartment before (PET1) and after (PET2) SCT. All fulfilled the criteria of the World Health Organization diagnostic for myelofibrosis or the criteria of the International Working Group for Myelofibrosis Research and Treatment for secondary myelofibrosis (7,8). The study was approved by the Clinical Institutional Review Board of University Medical Center Hamburg-Eppendorf (WF-008/13). Written informed consent was obtained from all subjects.
Reference Standard
A panel of clinical and hematologic parameters was evaluated in all patients. The interval between PET/CT and assessment of hematologic parameters was less than 2 wk. Bone marrow biopsies were obtained from the posterior iliac crests, and fibrosis was graded on a 4-point scale (9).
The remission status was determined using the Revised Response Criteria for Myelofibrosis (10). Patients were followed for 1,324 d (95% CI, 642–1,681 d) after SCT.
PET/CT Acquisition and Image Reconstruction
18F-FDG PET/CT imaging was performed on a Gemini GXL10 scanner (Philips) using a standard whole-body protocol as described before (4).
Image Analysis, Quantification of Metabolic Activity, and PET Response Assessment
Two interpreters masked to all clinical information analyzed all images in consensus.
Osseous 18F-FDG Uptake and PET Response Assessment
The pattern of 18F-FDG accumulation was analyzed on maximum-intensity-projection images for each patient (Fig. 1), and the extent of 18F-FDG accumulation was graded on a 5-point scale to assess changes in the extent of bone marrow involvement (4). Grade 4 indicated increased uptake in the central skeleton and the extremities extending into the small bones of the feet; grade 3, markedly increased uptake in the central skeleton and the extremities, extending into the tibial bone; grade 2, markedly increased uptake in the central skeleton and the proximal extremities, extending into the distal half of the femoral bone; and grade 1, mildly increased uptake in the central skeleton and the proximal extremities. Absence of uptake in the peripheral skeleton was consistent with grade 0.
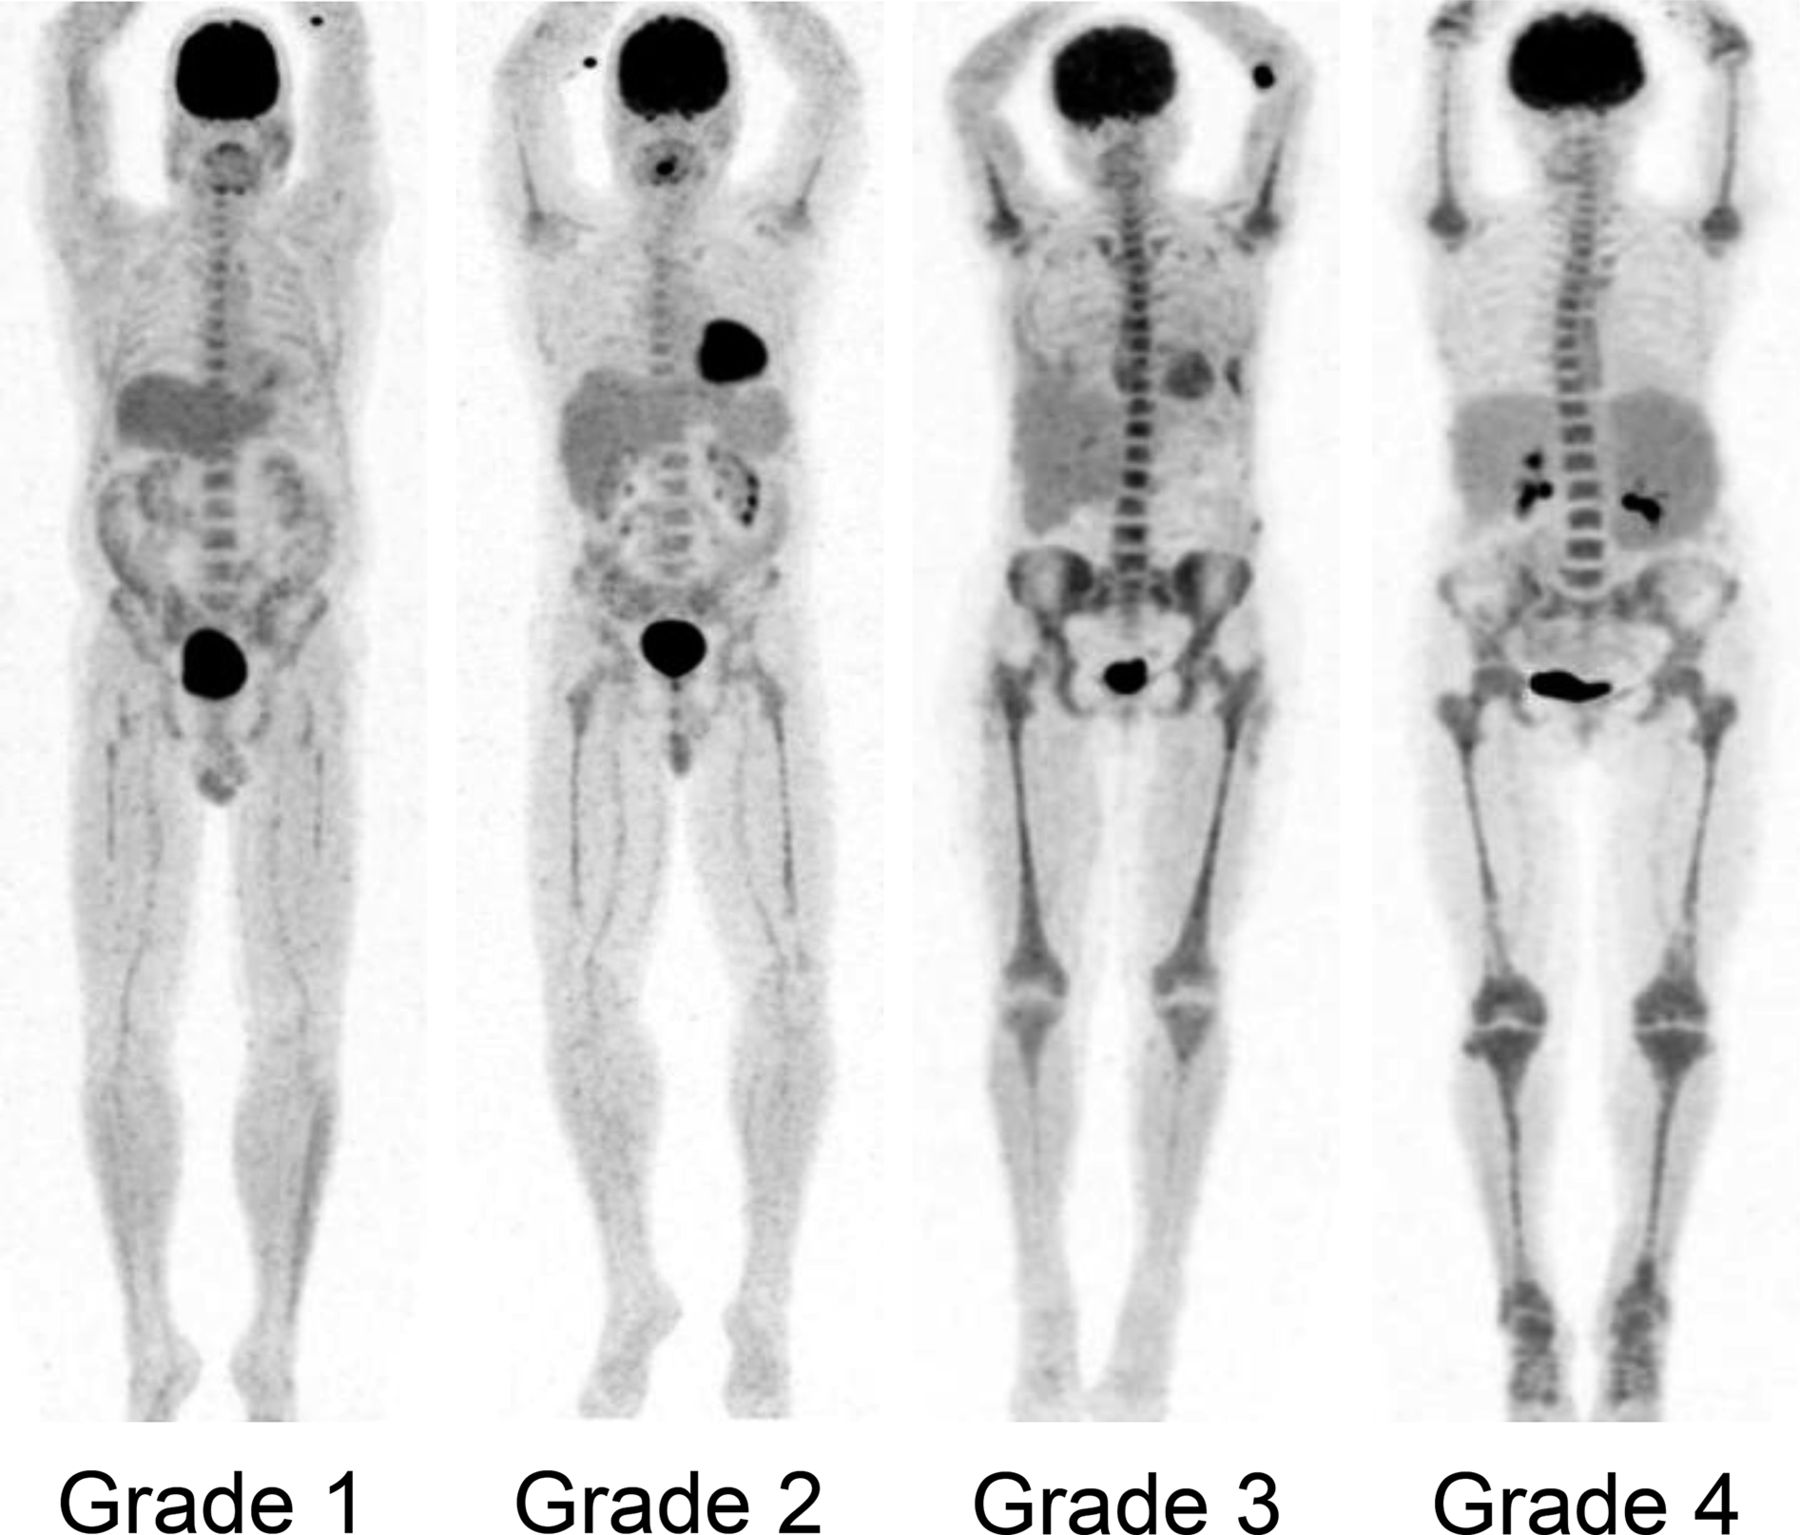
Grading of extent of bone marrow uptake on maximum-intensity-projection PET images.
Bone marrow SUVmax was measured using an oval region of interest at least 15 mm in diameter placed on coregistered PET/CT images within L1 to L4 as described before (4). The final bone marrow SUVmax results were produced by averaging the measurements for all 4 vertebrae. Lumbar bone marrow SUVmax has previously been shown to be inversely correlated with the histopathologic grade of bone marrow fibrosis (4).
Spleen 18F-FDG Uptake and Spleen Volume
The SUVmean of the spleen was determined by averaging the results of region-of-interest measurements on 3 nonadjacent slices. The area of the spleen on each slice was multiplied by the slice thickness to obtain the spleen volume on breath-hold CT.
Diagnosis of metabolic complete response (CR) required complete resolution of bone marrow uptake in peripheral bones, stable or decreased uptake in lumbar vertebrae, stable or decreased spleen uptake, and decreased (not necessarily normalized) spleen volume. In particular, residual grade 1 bone marrow uptake, increasing bone marrow SUVmax, or an increase in spleen metabolism or volume was considered absence of metabolic CR.
Statistical Analysis
Continuous variables are expressed as median with 95% CI. Categoric variables are presented with absolute and relative frequencies. Continuous data were compared using the Wilcoxon matched-pairs signed-rank test. For categoric variables, P values were computed from contingency tables using the Fisher exact test. The Spearman correlation coefficient, rs, was used to correlate imaging findings with grade of bone marrow fibrosis. The Mann–Whitney test was used to compare baseline PET data between patients reaching CR and those who did not. Survival probabilities were estimated using the Kaplan–Meier method, and strata were compared using the Gehan–Breslow–Wilcoxon method. Follow-up time was calculated as the time from SCT until death or last follow-up date. Statistical significance was established for P values of less than 0.05. Statistical analysis was performed using Prism (version 6.0; GraphPad) for Windows (Microsoft).
RESULTS
Patient characteristics are reported in Table 1 (more detailed data are available in the supplemental materials available at http://jnm.snmjournals.org). All patients underwent 18F-FDG PET/CT within 9 d (95% CI, 6–12 d) before allogeneic SCT (PET1) and at 223 d (95% CI, 100–442 d) after SCT (PET2). At the time of PET2, 6 patients (50%) had achieved CR (2 of them fulfilled the criteria for molecular remission), 4 patients (33%) had achieved partial remission, 1 patient (8%) had progressive disease, and 1 patient (8%) had relapse.
Patient Characteristics (n = 12)
All 12 patients demonstrated increased bone marrow uptake on PET1. At PET2, 5 of 6 patients (83%) with CR became PET-negative (PET metabolic CR). One patient (17%) fulfilled the criteria for CR but had residual histologic grade 1 marrow fibrosis and remained PET-positive, but the extent of bone marrow involvement on PET decreased from grade 3 to grade 1. All patients who did not achieve CR remained PET-positive (P = 0.02). In the patients who achieved CR, extent of disease (P = 0.03), bone marrow SUVmax (P = 0.03), spleen metabolism (P = 0.03), and spleen volume (P = 0.03) decreased significantly from PET1 to PET2. Regression of bone marrow fibrosis on biopsies correlated significantly with regression of bone marrow SUVmax (rs = −0.77, P < 0.003). Data on extent of disease, bone marrow SUVmax, spleen metabolism, and spleen volume before and after SCT are shown in Table 2.
Disease Extent, Bone Marrow Metabolism, Spleen Metabolism, and Spleen Volume on 18F-FDG PET/CT Before and After SCT (n = 12)
PET2 had a sensitivity of 1.0 (95% CI, 0.54–1.0), a specificity of 0.83 (95% CI, 0.36–1.0), a negative predictive value of 1.0 (95% CI, 0.48–1.0), and a positive predictive value of 0.86 (95% CI, 0.42–1.0) for diagnosis of residual disease. Imaging examples of patients before and after SCT are shown in Figures 2 and 3.

18F-FDG PET/CT scans before (A) and after (D) SCT, showing metabolic CR. Initial biopsy showed proliferation of enlarged megakaryocytes and enhanced granulopoiesis (B, Giemsa staining), accompanied by bone marrow fibrosis (C, Gomori staining). After SCT, cellularity was normalized, atypical megakaryocytes had vanished (E), and no fibrosis was present (F).
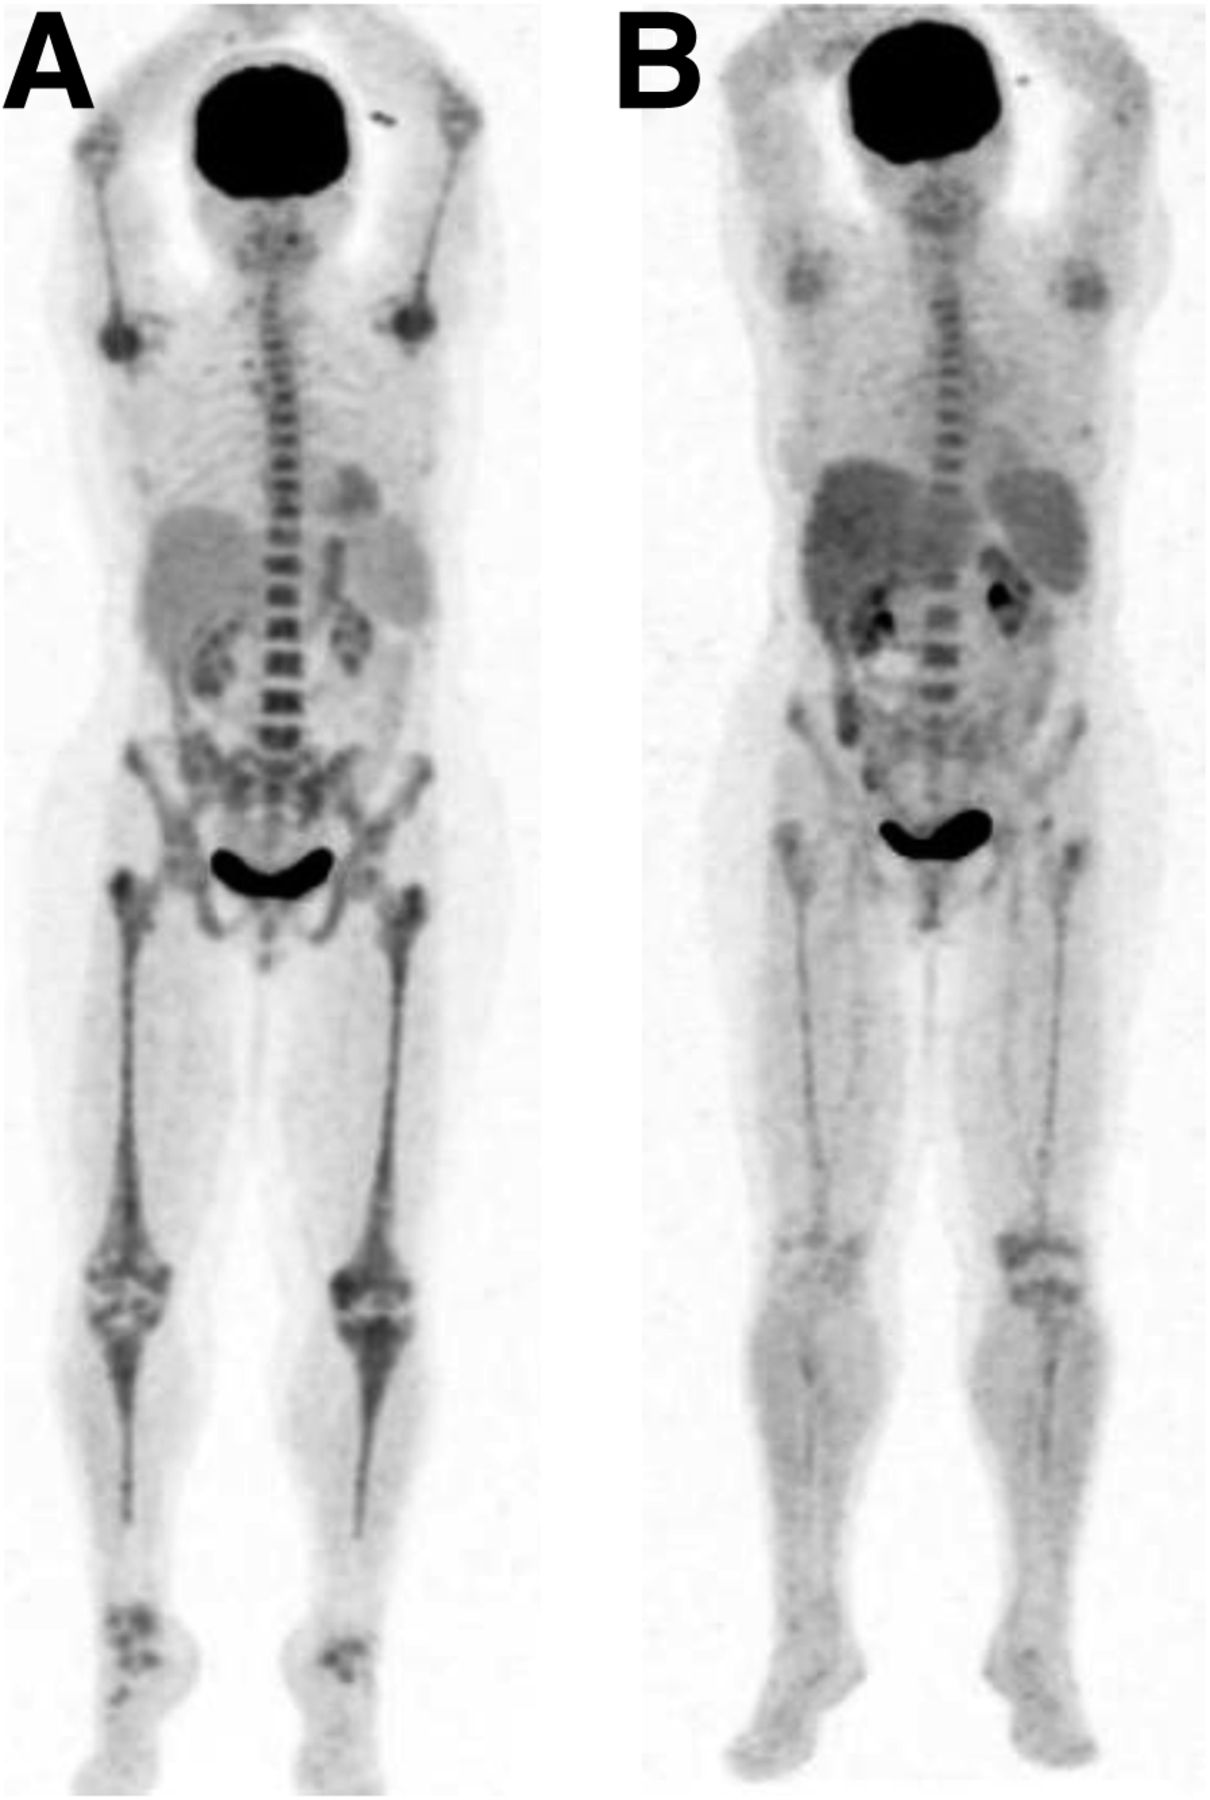
18F-FDG PET/CT before (A) and after (B) SCT. Partial remission is seen, with persistent uptake on PET.
On PET1, there was no significant difference in extent of disease (P = 0.24), bone marrow SUVmax (P = 0.19), spleen volume (P = 0.18), or spleen metabolism (SUVmean, P = 0.75) between patients who achieved CR and those who did not.
In patients with metabolic CR on PET2, there was a trend toward increased overall survival, with a hazard ratio of 0.11 (95% CI, 0.01–1.05; P = 0.06 [Gehan–Breslow–Wilcoxon test]), but this trend did not reach statistical significance (Fig. 4).

Kaplan–Meier plot of overall survival. Trend toward increased overall survival in patients with metabolic CR (mCR) on PET2 did not reach statistical significance (P = 0.06).
DISCUSSION
In the present study, we demonstrated the feasibility of 18F-FDG PET/CT for monitoring treatment response after SCT for myelofibrosis. Most patients (83%) who achieved CR after SCT demonstrated a complete metabolic remission on PET2, indicating that the bone marrow signal in myelofibrosis is influenced by therapeutic interventions. PET was false-positive in one patient with CR, but that patient had residual histologic grade 1 marrow fibrosis, which was allowed in the definition of CR. In other cases, persistent bone marrow uptake may also be caused by bone marrow activation induced by infection or drugs such as granulocyte–colony-stimulating factor.
PET correctly identified all patients who did not achieve CR after SCT (P = 0.02), yielding a high sensitivity of 100%, indicating that a positive PET scan after SCT may indicate residual disease. The performance of PET/CT in myelofibrosis was comparable to that for other hematologic diseases. A recent study demonstrated a high negative predictive value of 95% for assessment of progression or early relapse after first-line chemotherapy in advanced-stage Hodgkin lymphoma (11). In view of these data, it is tempting to speculate that PET may be able to replace or complement invasive hematologic reevaluation in selected myelofibrosis patients. In other hematologic malignancies such as multiple myeloma, persistently increased bone marrow uptake has been shown to be able to identify residual or recurrent disease (12). Interestingly, in contrast to the patients with CR, those patients who achieved only a partial remission did not have statistically significant quantitative changes in spleen metabolism, bone marrow metabolism, or spleen volume.
Bone marrow biopsies are associated with pain and bleeding, particularly in cytopenic patients. Sampling error is a frequent problem in bone marrow biopsy, particularly because fibrosis is an inhomogeneous process with variable distribution (5). PET can estimate bone marrow involvement and its distribution on whole-body images (4). Since bone marrow SUVmax has been shown to correlate with the histologic grade of fibrosis (4), PET may be used to guide bone marrow biopsies to identify the region with the most prominent fibrotic activity. Given that repeated biopsies are mandatory for reevaluation of the grade of fibrosis after therapy, PET may represent a noninvasive alternative to repeated invasive biopsies. However, the 18F-FDG accumulation in bone marrow is influenced by both inflammatory activity and myelopoiesis. Other PET tracers such as the proliferation marker 18F-fluorodeoxythymidine may help us to better understand the different aspects of bone marrow disease.
The major limitation of this retrospective study was the small number of patients. Therefore, the statistical power to assess the precise predictive value of PET was limited. In addition, a more standardized protocol (e.g., PET2 at 100 d after SCT) might have shown clearer associations. Recent studies have indicated that MRI allows monitoring of the response or progression of marrow disease (5). Further studies are needed to compare the relative performance of PET/CT and MRI for assessment of treatment response.
CONCLUSION
This retrospective study demonstrated that 18F-FDG PET/CT is feasible for noninvasive monitoring of myelofibrosis treatment response after allogeneic SCT. Response-adapted therapy guided by PET for myelofibrosis patients may be a promising approach that should be further evaluated in prospective clinical trials.
DISCLOSURE
The costs of publication of this article were defrayed in part by the payment of page charges. Therefore, and solely to indicate this fact, this article is hereby marked “advertisement” in accordance with 18 USC section 1734. No potential conflict of interest relevant to this article was reported.
Footnotes
Published online May 26, 2016.
- © 2016 by the Society of Nuclear Medicine and Molecular Imaging, Inc.
REFERENCES
- Received for publication August 31, 2015.
- Accepted for publication April 19, 2016.


Jump to section
Related Articles
Cited By...
- No citing articles found.