


Abstract
Rotenone derivatives have shown promise in myocardial perfusion imaging (MPI). CMICE-013 is a novel 123I-labeled rotenone derivative developed for SPECT MPI. The objective of this study was to assess the image quality of CMICE-013 and compare its uptake with tetrofosmin, sestamibi, and 201Tl in vivo in a porcine model of stress-induced myocardial ischemia. Methods: Microspheres were injected simultaneously with the radiotracer injections at rest and stress to measure blood flow. Mimicking a 1-d tetrofosmin protocol, stress imaging used 3 times as much activity and occurred 1 h after the rest injection. SPECT images were obtained at both rest and stress. After imaging, the heart was sectioned into 44–50 pieces. In each heart sample, the tracer uptake was measured in a γ counter. The images were aligned, and the decay-corrected ratio of the signals at rest and stress was used to separate the well-counter signal into rest and stress components. The uptake at rest and stress was compared with microsphere flow measurements. Results: The CMICE-013 images showed good contrast between the heart and surrounding organs, with heart-to-liver and heart-to-lung uptake ratios similar to those of the standard tracers. Uptake of CMICE-013 was 1.5% of the injected dose at rest and increased more rapidly with increased blood flow than did the standard SPECT tracers. The percentage injected dose of CMICE-013 taken up by the heart was greater (P < 0.05) than 201Tl, tetrofosmin, or sestamibi at flows greater than 1.5 mL/min/g. Conclusion: CMICE-013 is a promising new SPECT MPI agent.
Repeated unexpected shutdowns of several of the major nuclear reactors producing 99Mo has led to ongoing concern over the stability of the supply of 99mTc and, consequently, interest in developing alternative tracers. Myocardial perfusion imaging (MPI) remains one of the more common tests performed with 99mTc-labeled agents. For MPI, PET is a potential option using either 82Rb or 13N ammonia, because the parent isotope for 82Rb generators (82Sr) and ammonia are both cyclotron-produced. Interest in PET MPI is growing; however, the number of MPI SPECT scans obtained annually in North America is still orders of magnitude larger and likely to remain so for many years. Thus, a SPECT alternative to 99mTc MPI tracers remains an important goal.
Clinical trials of the 18F-labeled PET tracer flurpiridaz (1,2) have shown excellent contrast between the heart and surrounding organs and performance superior to standard 99mTc-based tracers for the identification of disease. This tracer inhibits mitochondrial complex I and derives its specificity for cardiac imaging from the high concentration of mitochondria in the heart. Other compounds that target mitochondrial complex I have been studied previously in SPECT. An iodinated rotenone compound (I-ZIROT) was shown to have excellent uptake in the heart and excellent extraction at higher blood flows (3,4), which is in contrast to the standard SPECT 99mTc tracers that have a roll-off in their extraction, producing a plateau in tracer uptake, at flow rates of 1.5–2 times normal resting flow (5,6). The roll-off in extraction fraction limits the contrast between normal and abnormal tissues and can degrade the accuracy of MPI. 201Tl also has good extraction at high flow rates. However, the long half-life of 201Tl results in high patient radiodosimetry, which limits the activity that can be injected and leads to noisy, poor-quality images, compared with 99mTc tracers. An 123I-labeled rotenone derivative may provide the benefits of a good extraction fraction with improved imaging characteristics and dosimetry. 123I emits 159-keV γ rays, similar to the 140-keV photon emission of 99mTc, and thus would be well suited to imaging with current γ cameras. These factors led us to develop a new SPECT MPI tracer based on an 123I-labeled rotenone derivative: CMICE-013.
The chemical structure and characterization of CMICE-013 have been published previously (7). CMICE-013 has a good toxicity profile (8), and initial biodistribution studies in rats demonstrated excellent uptake in the heart and contrast with surrounding organs. The effective dose of a 185-MBq injection was estimated from preclinical studies to be 1.3–3.9 mSv (9,10). This study’s objectives were to assess the image quality of CMICE-013 and compare its uptake with tetrofosmin, sestamibi, and 201Tl in vivo in a porcine model of myocardial ischemia.
MATERIALS AND METHODS
Tracer Formulation
The formulation and chemical nature of CMICE-013 have been described previously (7). Whereas I-ZIROT replaced the 7′-carbon hydrogen of rotenone with iodine, 123I-CMICE-013 adds an iodine to the 7′-carbon and reduces the 6′,7′-double bond to a single bond with the addition of a hydroxy group at the 6′ position. Briefly, 463 MBq (12.5 mCi) of 123I-NaI solution in 0.1 M NaOH was mixed with 170 μL of rotenone solution (2.5 mg/mL in trifluoroacetic acid) and 30 μL of IODO-GEN solution (0.75 mg/mL in trifluoroacetic acid; Pierce). The mixture was heated at 60°C for 45 min. After being cooled to room temperature, the mixture was purified by reversed-phase high-performance liquid chromatography with ethanol/water (48/52% v/v) as the mobile phase. After the ethanol was evaporated, the purified product was reconstructed in 5% ethanol in 10 mM NaOAc, pH 6.5, as the final product for animal injection. The radiochemical purity of the final product was 95% or greater, as indicated by high-performance liquid chromatography.
Tetrofosmin, sestamibi, and 201Tl were acquired as unit doses from a commercial radiopharmacy (Cardinal Health Canada Nuclear Medicine Service).
Pig Model Preparation
We used a pig model of normal flow at rest and transient occlusion of the left anterior descending artery (LAD) at stress to mimic stress-induced ischemia, similar to the approach used by Nekolla et al. (11). This protocol was done in accordance with the guidelines of the Canadian Council on Animal Care and with approval from the Animal Care Committee at the University of Ottawa. Twenty-two 30- to 40-kg farm-bred Yorkshire cross female pigs successfully completed the protocol, 7 with CMICE-013, 5 with 99mTc-tetrofosmin, 4 with 99mTc-sestamibi, and 6 with 201Tl. An additional group of 10 animals completed the protocol using a normal model (no occlusion) of rest–stress: 3 with CMICE-013, 4 with tetrofosmin, 1 with sestamibi, and 2 with 201Tl. Animals were anesthetized with Telazol (Zoetis) and maintained using 2%–3% isoflurane. For the ischemia model, a thoracotomy was performed and a suture loop placed around the LAD just below the second diagonal branch. Before closing the thoracotomy, suture lines were brought out of the chest, allowing occlusion and release during imaging. Catheters were placed in the left atrium for microsphere injection, in the ear for tracer injection, in the opposite ear for fluids and dipyridamole, and in the femoral artery for blood withdrawal during microsphere measurements. For the normal model, the procedure was the same except that the suture loop was not placed around the LAD. The heart rate, blood pressure, and body temperature of the animals were monitored throughout the experiment.
Imaging
After surgery, the animals were maintained under anesthetic and brought to the nuclear medicine imaging suite. The imaging protocol was similar to that of a 1-d rest–stress 99mTc-tetrofosmin protocol, with a 1-h delay between rest and stress injections and approximately 3 times as much activity injected at stress as at rest. For CMICE-013, 74 MBq (2 mCi) were injected at rest and 222 MBq (6 mCi) at stress. The pigs were placed supine in a solid-state dedicated cardiac SPECT camera (Discovery NM 530c; GE Healthcare). Radiotracer and microsphere injections were started simultaneously. We used 2 different neutron-activated microspheres (BioPal Inc.), gold at rest and samarium at stress. For each, blood was withdrawn for 4 min at 4 mL/min. Image data were acquired for 15 min starting just before tracer injection. A second 15-min image was acquired immediately after and a third image acquired starting at 45 min after injection at rest. At 1 h after the rest injection, an infusion of dipyridamole (0.142 ug/kg/min over 4 min) was started. Phenylephrine was given as needed to maintain blood pressure. For the ischemia model, 4 min after the end of the dipyridamole infusion, the suture was tightened and the LAD was occluded. Thirty seconds after occlusion, the stress tracer was injected concurrent with a second injection of microspheres. Two minutes after tracer injection, the occlusion was released. Two consecutive 15-min stress images were acquired starting immediately after tracer injection. Only a brief period of ischemia was used to minimize infarction of the myocardium. For tetrofosmin and sestamibi imaging, the preparation and imaging procedure was the same except that 370 MBq (10 mCi) of tracer were injected at rest and 1,100 MBq (30 mCi) at stress. For 201Tl, 37 MBq (1 mCi) and 111 MBq (3 mCi) were injected at rest and stress, respectively. To minimize the effects of tracer redistribution, only 1 stress image was acquired for the 201Tl protocol and the animal was euthanized immediately after the stress image. For the normal animals, the imaging procedure was the same except for no occlusion of the LAD at stress.
The animal was euthanized with an injection of sodium pentabarbitol immediately after completion of imaging. The heart was then extracted and rinsed. The left ventricle was isolated and sliced into 5 transverse slices of similar thickness. Each slice was divided into 1- to 2-g transmural segments resulting in 44–50 samples per heart. Samples were weighed and then measured in a NaI automated well-counter (Wizard3 2480; Perkin Elmer).
Image Processing
Images were reconstructed using a vendor-supplied iterative algorithm that includes collimator modeling and a noise-suppression prior. Similar to the recommended clinical protocol for 99mTc tracers, we used 40 iterations and a postreconstruction 3-dimensional Butterworth filter (order, 10; cutoff, 0.37 cycles/cm) for all tracers. No attenuation or scatter correction was applied.
To assess CMICE-013 blood-pool clearance, images from 4 pigs were created every 30 s for the first 15 min after tracer injection at rest and stress. To evaluate image quality, the scans were divided into 5-min intervals, and the ratio of the maximum counts in the heart was compared with that of the liver and a lung volume of interest. Ratios were averaged over all animals for each tracer. Additional analysis is described in the supplemental materials (available online at http://jnm.snmjournals.org).
The last rest image, acquired immediately before the stress infusion, and the last stress image were imported into Matlab-based software (The Mathworks, Inc.), and the hearts in each image were coregistered manually using rigid-body translation. The heart image was segmented in 3 dimensions to match the sectioning of the extracted heart into tissue samples. Polar map representations of the sampled heart for the well-counter measurements and the stress image were then compared to confirm the alignment of the tissue samples with the images. For each sample, the fraction of counts associated with the rest injection was determined. First, the resting image was decay-corrected to the time of the stress image acquisition. The summed counts in each sample from the rest image were then divided by the counts in the corresponding stress image sample to calculate the rest fraction. The decay correction of the rest image included correction for both radioactive decay of the isotope and biologic clearance of the tracer. The biologic clearance of sestamibi was 355 min (12). The clearances of the other tracers were found using the 3 acquired rest images from 5 animals for each tracer. The list-mode data from these acquisitions were rebinned into 5-min intervals and independently reconstructed. The first image after injection was not used because of the presence of blood-pool activity. For each pig, the heart image was manually segmented, and the total counts in the heart was determined and then normalized to the counts in the first image. The data for all 5 pigs were pooled. Assuming a monoexponential biologic clearance, the log of the heart counts was corrected for physical decay and fit to a straight line as a function of time to find the biologic half-life.
The rest and stress fractions, for which the stress fraction equaled 1 minus the rest fraction, were applied to the well-counter measurements to separate these into rest and stress components. The rest and stress well-counter measurements were then converted into a percentage injected activity per gram (%ID/g) of heart tissue.
Microsphere Blood Flow Comparison
The microspheres in each tissue sample and blood reference samples were measured by BioPAL Inc. The signal in each sample was then converted into a measurement of blood flow using standard methods (13): Eq. 1Similar to the work by Glover et al. (5,6), the tissue uptake was fit to the microsphere measurements of blood flow using Equation 2, which represents a scaled Renkin–Crone model of the extraction fraction.
 Eq. 2where PID is the %ID/g of tissue sample, MBF is the myocardial blood flow measured by microspheres, and ai are the fitted parameters.
Fits were calculated for each individual animal using nonlinear least-squares optimization applied to the combined rest and stress values and also for the aggregate data from all animals injected with the same tracer. Quality of the fits was indicated by the coefficients of determination (r2). The uptake in the heart at a selection of flow rates was estimated from the fits to the aggregate data and compared with standard tracers with a t test using uncertainties estimated from the SD of the individual animal fits. Summary data are presented as mean ± SD, and a P value of 0.05 or less was considered significant.
RESULTS
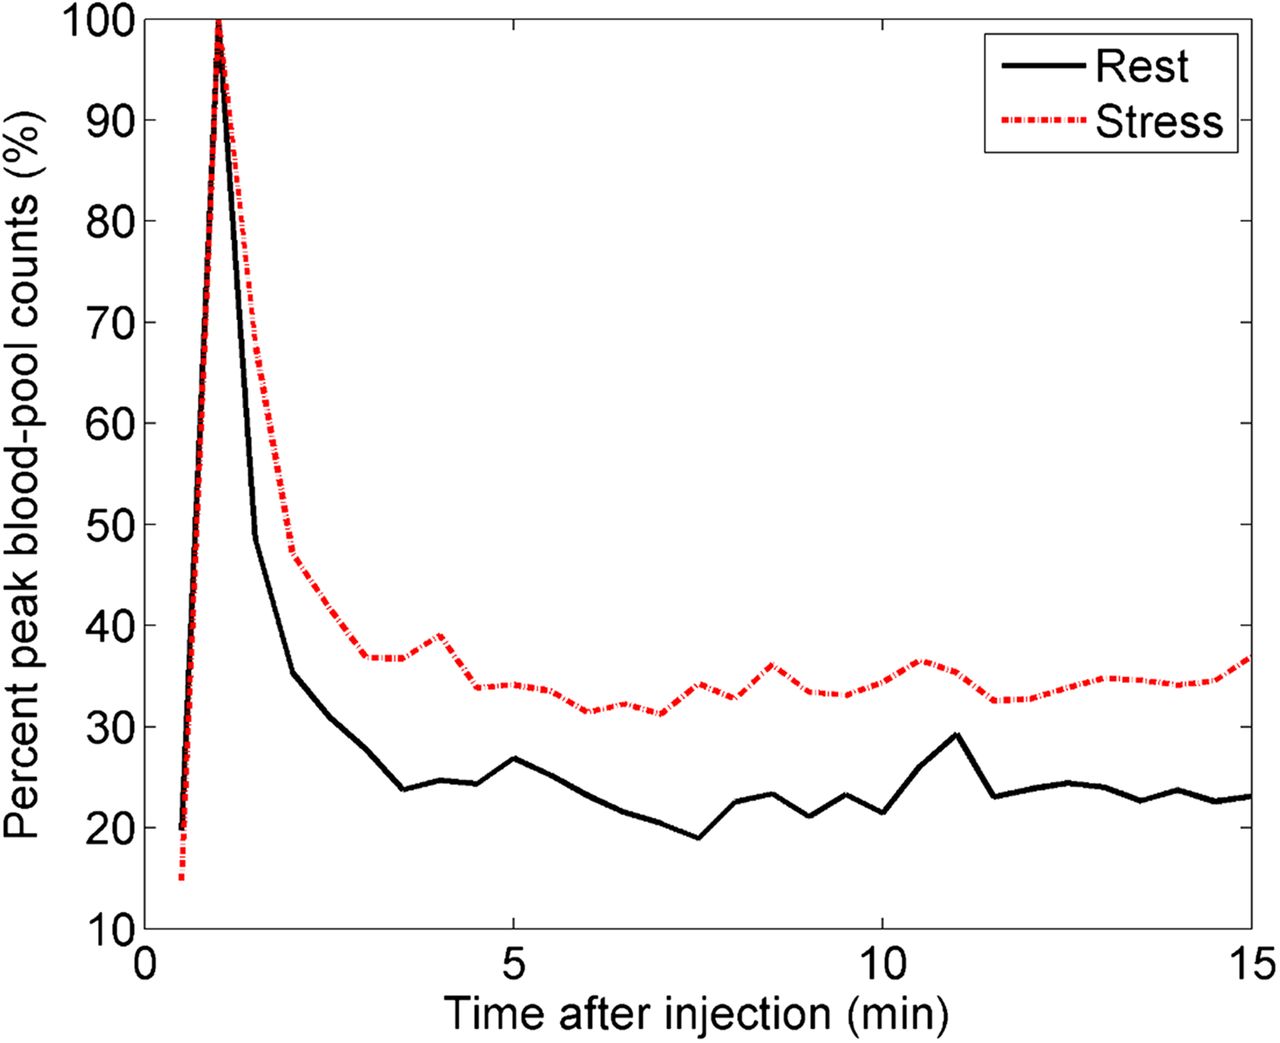
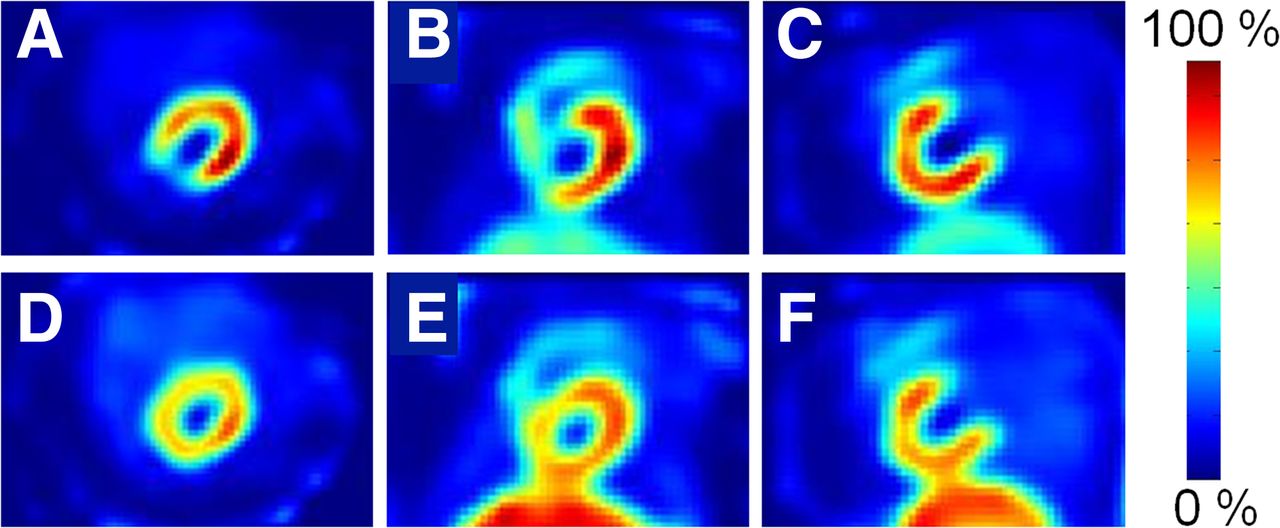
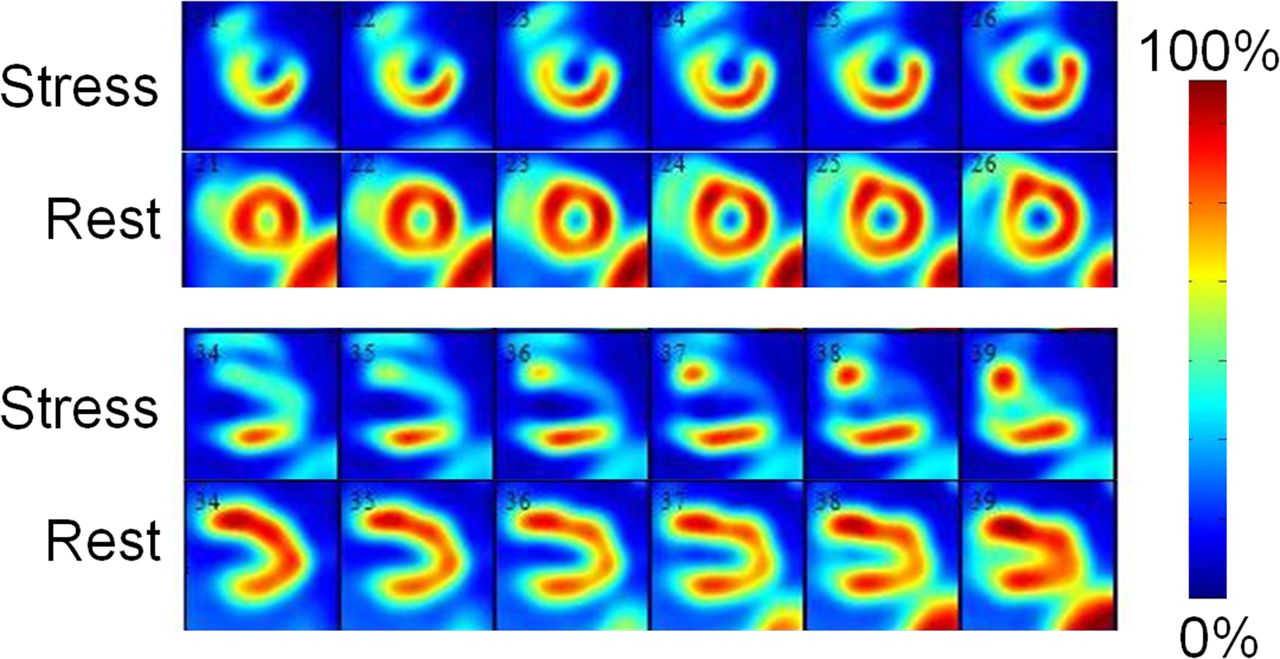
Heart rate and systolic blood pressure in the animals were similar for all tracers (Table 1). The biologic half-lives of the tracers in the heart were 217 min for 201Tl, 330 min for tetrofosmin, and 1,005 min for CMICE-013. The coefficients of determination for 201Tl, tetrofosmin, and CMICE-013 were 0.69, 0.54, and 0.37, respectively. The blood time–activity curves of CMICE-013 at rest and stress (Fig. 1) showed good clearance of the tracer within 5 min after injection. Representative transverse, sagittal, and coronal images of the CMICE-013 tracer distribution (Fig. 2) showed the good contrast between the uptake in the heart and that in the surrounding tissues. Averaged CMICE-013 time–activity curves of the heart-to-liver and heart-to-lung ratios (Fig. 3) were similar to the standard SPECT tracers. Cardiac (short-axis and vertical long-axis, and polar map) views (Fig. 4) of the tracer distribution demonstrated good uniformity at rest and a clear definition of the occluded region during stress. Serial imaging showed that CMICE-013 did not redistribute rapidly (Supplemental Fig. 5, Supplemental Table 1). Finally, compared with microsphere-measured myocardial blood flow, we saw that the CMICE-013 tracer had a greater %ID/g uptake at rest, increased linearly with stress, and increased at a more rapid rate than did the standard SPECT perfusion tracers (Fig. 5), producing a significantly increased myocardial uptake (Table 2).
Heart Rate and Systolic Blood Pressure for Animals at Rest and Stress

Blood time–activity curve for CMICE-013 based on counts from volume of interest in left ventricle. Time–activity curves do not go to zero at late times because of limited spatial resolution of SPECT and consequent spill-in from tracer in myocardial wall.

Representative CMICE-013 images of porcine model of stress-induced myocardial ischemia showing stress (top) and rest (bottom) from 15–30 min after injection. Images are central slices in transverse (A and D), coronal (B and E), and sagittal (C and F) views. Images show good contrast between heart and surrounding tissues, except for liver for which contrast is similar to that of standard SPECT tracers.

Ratios of maximum uptake in heart, compared with liver and lung at rest (A) and stress (B) for each of the tracers studied.

Representative CMICE-013 images of heart. Images are shown at rest and stress (both 15 min after injection) for short axis (top) and vertical long axis (bottom). Images show good uniformity at rest and clear definition of the occluded region during stress.

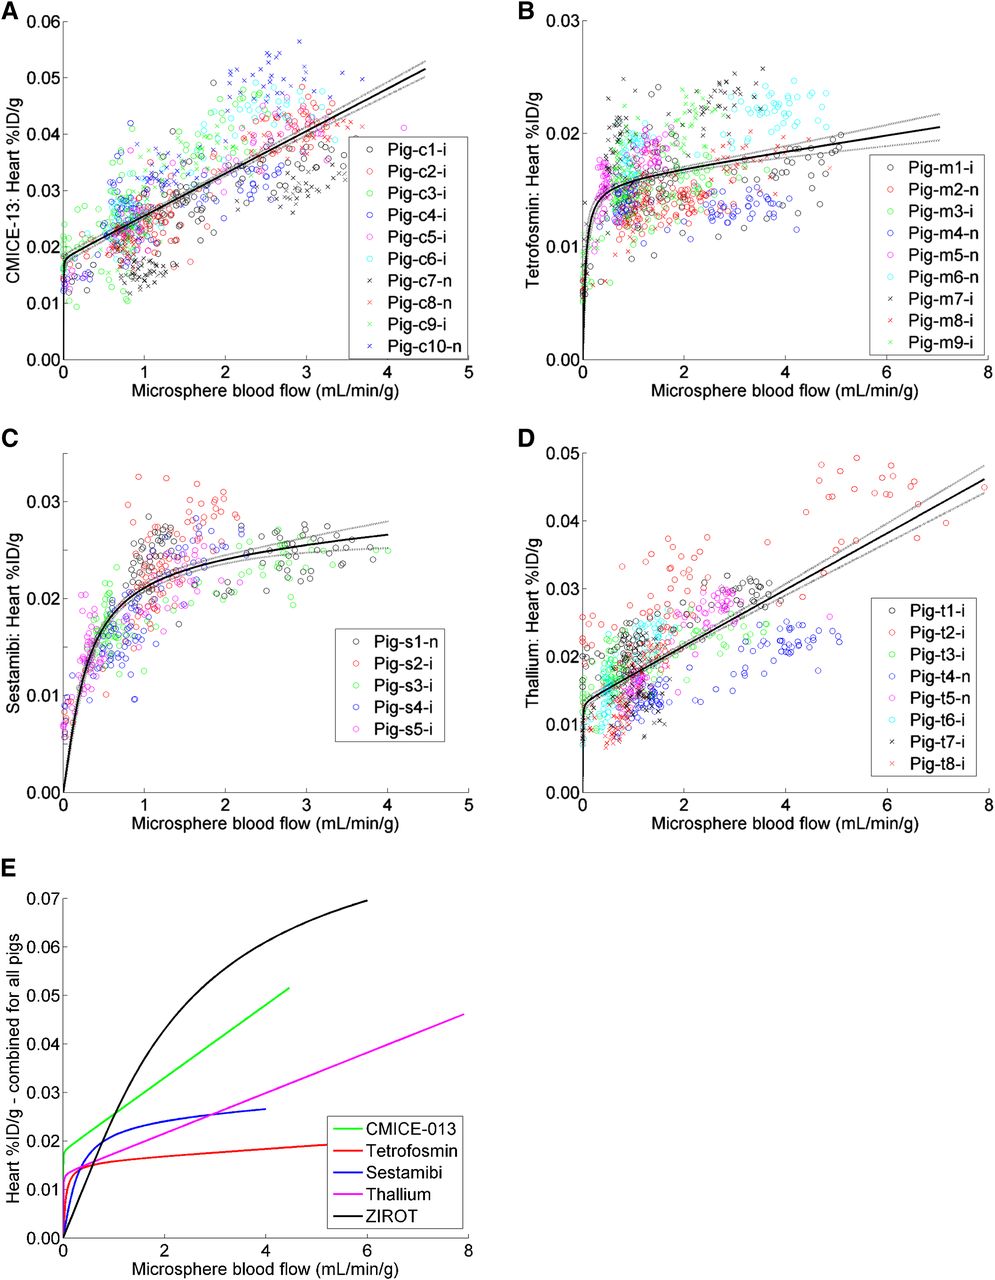
Tracer uptake versus microsphere flow values for each tissue sample from individual animals with CMICE-013 (A), 99mTc-tetrofosmin (B), 99mTc-sestamibi (C), and 201Tl (D). Fit to Equation 2 is shown as solid line for each dataset, with 95% confidence interval on fit represented by dotted lines. Fitted curves to combined data are replotted separately for clarity (E) along with curve derived from previously reported data for 123I-iodorotenone (ZIROT) (3) as described in supplemental materials. n = normal pigs; i = ischemic pigs.
Left Ventricular Heart Uptake (%ID/g × 70 g*) at Selected Microsphere Flow Values
DISCUSSION
The images of CMICE-013 (Figs. 1–4) showed good imaging characteristics. Blood-pool clearance was rapid, with most of the tracer cleared in the first 3 min (Fig. 1). The contrast between the heart and lungs was excellent (Figs. 3 and 4)—the contrast for CMICE-013 was higher than 201Tl but lower than sestamibi and similar to tetrofosmin. The heart-to-liver contrast was similar to the standard SPECT tracers (Figs. 3 and 4). The occluded territory was clearly seen in the stress images (Figs. 2 and 4), with good contrast between low-flow and high-flow regions.
The uptake of CMICE-013 increased more rapidly with increased blood flow than all 3 of the standard SPECT perfusion tracers and had a higher percentage uptake per gram of myocardial tissues over the full range of blood flow values measured (Fig. 5). These findings suggest that CMICE-013 will have a larger percentage uptake in the heart, leading to a stronger signal and less noise in the cardiac images. The larger slope suggests that CMICE-013 would also provide better contrast between regions of low and high flow, possibly improving the sensitivity of the tracer for detecting regions of abnormal perfusion, particularly under high-flow conditions. This behavior is similar to other perfusion compounds that, like rotenone, bind to mitochondrial complex I: 123I-iodorotenone (ZIROT) (3) and 18F-flurpiridaz (14). For the purpose of comparison (Fig. 5), the relative uptake curve for I-ZIROT (3) was scaled to match the absolute uptake for CMICE-013 at a microsphere flow of 1 mL/min/g.
On the basis of the fitted value for the uptake versus flow curve of the tracers, an average uptake in the heart was calculated (Table 2). The average left ventricle weight was 70 g, and the average resting microsphere-measured blood flow was 0.9 mL/min/g, giving an uptake of 1.8% of the injected dose (%ID) at rest for CMICE-013. A stress flow of 2 mL/min would yield an uptake of 2.4 %ID. In comparison, the tetrofosmin uptake was measured as 1.1% at rest and 1.2% at a flow of 2 mL/min whereas sestamibi had an uptake of 1.4% and 1.7% at the same flow rates. These values are consistent with estimates of percentage tracer uptake at rest and stress from previous studies (15,16) and suggest that CMICE-013 may have greater myocardial uptake than currently used 99mTc tracers. The uptake of 201Tl was more linear with flow than were the 99mTc tracers but also had lower %ID uptake in the heart: 1.2% at 0.9 mL/min/g and 1.5% at 2.0 mL/min/g.
One limitation of our approach is tracer redistribution. Because the animal was not terminated for approximately 60 min after rest imaging and approximately 30 min after stress, redistribution of the tracer in that time may have distorted our estimates of the relative fraction of activity in the tissue sample. We have corrected for global biologic clearance from the heart, but redistribution could additionally change the spatial distribution of tracer in the heart muscle. Redistribution of 201Tl is known to be rapid, requiring stress imaging within 10–15 min after injection. A washout of the rest tracer would serve to decrease the true rest fraction, compared with that estimated from the images. Redistribution would also serve to fill in the reduced uptake in the transiently occluded region, reducing the apparent contrast. In the case of 201Tl, effort was made to minimize this effect by sacrificing the animal immediately after the end of the first stress image (15 min after stress injection). CMICE-013, like the standard 99mTc tracers sestamibi and tetrofosmin, does not rapidly redistribute (supplemental materials). An additional limitation of this model is that brief periods of ischemia can produce hyperemia after reperfusion (17). Any residual or redistributed tracer in the blood after reperfusion will be taken up in the ischemic area in proportion to an elevated flow rate thus also increasing uptake. The amount of tracer in the blood at reperfusion is small (Fig. 1), but we noted that the tissue samples with low microsphere flow had nonzero uptake leading to a nonzero intercept in the fitted line. Redistribution and residual tracer in the blood after reperfusion may be contributing factors to the uptake seen in the very-low-flow samples.
Attenuation and scatter corrections were not applied during the reconstruction of the images. Attenuation is known to cause artifacts in cardiac images, altering the relative distribution (18,19). In our study, though, the uptake of the tracers was measured using a well-counter and the self-attenuation in the 1- to 2-g samples should be negligible. The fraction corresponding to rest was estimated from the ratio of the rest and stress images. In this ratio, the effects of attenuation will cancel out as the animal remains in the same position in the camera throughout imaging. It is not as clear that the effects of scatter will cancel because the distribution of activity can change from stress to rest, causing a change in the scatter fraction. In addition, scatter serves to reduce the contrast in areas of reduced uptake, and this could serve to alter the ratio of rest to stress counts. The vendor reconstruction software used for this study did not allow correction for scatter. Scatter correction would have to be applied as a precorrection to the projection data offline and the corrected projections loaded back onto the camera for reconstruction. Although possible, this approach was not pursued for this study. Thus scatter could also be one of the contributing factors to the nonzero uptake seen in low-flow regions.
Partial-volume effects caused by the limited resolution of the scanner and the postfiltering will also blur the estimated rest fraction of activity. Although the well-counter measurements are not affected by the spatial resolution of the images, the limited spatial resolution will cause spill-in of counts into the region of the transient occlusion and thus reduce apparent contrast at stress. Thus, the limited resolution will increase the apparent fraction of counts associated with stress and could lead to increased values for the uptake in the occluded region.
A final limitation of this study is that the biodistribution of the tracer was not measured. As with all iodinated radiotracers, deiodination in vivo will occur with this tracer, which would lead to accumulation in and significant radiation exposure to iodine-avid organs such as the thyroid. Biodistribution measurements of CMICE-013 in rats (9) estimate a patient radiation exposure of 7 μSv/MBq, and preliminary studies in separate pigs (10) estimate 21 μSv/MBq. These are similar to other 123I SPECT tracers and, like these other tracers, a thyroid-blocking agent administered before MPI would be recommended to minimize uptake. A thorough evaluation of CMICE-013 biodistribution in pigs will be reported separately, although more clinically relevant dose estimates will require evaluation in human volunteers.
CONCLUSION
A novel 123I-labeled SPECT MPI tracer, CMICE-013, was studied in a pig model of stress-induced ischemia. The tracer had good contrast between the heart and surrounding organs. CMICE-013 had greater myocardial uptake, compared with 201Tl, 99mTc-sestamibi, and 99mTc-tetrofosmin, and displayed a greater, more linear change in uptake with increased blood flow. CMICE-013 is a promising new non–99mTc tracer for SPECT MPI.
DISCLOSURE
The costs of publication of this article were defrayed in part by the payment of page charges. Therefore, and solely to indicate this fact, this article is hereby marked “advertisement” in accordance with 18 USC section 1734. This project was supported by the Canadian Institute of Health Research (CIHR) and Natural Sciences and Engineering Research Council of Canada (NSERC) (grant RMIPJ 389641-09) and by the Heart and Stroke Foundation of Canada (NA#6939, BR#7489). R. Glenn Wells and Terrence D. Ruddy collaborate with GE Healthcare and have received research support. Lihui Wei, Yin Duan, Pasan Fernando, and Corinne Bensimon were employees of Nordion Inc. during this study. No other potential conflict of interest relevant to this article was reported.
Footnotes
Published online Apr. 3, 2015.
- © 2015 by the Society of Nuclear Medicine and Molecular Imaging, Inc.
REFERENCES
- Received for publication November 10, 2014.
- Accepted for publication March 9, 2015.


Jump to section
Related Articles
Cited By...
- Radiotracers to Address Unmet Clinical Needs in Cardiovascular Imaging, Part 1: Technical Considerations and Perfusion and Neuronal Imaging
- Quantitative Assessment of Coronary Microvascular Function: Dynamic Single-Photon Emission Computed Tomography, Positron Emission Tomography, Ultrasound, Computed Tomography, and Magnetic Resonance Imaging
- State of the art in nuclear cardiology