


Abstract
Our objective was to determine whether early change in standardized uptake values (SUVs) of 3′deoxy-3′-18F-fluorothymidine (18F-FLT) using PET with CT could predict pathologic complete response (pCR) of primary breast cancer to neoadjuvant chemotherapy (NAC). The key secondary objective was to correlate SUV with the proliferation marker Ki-67 at baseline and after NAC. Methods: This prospective, multicenter phase II study did not specify the therapeutic regimen, thus, NAC varied among centers. All evaluable patients underwent 18F-FLT PET/CT at baseline (FLT1) and after 1 cycle of NAC (FLT2); 43 patients were imaged at FLT1, FLT2, and after NAC completion (FLT3). The percentage change in maximum SUV (%ΔSUVmax) between FLT1 and FLT2 and FLT3 was calculated for the primary tumors. The predictive value of ΔSUVmax for pCR was determined using receiver-operating-characteristic curve analysis. The correlation between SUVmax and Ki-67 was also assessed. Results: Fifty-one of 90 recruited patients (median age, 54 y; stage IIA–IIIC) met the eligibility criteria for the primary objective analysis, with an additional 22 patients totaling 73 patients for secondary analyses. A pCR in the primary breast cancer was achieved in 9 of 51 patients. NAC resulted in a significant reduction in %SUVmax (mean Δ, 39%; 95% confidence interval, 31–46). There was a marginal difference in %ΔSUVmax_FLT1-FLT2 between pCR and no-pCR patient groups (Wilcoxon 1-sided P = 0.050). The area under the curve for ΔSUVmax in the prediction of pCR was 0.68 (90% confidence interval, 0.50–0.83; Delong 1-sided P = 0.05), with slightly better predictive value for percentage mean SUV (P = 0.02) and similar prediction for peak SUV (P = 0.04). There was a weak correlation with pretherapy SUVmax and Ki-67 (r = 0.29, P = 0.04), but the correlation between SUVmax and Ki-67 after completion of NAC was stronger (r = 0.68, P < 0.0001). Conclusion: 18F-FLT PET imaging of breast cancer after 1 cycle of NAC weakly predicted pCR in the setting of variable NAC regimens. Posttherapy 18F-FLT uptake correlated with Ki-67 on surgical specimens. These results suggest some efficacy of 18F-FLT as an indicator of early therapeutic response of breast cancer to NAC and support future multicenter studies to test 18F-FLT PET in a more uniformly treated patient population.
Systemic neoadjuvant chemotherapy (NAC) before surgery plays a role in locally advanced breast cancer to downstage disease to increase the chances for breast-conserving surgery, eradicate micrometastases, and provide an indication of therapeutic responsiveness (1). The eradication of invasive cancer after NAC, that is, pathologic complete response (pCR), is a predictor of improved survival (2,3). However, conventional chemotherapy regimens result in pCR in only a minority of patients. In the era of individualized medicine, assessing pathologic response after completion of NAC does not allow for therapy adaptation with earlier discontinuation of ineffective therapies. Patients without sufficient response might benefit from switching to more effective alternative treatments early during the course of NAC. In this regard, there is a need to develop noninvasive imaging methodologies that can provide an early indication of response. Currently, treatment response is largely assessed by measurement of tumor size after several cycles of chemotherapy. Size changes can lag behind therapy-induced molecular changes, motivating the use of molecular imaging methods to assess response. Although 18F-FDG PET has been used commonly to monitor response to treatment in breast cancer, it has limitations that include prediction of pCR across different phenotypes (4,5). PET imaging with 3′-deoxy-3′-18F-fluorothymidine (18F-FLT) PET provides a noninvasive method for evaluating cell proliferation, an early indicator of therapeutic response. 18F-FLT is a substrate for thymidine kinase-1, and the accumulation of 18F-FLT in tumors provides a quantitative measure of cell proliferation through the relationship between thymidine kinase-1 expression and cell cycle regulation (6–9). Several prior single-center studies have demonstrated that changes in breast cancer tumor proliferation assessed by 18F-FLT PET/CT early after initiating chemotherapy predict tumor response with good sensitivity; however, the results of these studies were variable and none of the prior studies investigated the potential for predicting pCR to NAC (10–17). In the present multicenter study, our objective was to correlate changes measured by 18F-FLT in the primary tumor early during NAC with pCR in locally advanced breast cancer patients. We also studied both pretherapy and posttherapy association of 18F-FLT uptake with the tissue proliferative marker Ki-67 to compare 18F-FLT PET/CT against an accepted reference standard for cellular proliferation.
MATERIALS AND METHODS
Patients and Study Design
American College of Radiology Imaging Network (ACRIN) 6688 was an observational, nonrandomized, multicenter phase II study. This study was approved by the Institutional Review Board of each participating center, and all subjects signed a written informed consent form. The primary objective was to correlate the percentage change in maximum standardized uptake value (SUVmax) between pretherapy (FLT1) and 18F-FLT PET/CT after 1 cycle (FLT2) (%ΔSUVmax_FLT1-FLT2) of NAC with pCR in breast cancer patients for whom NAC was clinically indicated. The eligibility criteria included histologically confirmed breast cancer diagnosis, primary breast cancer measuring greater than or equal to 2.0 cm, being a candidate for NAC and surgical resection of residual primary tumor after NAC, and no evidence of stage IV disease. The chemotherapy regimens chosen for each patient were not specified by trial design as long as the patients were on a treatment containing cytotoxic agents as key components of the regimen. Hormonal and other targeted therapies were allowed, but only when given in association with chemotherapy agents. The eligible patients were planned to undergo 3 18F-FLT PET/CT studies, FLT1, FLT2, and after completion of NAC before surgery (FLT3).
The key secondary objectives were to measure the correlation between FLT1 and FLT3 uptake parameters and immunohistochemical (Ki-67) analysis of pretherapy biopsy and posttherapy surgical specimens, respectively. Other secondary objectives included in this report were to evaluate the relationship between FLT1, FLT2, and FLT3 uptake parameters and pCR of the primary tumor and residual cancer burden (RCB) (18) and pCR to NAC in lymph node (LN) metastases, as well as to confirm safety and define adverse effects of 18F-FLT.
18F-FLT PET/CT Protocol
18F-FLT was used under the authority of a National Cancer Institute–sponsored investigational new drug application. After the injection of 2.6 MBq/kg (mean, 167 MBq; range, 110–204 MBq), a whole-body image (5–7 bed positions) was obtained at 60 min (mean, 70 min; range, 50–101 min). All patients were scanned on calibrated and ACRIN-accredited PET/CT scanners, which included review of image quality and testing of SUVs using a uniform phantom and review of images as previously reported (19). A static torso survey was acquired for all patients. Sixty-minute dynamic regional PET/CT imaging was optional (results not included in this report). When used, dynamic PET imaging was performed first, followed by the torso survey using static PET imaging. There were 3 planned 18F-FLT PET/CT sessions. Baseline (FLT1) scanning was completed within 4 wk before NAC initiation. The early therapy (FLT2) scan was planned at 5–10 d after the initiation of the first cycle of the NAC and before the second cycle of NAC. Posttherapy 18F-FLT (FLT3) was performed after the completion of NAC and within 3 wk before surgery. All sequential imaging sessions were performed on identical or technically equivalent PET/CT scanners for any individual patient. An adverse event evaluation was performed at each imaging time point. After completion of NAC, the subjects underwent surgical resection of the breast primary (segmental or total mastectomy) and axillary nodal evaluation.
18F-FLT PET/CT Image Data Analysis
All 18F-FLT PET/CT images were transferred to the ACRIN Core Laboratory for quality control, archiving, and analysis. Primary image interpretation was based on semiquantitative analysis (SUV) at a Core Laboratory site at the University of Washington. Image review and region placement was supervised by 2 nuclear medicine board-certified physicians with extensive experience in PET/CT, masked to patient characteristics and outcome. Participating sites first indicated up to 3 primary tumor locations and up to 5 other nonprimary tumors based on local interpretation. At the Core Laboratory, volumes of interest (VOIs) were positioned over the area of highest activity for both the primary and the nonprimary breast tumors at FLT1. The SUVpeak, defined as the average SUV from a 1.0-cm-diameter circular VOI (range of 0.75–1.5 cm, depending on scanner resolution) centered over the hottest tumor pixel at FLT1, was also created. VOIs were constructed on FLT2 and FLT3 images based on CT localization, and residual tumor uptake when present, for all sites visualized at FLT1. The VOIs for FLT1, FLT2, FLT3 were verified independently by 2 expert reviewers masked to the clinical and pathologic results. The SUVpeak, as described above; the SUVmean, the average SUV tumor value; and SUVmax, the maximal pixel intensity in the 1-mL tumor VOI, were recorded. For multiple primary tumors, the mean SUVmax for all tumor sites was used as the patient’s overall tumor SUV. The axillary LNs were analyzed using the same methodology, including only those LNs measuring 1.0 cm or greater in maximum dimension on CT to minimize partial-volume effects. No partial-volume corrections of the SUVs were attempted given the challenges of determining tumor boundaries from CT and the variability of the included scanner types.
Histopathology Analysis
The paraffin blocks or 5 unstained sections containing tumor tissue from the diagnostic biopsy and posttreatment surgical specimen were collected and sent to the Core Pathology Laboratory at Virginia Commonwealth University (CPL-VCU) for analysis. No additional biopsy was obtained. If there was residual tumor on posttreatment specimens, a representative section was acceptable but if no residual tumor was present per original pathology reports or in the posttreatment section, the entire tumor bed was sectioned to confirm pCR. If no viable or residual tumor remained on review of all sections, a pCR was documented.
Pathologic Response
Assessment of pathologic response was performed at the treating site and reviewed at CPL-VCU. pCR is defined as an absence of viable invasive tumor at histopathologic examination of a posttherapy breast surgical specimen. Residual ductal carcinoma in situ in the absence of viable invasive cancer was considered a pCR. Dichotomous response assessment was performed, with a result of either pCR or no-pCR.
Residual Cancer Burden Categories
A secondary measure assessed the RCB at CPL-VCU. The RCB was calculated as an index combining pathology measurements as described previously (18). There were 4 RCB categories: RCB 0 (pCR), RCB 1 (minimal residual disease), RCB 2 (moderate residual disease), and RCB 3 (extensive residual disease or chemoresistant).
LN Status Analysis
The participating sites’ pathology reports were reviewed for LN status. In the case of a positive LN, a section of the LN was requested if size was unavailable from the report. In positive cases when a section was unavailable, if the original pathology report indicated macrometastasis, the size was assumed greater than 2 mm.
Ki-67 Analysis
An index of cellular proliferation was determined on pre- and posttreatment paraffin-embedded specimens (3- to 5-μm sections), by immunohistochemistry using monoclonal mouse antihuman Ki-67 antigen (clone MIB-1; DAKO Denmark A/S). A Ki-67 score was defined as the percentage of total number of tumor cells with nuclear staining over the total number of tumor cells in 10 high-power fields (at 400×, Eclipse 80i light microscope [Nikon]) (20). The Ki-67 labeling index was also calculated as the number of Ki-67–positive tumor cells per one thousand tumor cells.
Adverse Effect Assessment
An adverse event evaluation form was completed after all imaging time points. All adverse events were recorded within a 24-h period.
Statistical Analysis
Data were analyzed using SAS (version 9.4; SAS Institute) and R software (version 3.1.0; R project, www.r-project.org). The study was designed to accrue 54 patients (including 10% dropout) to detect a difference of 0.25 in AUC (area under the receiver-operating-characteristic [ROC] curve) between the null hypothesis (AUC, 0.50, i.e., by chance) and the alternative hypothesis (true AUC ≥ 0.75) with the significance level 0.05 and power 0.80. The pCR rate was assumed to be 0.25 in the sample size calculation. The percentage change was defined as (SUV at FLT1 – SUV at FLT2)/SUV at FLT1 × 100 (%ΔSUVmax_FLT1-FLT2). The pCR was based on the pathology results as described above. The empiric AUC was calculated, and the 90% confidence interval (CI) was constructed from 2,000 bootstrapping. The optimal cutoff on the ROC curve was estimated using the Youden index method (21). The corresponding sensitivity and specificity were then calculated with the optimal cutoff for using the percentage change to detect pCR. The Delong method was used to test if the observed AUC was significantly greater than 0.5 with the 1-sided P value (22). We also tested if SUV reduction in the pCR group was significantly larger than that in the no-pCR group using the Wilcoxon method with 1-sided P value. A key secondary objective was to evaluate the correlation between SUV and Ki-67 labeling index at the baseline PET and at the PET after the treatment. This correlation was quantified by the Spearman correlation coefficient (r) using the Cohen and Cohen method (23). For the LN evaluation, a 3-category grouping was first implemented (i.e., 0 positive nodes, 1–3 positive nodes, and >3 positive nodes), and then Kruskal–Wallis 1-way ANOVA was conducted to compare SUV distributions among groups with 2-sided P values. For RCB evaluation, the 4 categories were binned into 2 groups (RCB 0 and 1 vs. RCB 2 and 3) (18), and the comparison was conducted by Wilcoxon 2-sample test with 2-sided exact P value reported. The logistic regression was also fitted to quantify the association of the dichotomized RCB with %ΔSUVmax_FLT1-FLT2 or %ΔSUVmax_FLT1-FLT3.
RESULTS
Ninety patients were registered by 17 participating institutions (Supplemental Table 1; supplemental materials are available at http://jnm.snmjournals.org), between November 2009 and August 2012. All institutions had Institutional Review Board approval of the protocol, and all patients signed the informed consent form. Fifty-one of 90 patients were eligible for the primary objective analysis and completed both FLT1 and FLT2 scans within the study timeline. The remaining 39 patients did not fulfill the primary aim eligibility criteria for various reasons (Supplemental Tables 2 and 3). Up to 73 patients met the eligibility criteria for the secondary objective analyses correlating 18F-FLT uptake to the Ki-67, including 72 patients undergoing FLT1 and 43 undergoing FLT3. The patient characteristics are displayed in Table 1. All patients tolerated the 18F-FLT PET/CT protocol, and none suffered significant study-related adverse effects.
Patient Demographics
Inherent to the protocol design, chemotherapy protocols and timing varied significantly among participants (Supplemental Table 4). There was some variability in uptake times, related to optional dynamic scans performed at several sites (not included in this analysis). However, uptake times from the same patient in serial scans were similar (Supplemental Table 5). Treatment for more than 60% of the patients included a combination of doxorubicin with cyclophosphamide, followed or preceded by a taxane.
Primary Objectives
18F-FLT PET/CT Imaging and pCR
Of 51 patients eligible for primary objective analysis, 43 completed all FLT1, FLT2, and FLT3 imaging studies, and 8 completed only FLT1 and FLT2 studies. All evaluable patients had measurable disease in the breast (>2.0 cm, median, 4.0 cm; range, 2.0–13.0 cm). In large tumors, regions of imaging-based necrosis were excluded from the analysis. A pCR was achieved in 9 (18%) patients; of the remaining 42 (82%) patients who had a no-pCR, 31 (73%) had partial and 11 (26%) had no pathologic response. The median interval between FLT1 and initiation of chemotherapy was 3 d (range, 1–38 d), median interval between first chemotherapy and FLT2 was 7 d (range, 3–17 d), and in all cases FLT2 was before the second NAC cycle; median interval between FLT3 and surgery was 8 d (range, 1–70 d).
%ΔSUVmax_FLT1-FLT2 by pCR
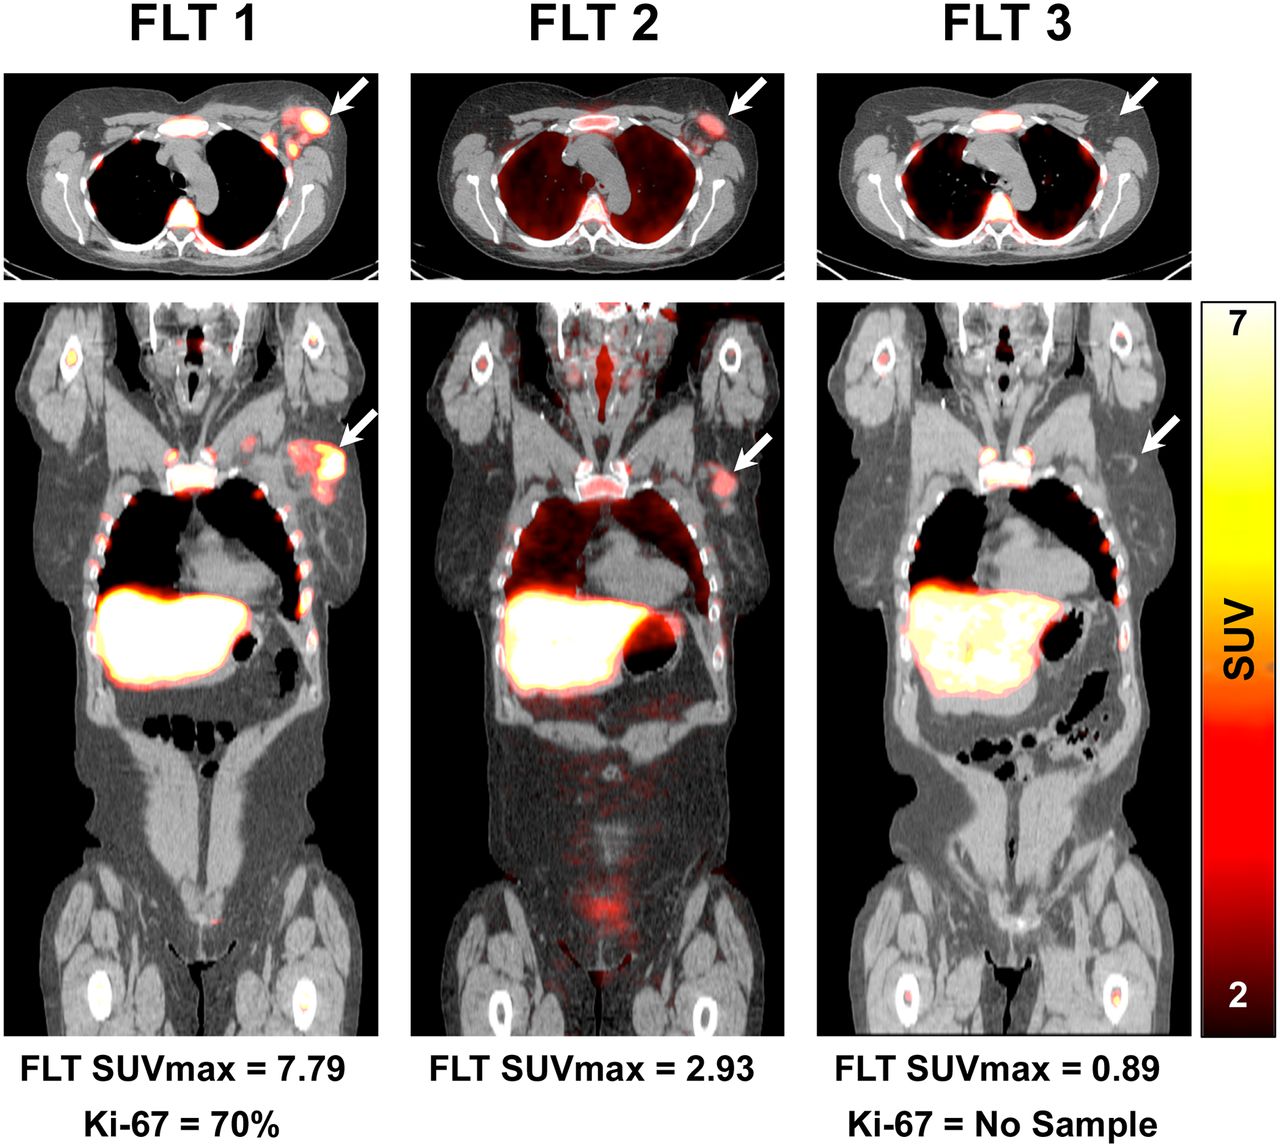
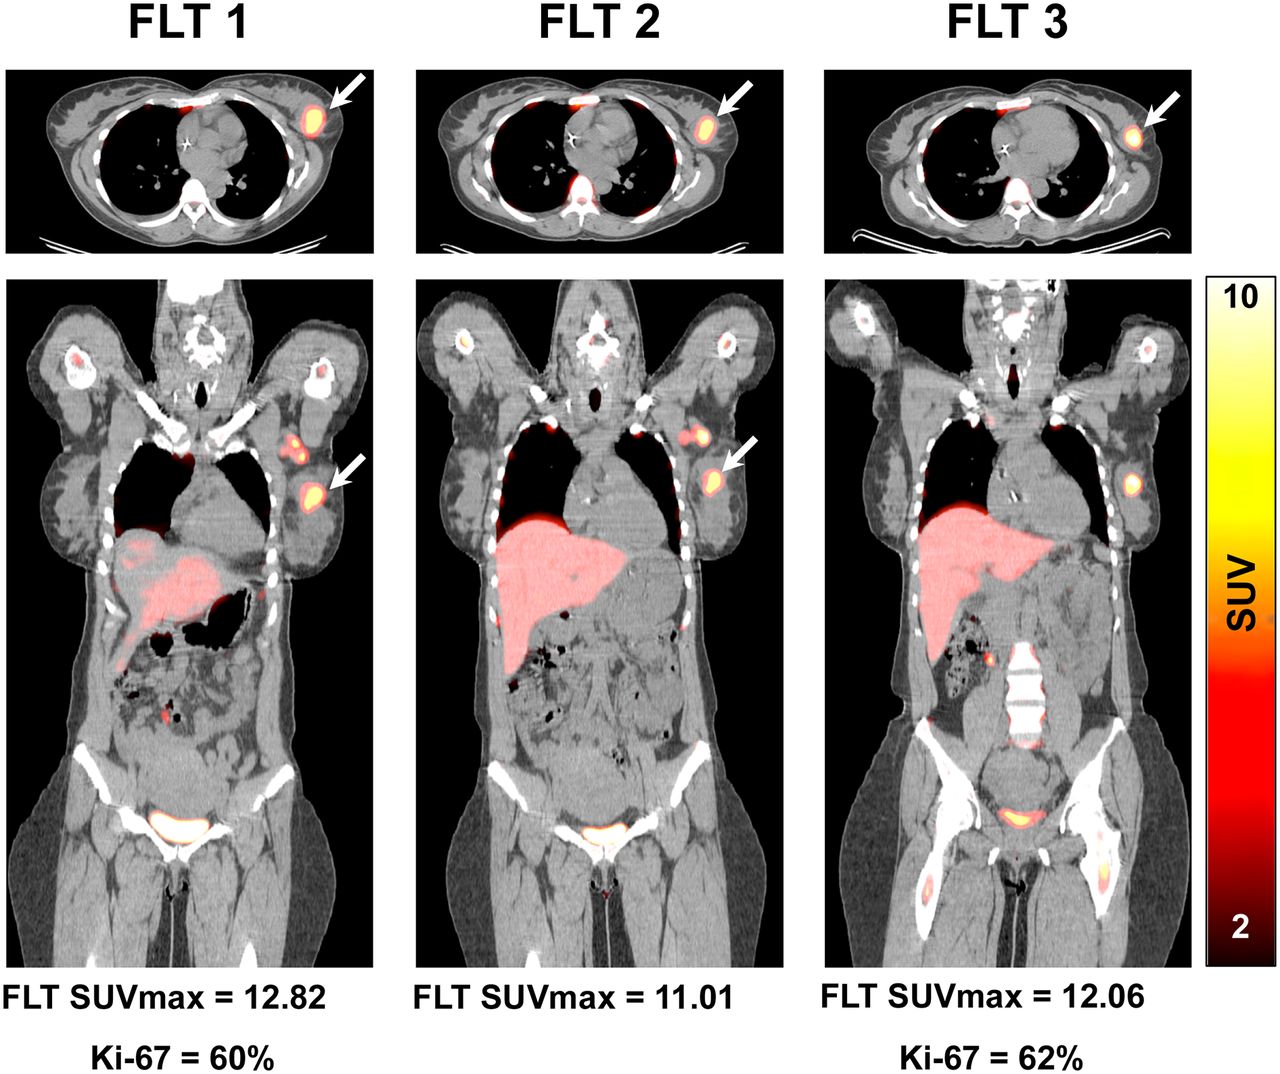
Examples of serial 18F-FLT PET/CT studies are shown in Figures 1 and 2. The FLT1 SUVmax was not different between pCR and no-pCR groups (mean ± SD, 6.1 ± 3.2 vs. 5.6 ± 3.0; difference, −0.5 ± 3.0; 95% CI, −2.7–1.7, P = 0.62) (Table 2; Supplemental Tables 6 and 7). The %ΔSUVmax_FLT1-FLT2 changes are presented in Table 3. There was a marginal difference in %ΔSUVmax_FLT1-FLT2 between pCR and no-pCR patients (Wilcoxon, 1-sided P = 0.050). The corresponding value for %ΔSUVpeak_FLT1-FLT2 and %ΔSUVmean_FLT1-FLT2 were similar (P = 0.056, 0.033, respectively).


Distributions of SUVmax and Ki-67 Across Different Time Points
Distributions of SUV Differences Between Time Points and by Pathologic Response Status
ROC Analysis of %ΔSUVmax_FLT1-FLT2 in Predicting pCR
The AUC for %ΔSUVmax_FLT1-FLT2 was 0.68 (90% CI, 0.50–0.83, Delong 1-sided P = 0.046) (Fig. 3), which is marginally significant from the null hypothesis of AUC = 0.50. The AUC for %ΔSUVpeak_FLT1-FLT2 was 0.67 (90% CI, 0.50–0.82, Delong 1-sided P = 0.044). The AUC for %ΔSUVmean_FLT1-FLT2 was 0.70 (90% CI, 0.54–0.84, Delong 1-sided P = 0.016). The optimal cutoff of %ΔSUVmax_FLT1-FLT2 was 51% from the Youden index, and the corresponding sensitivity and specificity were 0.56 (95% CI, 0.21– 0.86) and 0.79 (95% CI, 0.63–0.90), respectively.

Secondary Objectives
%ΔSUVmax_FLT1-FLT3 by pCR
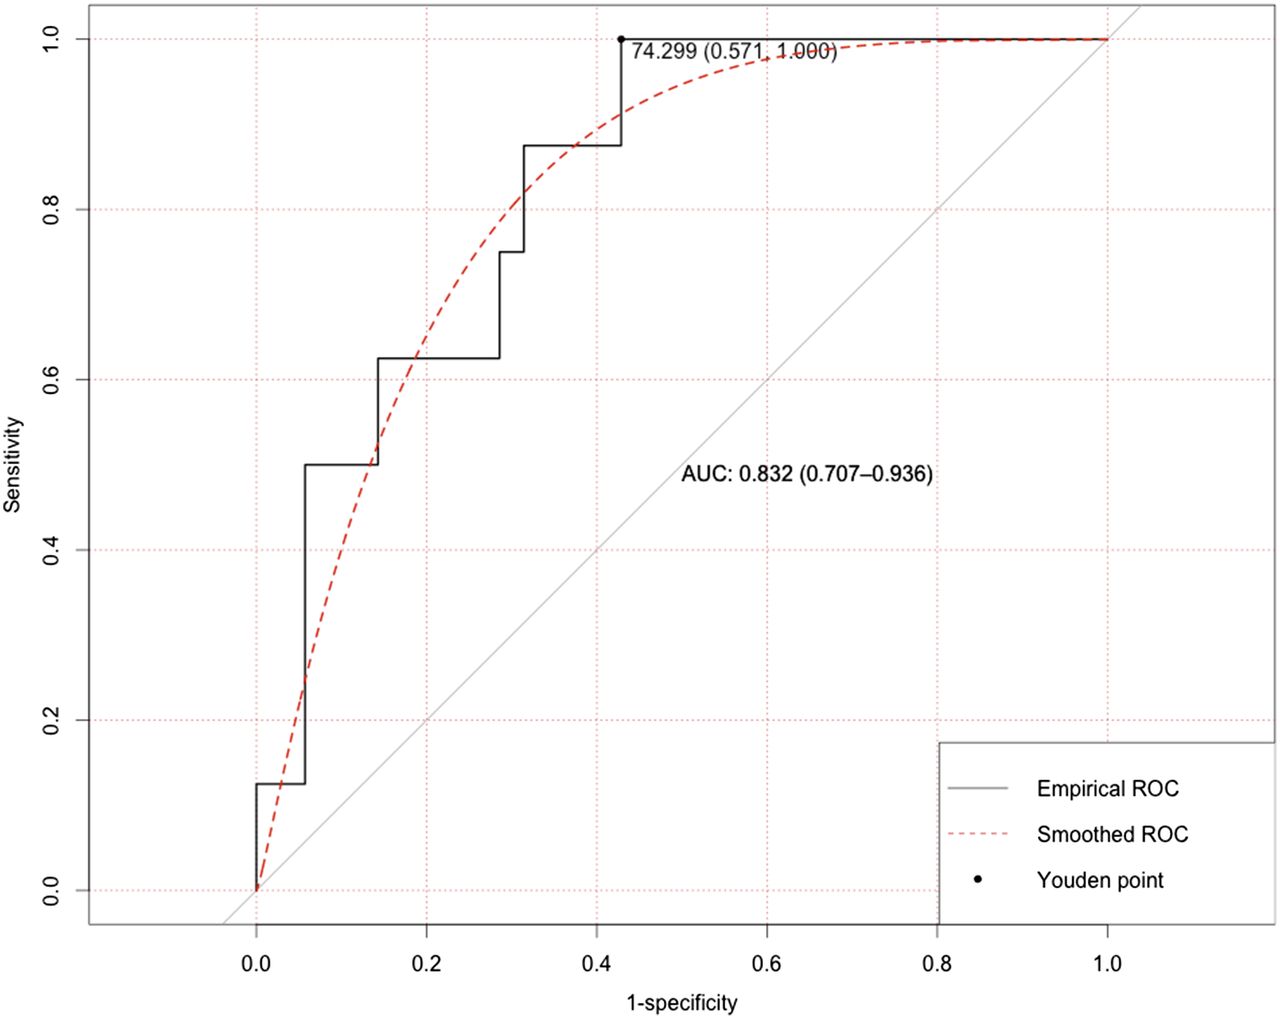
Of 43 patients who underwent both FLT1 and FLT3 scans, the mean reduction in SUVmax (%ΔSUVmax_FLT1-FLT3) was 67% (range, −4%–96%) (Table 3). There was a significant difference in %ΔSUVmax_FLT1-FLT3 between 8 pCR and 35 no-pCR patients (Wilcoxon, 1-sided P = 0.0013). The corresponding values for %ΔSUVmean_FLT1-FLT3 and %ΔSUVpeak_FLT1-FLT3 were also similar (not shown). The AUC for %ΔSUVmax_FLT1-FLT3 in the prediction of pCR was 0.83 (90% CI, 0.72–0.94, Delong 1-sided P < 0.001) (Fig. 4). The AUC for %ΔSUVpeak_FLT1-FLT3 was 0.82 (90% CI, 0.69–0.92, Delong 1-sided P < 0.001), and AUC for %ΔSUVmean_FLT1-FLT3 was 0.80 (90% CI, 0.68–0.92, Delong 1-sided P < 0.001).

Correlation Between 18F-FLT SUVmax and Ki-67 Expression
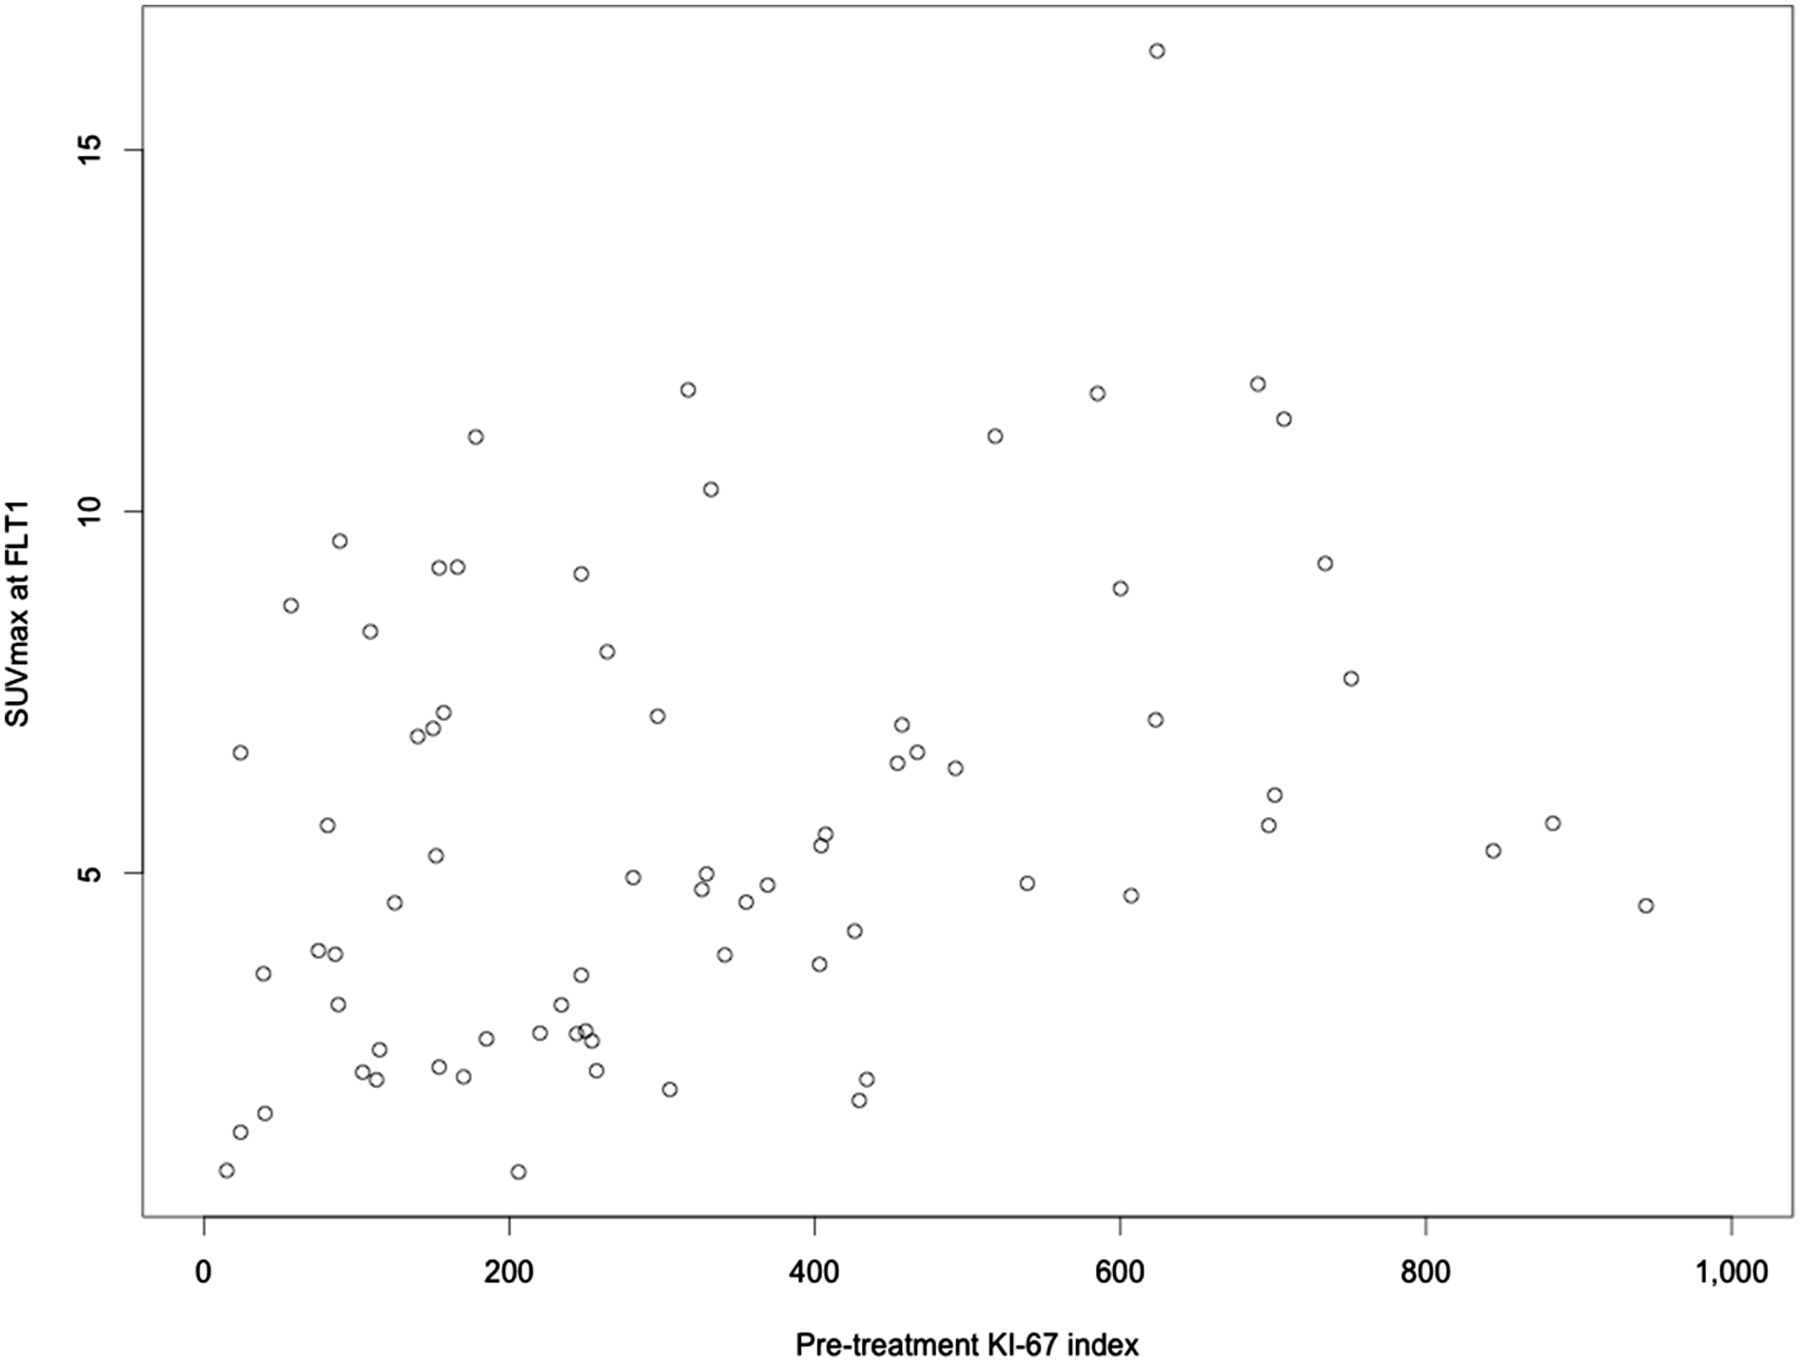
Suitable histopathology was available in 72 of the 90 recruited patients. There was a weak correlation between FLT1 SUVmax and Ki-67 (r = 0.35; 95% CI, 0.13–0.54; P = 0.002, Fig. 5).

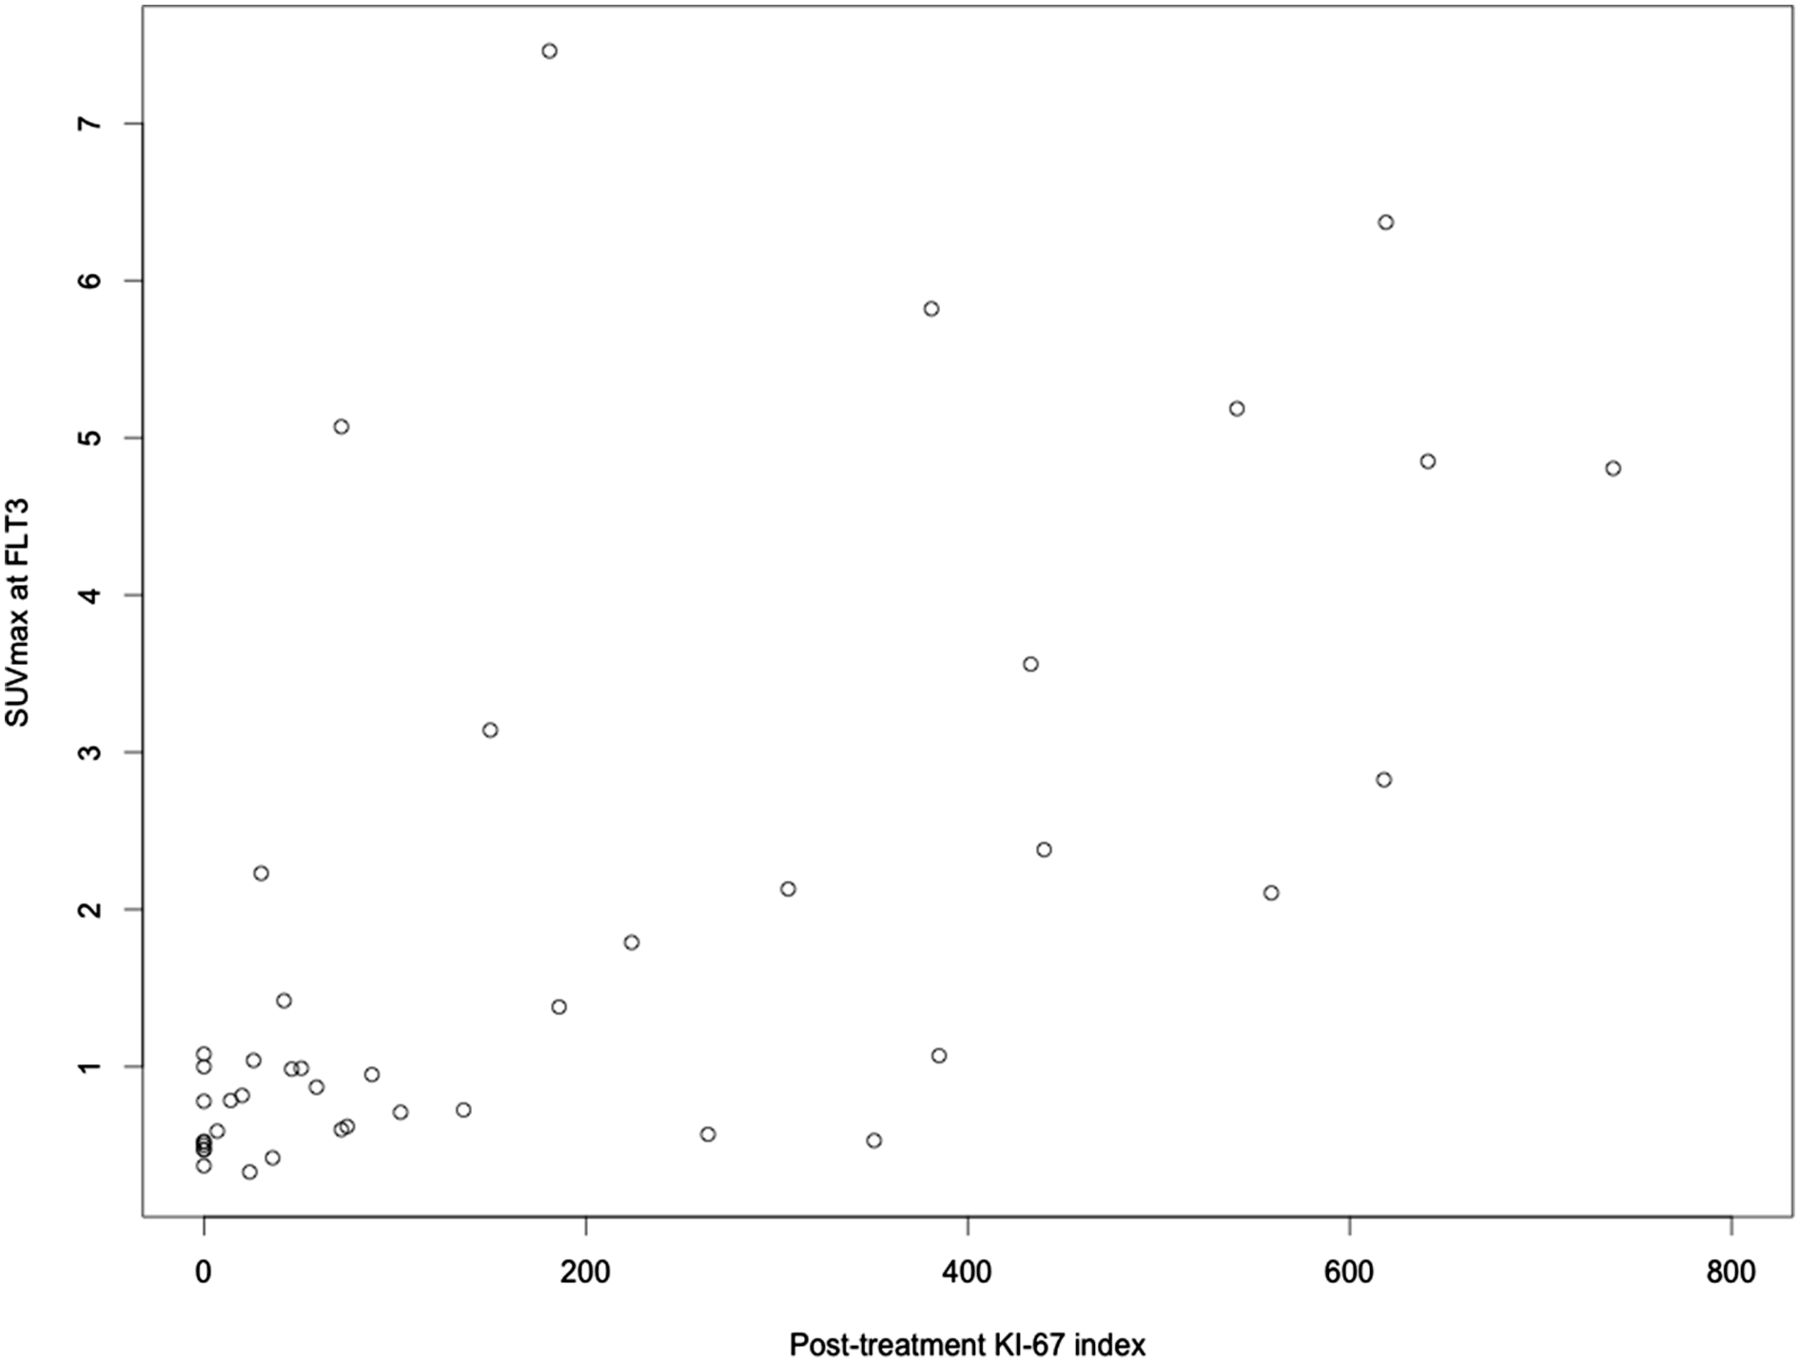
There were 43 patients who had suitable post-NAC tissue samples for correlation between surgical specimens and FLT3 SUVs. There was an improved correlation between FLT3 and Ki-67 (r = 0.68; 95% CI, 0.47–0.81; P < 0.0001, Fig. 6), compared with that of FLT1 and Ki-67 (P = 0.020 for the difference in correlations). The correlation between %ΔSUVmax_FLT1-FLT3 and %ΔKi-67FLT1-FLT3 was 0.57 (95% CI, 0.35–0.75; P < 0.0001) from the analysis of 42 patients who had Ki-67 expressions at both FLT1 and FLT3 time points.
LN Evaluation
Data on 38 patients were available for histopathologic LN evaluation after NAC: 14 with negative nodes, 15 with 1–3 LN metastases, and 9 with more than 3 LN metastases. The mean SUVmax was not different among the 3 groups—FLT1, FLT2, and FLT3—at any time point (Supplemental Table 8). In patients with negative nodes, mean 18F-FLT SUVmax at FLT1 and FLT3 were 4.4 ± 3.0 and 0.8 ± 0.4, respectively, compared with 6.6 ± 3.6 and 1.2 ± 0.7 for those with 1–3 positive LNs after NAC (or with 7.3 ± 5.0 and 2.5 ± 2.2 for those with >3 positive nodes after NAC).
%ΔSUVmax_FLT1-FLT2 and LN Status at Surgery
The %ΔSUVmax_FLT1-FLT2 and %ΔSUVmax_FLT1-FLT3 were not associated with the LN status; the mean %ΔSUVmax_FLT1-FLT2 and %ΔSUVmax_FLT1-FLT3 were not different among negative (0 positive LNs), 1–3 positive, and more than 3 positive groups (Supplemental Table 9).
18F-FLT PET/CT and Primary Tumor RCB
Suitable histopathology was available in 35 patients for RCB evaluation: 14 patients with RCB 0 or 1 and 21 patients with RCB 2 or 3. The SUVmax measurements at FLT1 and FLT2 were not different between these 2 groups (P = not significant) whereas there was a difference in SUVmax at FLT3 (P = 0.010) (Supplemental Table 10). The %ΔSUVmax_FLT1-FLT2 was not associated with RCB when RCB was dichotomized (P = not significant) whereas %ΔSUVmax_FLT1-FLT3 was (P < 0.001); the mean values were different between the 2 groups at FLT3 (Supplemental Table 11). The magnitude of %ΔSUVmax_FLT1-FLT3 tended to be associated with lower RCB when RCB was evaluated as a dichotomized variable (RCB 0–1 vs. RCB 2–3 (13)) (odds ratio for %ΔSUVmax_FLT1-FLT3, 0.86; 95% CI, 0.76–0.97, P = 0.013).
Adverse Effects
There were no severe or life-threatening events. In total, there were 20 adverse events. Only 2 mild adverse events were considered to be possibly related to 18F-FLT injection; both were patient complaints of facial warmth during scanning.
DISCUSSION
Changes of proliferative status of breast cancer measured by tissue assay early after chemotherapy or endocrine therapy are predictive of outcome (24). Furthermore, 18F-FLT PET, as a surrogate of cell proliferation, was shown to detect therapy-induced proliferative changes as early as 1 wk after chemotherapy (11,13). In our study testing 18F-FLT PET as a predictor of tumor response to NAC after a single treatment dose, we found a marginal predictive value of %ΔSUVmax_FLT1-FLT2 for pCR, with AUCs in the range of 0.66–0.70 for different measures of 18F-FLT uptake. The %ΔSUVs of FLT1 to FLT2 or FLT1 to FLT3 were not associated with the axillary LN status at surgery. We also found that posttherapy 18F-FLT uptake had a significant correlation with the Ki-67 proliferative index in posttherapy surgical specimens, further supporting 18F-FLT as a marker of tumor proliferation and therapeutic response. Additionally, the change between pretherapy and posttherapy 18F-FLT PET (FLT1–FLT3) was a strong indicator of pCR, with AUCs of 0.80–0.83. However, whereas our results suggest an ability of early serial 18F-FLT PET/CT to predict therapeutic response, the accuracy of this predictive value was modest.
There has been variability in the published studies for 18F-FLT PET/CT as an early indicator of response. Small, single-center preliminary studies indicated good predictive value for response (11–14), whereas others did not (12,15–17). Our multicenter study suggested some utility for 18F-FLT as an early predictor of response, but preliminary reports of other multicenter trials did not find a predictive value for 18F-FLT (25). The difference between our study and the previous others likely lies with variations in endpoints (clinical vs. pathologic response), image acquisition and analysis methods, patient populations, and therapy regimens. None of the prior studies investigated the potential of 18F-FLT PET imaging for predicting pCR to NAC but rather investigated overall clinical response (11), changes in tumor size and in tumor markers in patients with all stages including distant metastasis (13). Our study had the advantage of having a slightly larger patient population, rigorous central system qualification, and image and pathologic analyses. Although there was some variability in 18F-FLT uptake time in our study due to the optional dynamic imaging protocol, uptake times for each patient across longitudinal PET scans were reasonably consistent. The published results of multiple prospective studies indicated that early 18F-FDG PET can reasonably predict pathologic response to NAC in breast cancer (26–29). Our results on 18F-FLT PET were comparable with the prior published data by showing that NAC resulted in a significant SUVmax reduction (meanΔ, 39%; cutoff, 51%) despite a marginal significance between pCR and no-pCR groups. However, the relatively small number of patients with a pCR as well as the varying definitions of the pCR across studies should be taken into consideration when comparing our results with others.
The main limitation of our study was that it did not control treatment types, and there was a considerable variation in chemotherapeutic regimens—both type and frequency of treatments—across participating centers, resulting in variable definitions of 1 treatment cycle. This likely contributes to variability in 18F-FLT results between patients and limits the overall performance of 18F-FLT PET as an early indicator of response in our study. Variability in scan timing and timing relative to treatment may also have contributed to variable performance. In our cohort, only 18% of patients had a pCR, a result that is consistent with other trials in locally advanced breast cancer, using standard anthracycline–taxane combination chemotherapy in patients with heterogeneous tumor subtypes (30–32). It is also important to realize the unbalanced number of patients between the pCR and no-pCR groups (9 vs. 42). The limited number of patients with a pCR may have limited the ability to identify differences between high and low %ΔSUV between baseline and after 1 cycle of therapy. Further studies comparing changes in18F- FLT to longer-term survival endpoints might yield further insights but was beyond the scope of this study. Similarly, a recent study by Woolf et al. (15) reported that neither the baseline value nor the change in SUVmax after 1 cycle of NAC predicted treatment response, although most patients had a sizeable SUVmax reduction. Likewise, in our study, the mean decline in SUVmax_FLT1-FLT2 was 39%. Some data using tissue markers of proliferation suggest better predictive value in more aggressive tumor subtypes (e.g., human epidermal growth factor receptor type 2–positive, basal, or triple-negative cancers) and that these different tumor subtypes may have different responsiveness to cytoxic chemotherapy regimens (33,34,). 18F-FDG PET was shown to be most predictive in high-risk breast cancer phenotypes (4,5). Our data were not conducive to perform subgroup analysis with respect to various risk groups—that is, triple-negative, human epidermal growth factor receptor type 2–positive, because it was not powered for analyzing tumor subtypes. This analysis remains to be further pursued in future studies.
As a secondary objective, correlation with Ki-67 revealed only a weak correlation between SUVmax at FLT1 and Ki-67 expression from pretherapy biopsy specimens, but a better correlation was found between FLT3 SUVmax and Ki-67 in posttherapy surgical specimens. Although prior studies found a correlation between 18F-FLT uptake and Ki-67 expression (10,13,15), these results varied depending on both sample acquisition and postacquisition treatment of tissues, possibly affecting direct comparisons. A recent breast cancer study demonstrated a significant difference between pretherapy core biopsy and surgical sample Ki-67 values (P < 0.0001) in paired samples from untreated patients (35). Importantly, the difference represented an average difference in proliferation, with the core biopsies demonstrating a higher proliferation index than the surgical samples. Another factor potentially contributing to a variable pretherapy relationship between 18F-FLT uptake and Ki-67 is the range of included tumor subtypes; some preclinical studies suggested that 18F-FLT uptake and its correlation with Ki-67 may vary across tumor types (36). In our study, the weaker correlation in pretherapy biopsy samples compared with surgical specimens may also be related to intratumor spatial heterogeneity of cell proliferation (37). A meta-analysis by Chalkidou et al. showed that the 18F-FLT uptake and Ki-67 correlation was significant and independent of cancer type (38). They also reported that the whole surgical specimen provided a significant correlation, whereas biopsy samples did not. This finding is in line with our results. The agreement between posttherapy 18F-FLT and Ki-67 supports the utility of 18F-FLT as a response marker, as does a more robust ability to discern pCR on the basis of differences between the pre- and posttherapy 18F-FLT uptake (AUC = 0.80–0.83 for different SUV measures).
Some studies suggest that kinetic analysis of 18F-FLT uptake in breast cancer reportedly correlated better with Ki-67 than SUVs for distinguishing responders from nonresponders early during chemotherapy (8,39). We collected kinetic data in a select group of patients, but these results will be reported separately.
Residual disease is a continuous variable consisting of a range of tissue responses from complete response to refractory disease. The RCB index was proposed as a determinant of the extent of residual disease in the surgical specimens after NAC (18). The %ΔSUVmax_FLT1-FLT3 predicted RCB when RCB was evaluated as a continuous or dichotomized variable. The absolute SUVmax measurements at FLT1 and FLT2 were not different between the RCB groups; however, there was a significant difference in posttherapy FLT SUVmax (FLT3) for RCB 0–1 versus RCB 2 or greater.
CONCLUSION
18F-FLT PET/CT imaging of breast cancer after 1 cycle of NAC was marginally predictive of pCR despite highly variable chemotherapy regimens. Posttherapy NAC 18F-FLT uptake correlated with assay of Ki-67 on postsurgical tissue and with pCR. These early results, though not sufficient to support widespread use of 18F-FLT as an early response indicator for breast cancer, indicate the potential efficacy of 18F-FLT PET/CT as an indicator of early therapeutic response of breast cancer to NAC and support future studies in a more uniformly treated patient population.
DISCLOSURE
The costs of publication of this article were defrayed in part by the payment of page charges. Therefore, and solely to indicate this fact, this article is hereby marked “advertisement” in accordance with 18 USC section 1734. This work was supported by ACRIN, which receives funding from the National Cancer Institute through U01 CA080098, under the American Recovery and Reinvestment Act of 2009 (ARRA) and U01 CA079778. No other potential conflict of interest relevant to this article was reported.
Acknowledgments
We wish to acknowledge the important contribution of the ACRIN Core Laboratory. In addition, we acknowledge the efforts of the many centers that participated in this study, listed in Supplemental Table 1. We also thank Glenna Gabrielli, data manager, ACRIN, and Wei Bo, Biostatistics and Data Management Center Brown University, Rhode Island, for their contributions.
Footnotes
Published online Sep. 10, 2015.
- © 2015 by the Society of Nuclear Medicine and Molecular Imaging, Inc.
REFERENCES
- Received for publication May 11, 2015.
- Accepted for publication August 18, 2015.


Jump to section
Related Articles
Cited By...
- The Current and Future Roles of Precision Oncology in Advanced Breast Cancer
- The Influence of the Amino Acid Transporter LAT1 on Patient Prognosis and the Relationships between Tumor Immunometabolic and Proliferative Features Depend on Menopausal Status in Breast Cancer
- Classification of Hyper-scale Multimodal Imaging Datasets
- Fingerprint: An AI-based method for detection of mislabeled CT studies in clinical trials
- Breast Cancer 18F-ISO-1 Uptake as a Marker of Proliferation Status
- Cell-Proliferation Imaging for Monitoring Response to CDK4/6 Inhibition Combined with Endocrine-Therapy in Breast Cancer: Comparison of [18F]FLT and [18F]ISO-1 PET/CT
- Qualification of National Cancer Institute-Designated Cancer Centers for Quantitative PET/CT Imaging in Clinical Trials
- Functional Estrogen Receptor Imaging Before Neoadjuvant Therapy for Primary Breast Cancer
- Predicting Responses to Neoadjuvant Chemotherapy in Breast Cancer: ACRIN 6691 Trial of Diffuse Optical Spectroscopic Imaging