


Abstract
The goal of this study was to compare visual assessment of intratumor 18F-FDG PET uptake distribution with a textural-features (TF) automated quantification and to establish their respective prognostic value in non–small cell lung cancer (NSCLC). Methods: The study retrospectively included 102 consecutive patients. Only primary tumors were considered. Intratumor heterogeneity was visually scored (3-level scale [Hvisu]) by 2 nuclear medicine physicians. Tumor volumes were automatically delineated, and heterogeneity was quantified with TF. Mean and maximum standardized uptake value were also included. Visual interobserver agreement and correlations with quantitative assessment were evaluated using the κ test and Spearman rank (ρ) coefficient, respectively. Association with overall survival and recurrence-free survival was investigated using the Kaplan–Meier method and Cox regression models. Results: Moderate correlations (0.4 < ρ < 0.6) between TF parameters and Hvisu were observed. Interobserver agreement for Hvisu was moderate (κ = 0.64, discrepancies in 27% of the cases). High standardized uptake value, large metabolic volumes, and high heterogeneity according to TF were associated with poorer overall survival and recurrence-free survival and remained an independent prognostic factor of overall survival with respect to clinical variables. Conclusion: Quantification of 18F-FDG uptake heterogeneity in NSCLC through TF was correlated with visual assessment by experts. However, TF also constitutes an objective heterogeneity quantification, with reduced interobserver variability, and independent prognostic value potentially useful for patient stratification and management.
PET/CT imaging with 18F-FDG is today a well-established tool for diagnostic oncology applications (1). Its exploitation for tumor delineation in the planning of radiotherapy treatment (2) or monitoring of response to therapy (3,4) is increasing. For non–small cell lung cancer (NSCLC), 18F-FDG PET/CT image quantification has been shown to provide prognostic information. PET image–derived features, including metabolically active tumor volume (MATV), mean standardized uptake value (SUVmean), and total lesion glycolysis (TLG, defined as MATV × SUVmean), have been shown to provide an accurate assessment of tumor burden with potentially higher prognostic value than standard maximum SUV (SUVmax), for both surgical and nonsurgical patients (5–9).
Intratumor 18F-FDG uptake heterogeneity has been associated with treatment failure (10), and its quantification has recently generated interest (11–14), including in lung cancer (15). Several methodologies have been proposed to assess intratumor heterogeneity, including visual evaluation (16), SUV coefficient of variation (SUVCOV) (17), area under the curve of the cumulative histogram (CHAUC) (18), and textural-features (TF) analysis (17,19).
TF analysis can generate many features quantifying heterogeneity within a delineated MATV. Recent studies have identified a few of these features that are robust to the clinical range of reconstruction algorithms and acquisitions protocols (20), the delineation step, or the partial-volume effects (21), reaching similar or better physiologic reproducibility than SUV (22).
However, to date there has been no study investigating whether the quantitative heterogeneity assessment of the intratumor activity distribution through TF represents an added value relative to a visual assessment by nuclear medicine physicians. This study was therefore designed to compare a visual and qualitative tumor heterogeneity assessment with a characterization through TF analysis and to assess their respective prognostic value in NSCLC.
MATERIALS AND METHODS
Patients and PET/CT Imaging
One hundred eight consecutive nonmetastatic patients with newly diagnosed NSCLC between 2008 and 2011 were retrospectively considered. The institutional review board approved this retrospective study, and the requirement to obtain informed consent was waived. Only primary tumors with a MATV larger than 3 cm3 (which, assuming a spheric shape, corresponds to an ∼1.8-cm diameter) were included due to the inability of PET to characterize tracer distribution within smaller tumors because of its limited spatial resolution. As a result, 102 patients (79 men; mean age, 64 y) were included (Table 1). There were 49 squamous cell carcinomas and 53 adenocarcinomas.
Patient Characteristics (n = 102)
All patients underwent an 18F-FDG PET/CT scan before initiating treatment as part of the routine staging procedure within a maximum of 2 wk from diagnosis. Patients fasted for at least 6 h, and glucose levels were less than 8 mmol/L before injection of 18F-FDG (5 MBq/kg; 425 ± 95; range, 223–690), administered at 60 ± 4 min before data acquisition on a GEMINI PET/CT scanner (Philips). CT data were acquired first (120 kV and 100 mAs, no contrast enhancement). Three-dimensional PET data were subsequently acquired with 2 min per bed position, and images were reconstructed using CT-based attenuation correction and a 3-dimensional row-action maximum likelihood algorithm with a previously optimized protocol (2 iterations; relaxation parameter, 0.05; 5 mm in full width at half maximum 3-dimensional gaussian postfiltering; 4 × 4 × 4 mm voxels grid sampling) (23). SUVs were normalized using the patient body weight.
Treatment and Follow-up
Treatment consisted of surgery for 48 patients (surgery only [n = 18] or adjuvant chemotherapy [n = 20], radiochemotherapy [n = 9], or radiotherapy [n = 1] followed by surgery), whereas 54 patients did not undergo surgery (chemotherapy [n = 12] or concomitant chemoradiotherapy [n = 42]) (Supplemental Fig. 1; supplemental materials are available at http://jnm.snmjournals.org). Chemotherapy consisted of 2–6 courses (median, 4) of cisplatine–carboplatine in association with taxol, navelbine, gemcitabine, or pemetrexed. The mean total radiotherapy dose was 59.4 Gy.
Patients were followed with clinical examination and CT every 3–4 mo. Overall survival (OS) and recurrence-free survival (RFS) were defined as the time between diagnosis and death (or last follow-up) and between the end of treatment and recurrence, respectively.
Image Analysis
Only the primary tumors were analyzed. Intratumor heterogeneity was first scored by 2 observers (denoted Hvisu from here onward) and quantified through TF analysis after MATV automatic delineation.
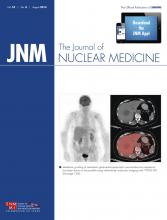
Two experienced nuclear medicine physicians were asked to review all PET images, masked to the survival information and heterogeneity quantification. The PET window settings were set to display the intratumor voxels’ values without saturation and were the same for both observers. The nuclear medicine physicians assigned to each primary tumor a score on a 3-point scale: 1 for homogeneous distribution, 2 for moderately heterogeneous, and 3 for highly heterogeneous. An alternative scale was considered by adding 2 sublevels, A for diffuse or B for focalized heterogeneity, in scores 2 and 3, hence resulting in a 5-score scale: 1, 2A, 2B, 3A, and 3B. For instance, centrally necrotic tumors were scored as 3B (Fig. 1; Supplemental Fig. 2).

Illustration of primary lung tumors with Hvisu values of 1, 2, and 3 (A, B, and C, respectively). Green contours are FLAB delineations, and examples of features are provided (values normalized between 0 and 1).
The quantitative heterogeneity analysis was performed using in-house software. MATVs were first delineated with the fuzzy locally adaptive Bayesian (FLAB) algorithm (24,25) previously validated for accuracy, robustness, and reproducibility using simulated and clinical datasets, including homogeneous and heterogeneous MATVs (26–28). FLAB was exploited in this work using 2 or 3 classes to adequately cover the entire MATV, including low-uptake regions.
Intratumor uptake heterogeneity was quantified using textural features that have been previously shown as robust considering variability in image reconstruction and acquisition protocols (20) and physiologic reproducibility based on test–retest acquisitions (22). Considered local heterogeneity parameters quantifying intensity variations between each voxel and its immediate neighbors only, averaged over the entire volume, were entropy, homogeneity, and dissimilarity. Regional heterogeneity parameters calculated through analysis at the level of groups of voxels and areas of various sizes and intensities were high-intensity emphasis (HIE), size-zone variability (SZV), and zone percentage (ZP). A 64-gray-level quantization was used, and local features were computed over 13 directions (19,22).
Other global parameters such as skewness or kurtosis were excluded considering their previously demonstrated poor robustness (20) or physiologic reproducibility (22). CHAUC and HIE were computed after edge-preserving filtering (29) and partial-volume effect correction (30) were applied, as it has been previously shown that such preprocessing is necessary for these parameters (18,21). Additional details about the FLAB automated algorithm and textural-features calculations have been added in the supplemental material sections. Finally, SUVmax, SUVmean, MATV, and TLG were also included for comparison purposes as they have been previously shown to provide prognostic value in NSCLC (5–9).
Statistical Analysis
Statistical analyses were performed using Medcalc (MedCalc Software). Interobserver agreement regarding Hvisu was estimated using the weighted κ test with linear weights. Correlation between Hvisu and quantitative features was assessed using Spearman ρ rank correlation. Variables with nonnormal distributions (e.g., MATV) were log-transformed.
Each feature’s prognostic value for OS and RFS was assessed through univariate analysis using Kaplan–Meier curves and the log-rank test, with optimal cutoff values determined through receiver-operating-characteristic analysis. Statistically significant differences were considered for P values of less than 0.05 after Bonferroni adjustment for multiple testing.
Multivariate analysis was performed with Cox regression by including clinical variables along with image-derived features as continuous variables. Because there were 62 deaths, no more than 6 uncorrelated variables were included in separate models for OS.
RESULTS
Interobserver Agreement
Figure 1 illustrates 3 tumors with Hvisu values of 1, 2, and 3. About half of the tumors were scored as highly heterogeneous. Interobserver agreement reached a moderately satisfactory level, with a weighted κ value of 0.64 (95% confidence interval [CI], 0.52–0.75), when the 3-point scale was used. The 2 observers were in agreement on the visual score for 74 of 102 tumors (73%). All discrepancies occurred between consecutive scores (1 and 2 or 2 and 3, never 1 and 3) (Supplemental Table 1). When the 5-level scale was used, interobserver agreement decreased to 0.58 (95% CI, 0.47–0.70), with the 2 observers agreeing on 62 of 102 (61%) (Supplemental Table 2). For the subsequent analysis, only the 3-point scale was considered, and only 1 value of Hvisu obtained through consensus was used.
Correlation Between Visual Scoring and Quantitative Heterogeneity
Significant correlations were observed between Hvisu and quantitative features (Fig. 2; Supplemental Table 3). The highest correlations were observed for local and regional TF, with ρ from 0.59 to 0.61 except ZP and HIE (ρ = 0.44, P < 0.0001, and ρ = 0.20, P = 0.04, respectively). CHAUC was not correlated with Hvisu (ρ = 0.07, P = 0.5), whereas SUVCOV showed a correlation similar to HIE (ρ = 0.22, P = 0.027) (Supplemental Fig. 3).
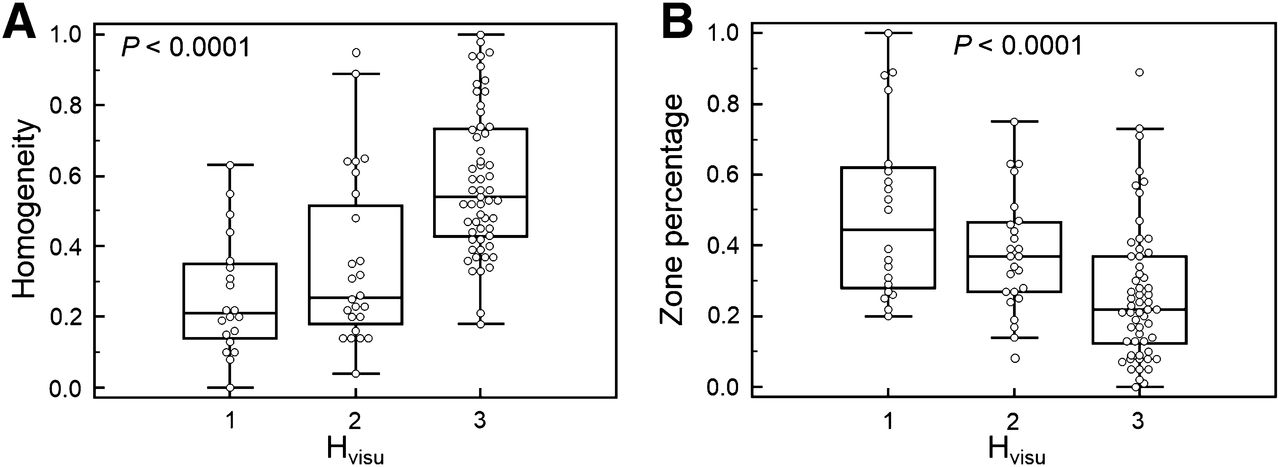
Illustration of distributions of homogeneity (A) and ZP (B) according to 3 levels of Hvisu.
SUVmax and SUVmean were not correlated with MATV (r < 0.2). On the other hand, TF showed variable levels of correlation with MATV, with an r of 0.6, −0.7, and 0.7 for entropy, dissimilarity, and homogeneity, respectively, and −0.5, −0.6, and −0.3 for SZV, ZP, and HIE, respectively. These correlations show that although heterogeneity is correlated with volume, such heterogeneity measurements could provide complementary information.
Survival Analysis
Median follow-up was 36.6 ± 11.8 mo. After surgery, 32 patients had evidence of recurrence. At the time of last follow-up, 39 patients were alive. Median OS and RFS were 18.4 (range, 1–58; 95% CI, 14.5–23.1) mo and 11.4 (range, 1–58; 95% CI, 6.8–18.4) mo, respectively.
In the univariate analysis (Table 2), surgery (P = 0.006), sex (P = 0.02), age (P = 0.03), and stage (P = 0.001) were significantly associated with OS, as well as standard SUV or volume parameters (P from 0.009 for SUVmax to < 0.0001 for MATV). For instance, patients with a MATV greater than 35 cm3 had a median survival of 10 mo versus 49 mo for those with a MATV of 35 cm3 or less. Patients who underwent surgery survived almost twice as long (median survival, 28 mo) as those who did not (median survival, 15 mo).
OS Analysis (n = 102)
Higher visual heterogeneity (Hvisu = 3) was associated with poorer OS, although the trend was not statistically significant. Patients with an Hvisu of 3 had a median survival of 17 mo, whereas those with an Hvisu less than 3 had a median survival of 20 mo. Higher heterogeneity assessed by TF was associated with poorer OS (P ≤ 0.007 for local TF and <0.0001 for regional TF, except HIE). For example, entropy greater than 0.75 was associated with a median survival of 11 mo versus 49 mo for those with entropy of 0.75 or less. SUVCOV and CHUAUC were not associated with OS (P = 0.4 and 0.9, respectively). Figure 3 provides examples of Kaplan–Meier curves for the different parameters considered.
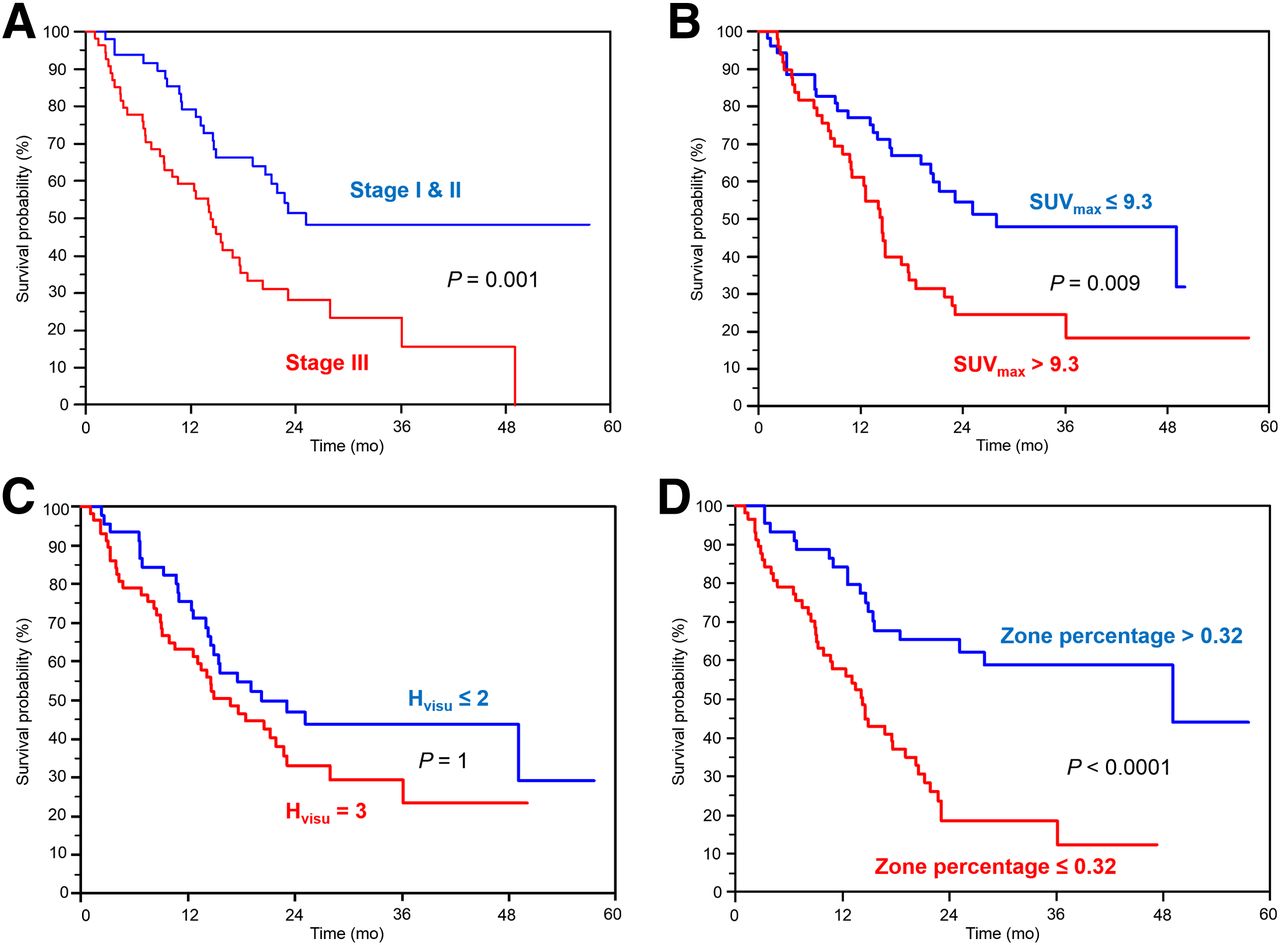
Examples of survival curves for OS (n = 102) according to stage (A), SUVmax (B), Hvisu (C), and ZP (D).
In the multivariate Cox models that included surgery, sex, stage, SUVmax (or SUVmean), and either MATV, TLG, or 1 heterogeneity parameter (since these latter are correlated with each other), stage remained an independent prognostic factor but not surgery, sex, and SUVmax (or SUVmean). MATV, as well as all heterogeneity quantification parameters obtained through TF, except HIE, remained independent prognostic factors with respect to stage (although not independent of each other).
The addition of risk factors allowed a better differentiation of patients’ outcome. Patients with a large MATV combined with high local and regional tracer heterogeneity had a median survival of 9 mo and a 3-y survival rate of 0%, whereas the other group had a median survival of 49 mo and a 3-y survival rate of 50% (Fig. 4). The complementary value of TF heterogeneity to MATV can be shown by comparing the finer stratification of patients into 4 groups with statistically different outcomes (Fig. 5). MATV combined with entropy (Fig. 5B) led to different survival curves, compared with the use of MATV alone (Fig. 5A). MATVs greater than 50 cm3 were associated with longer survival than MATVs between 35 and 50 cm3. However, among volumes above 35 cm3, those with entropy greater than 0.95 had significantly shorter survival (Fig. 5B).
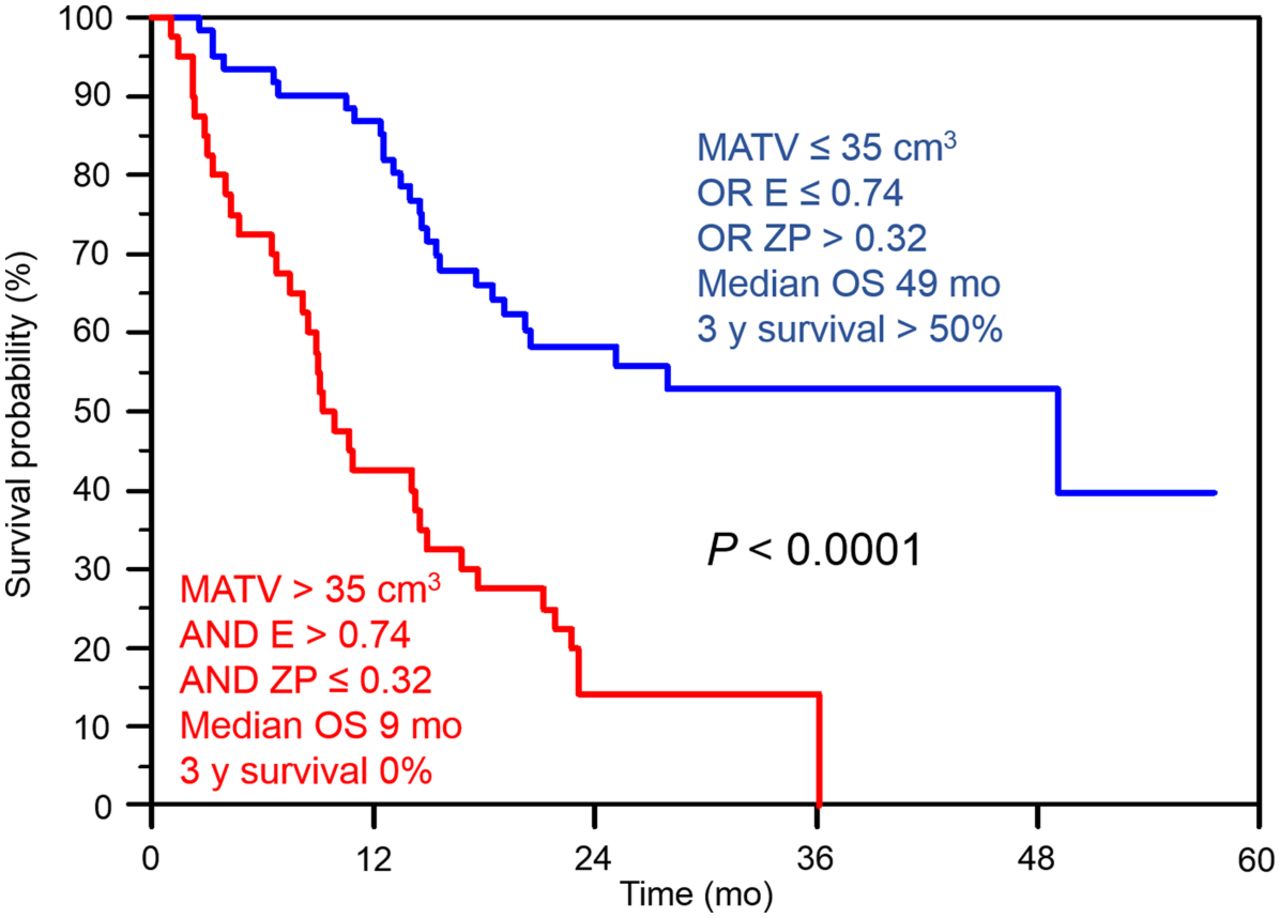
Survival curves for OS (n = 102) with stratification obtained according to combination of MATV, entropy, and ZP.
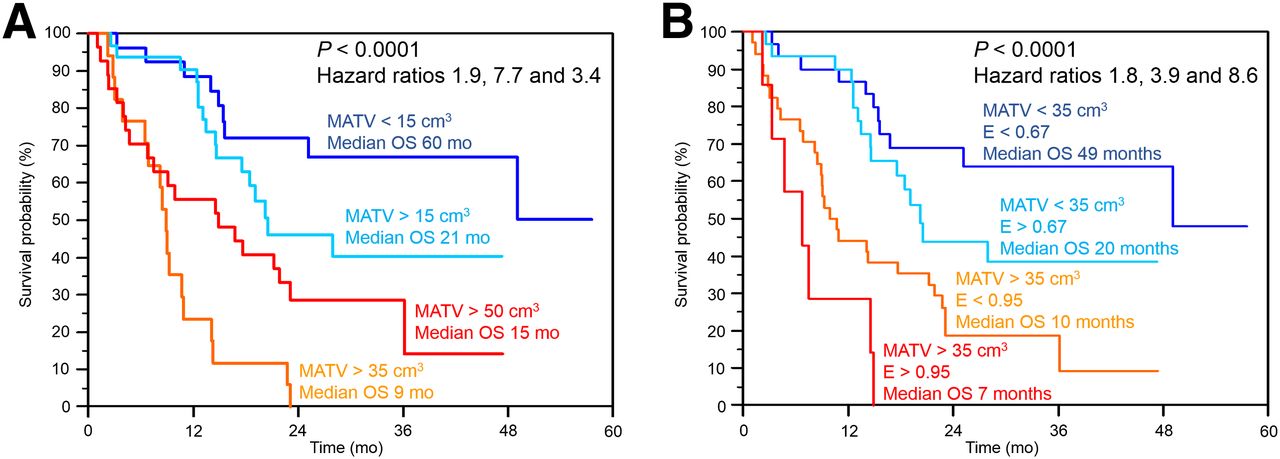
Differentiation of 4 different OS groups using MATV alone (A) or MATV (B) and substratification with entropy.
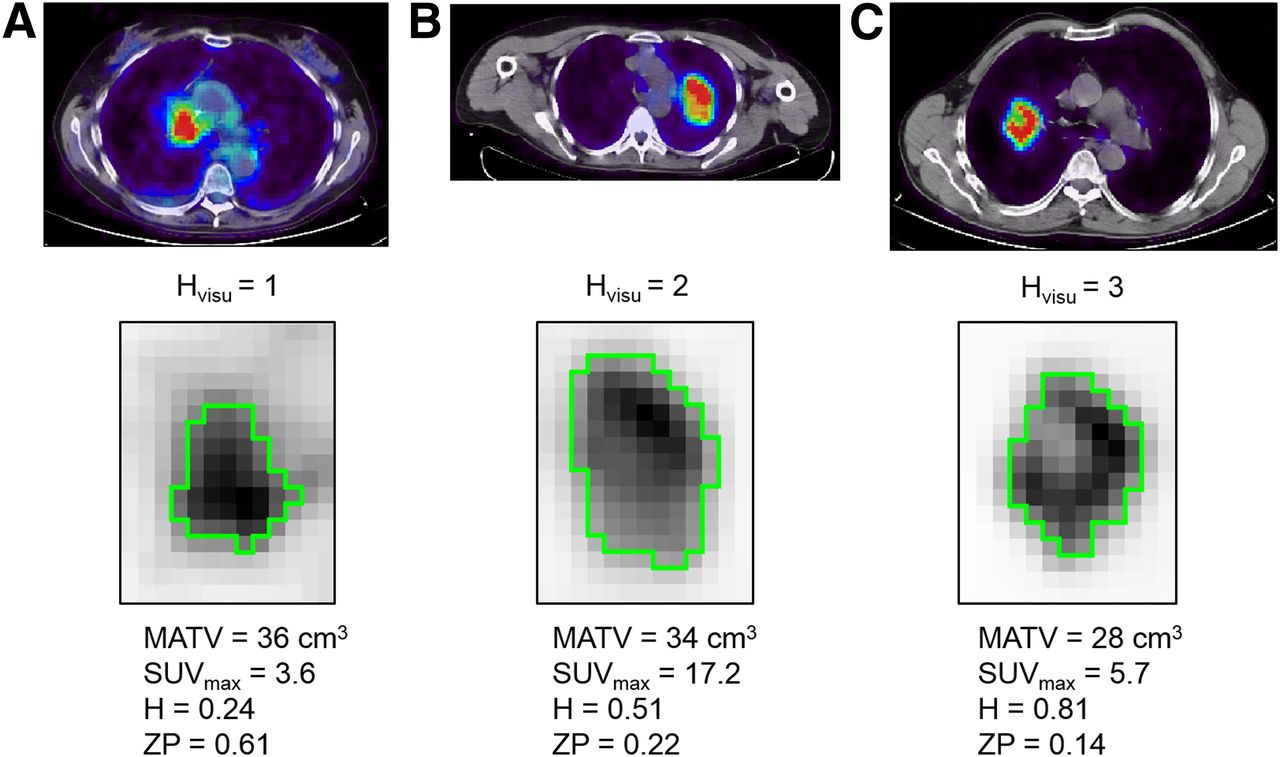
Concerning RFS, none of the patients treated with chemoradiotherapy achieved complete response; therefore, only patients who underwent surgery were included (Table 3). None of the clinical variables were associated with RFS. MATV (P = 0.001) and TLG (P = 0.03) were significant prognostic factors of RFS, in contrast to SUV measurements. An Hvisu of 3 was associated with a median RFS of 7 mo whereas median RFS was 25 mo for those with an Hvisu of less than 3, although this trend was not statistically significant (P = 0.3). Higher TF-based heterogeneity was significantly associated with poorer RFS (P ≤ 0.004), except when using HIE. For example, patients with dissimilarity greater than 0.57 had a median RFS of 6 mo versus 25 mo for those with dissimilarity of 0.57 or less. No multivariate analysis was performed for RFS because of the lack of uncorrelated variables statistically significant in the univariate analysis. Figure 6 provides examples of corresponding Kaplan–Meier curves.
RFS Analysis (n = 48)

Examples of survival curves for RFS (n = 48) according to Hvisu (A) and dissimilarity (B).
DISCUSSION
There is currently an increasing interest in the use of PET image–derived features allowing the quantification of intratumor heterogeneity (11,12). Visual assessment may be considered as a simple and valuable way of scoring intratumor tracer distribution. In the present study, visual/qualitative and quantitative assessment of heterogeneity were simultaneously considered in the same NSCLC patient cohort and compared in terms of prognostic value.
First, our results suggest that quantitative parameters obtained through TF analysis are correlated with the visual assessment by nuclear medicine physicians. Our study also demonstrated an added value for TF analysis over visual assessment. The first advantage is that, because MATV and heterogeneity determination is fully automatic, the only inter- or intraobserver variability that might occur lies in the tumor location identification. Automated characterization is therefore likely to reduce interobserver variability associated with visual assessment, which as shown in this study was an issue for 27% of the cases. This was even worse when a larger visual scoring scale was considered, with a substantial decrease of interobserver agreement from 0.64 to 0.58 (from 73% to 61% of the 102 tumors). As a result, this finer scale was not further exploited, clearly demonstrating the difficulty in a fine visual characterization of intratumor tracer distribution.
A study comparing visual heterogeneity scoring, SUVCOV, and CHAUC found high correlations (0.72 and 0.87 for SUVCOV and CHAUC, respectively) (31). In our study, lower correlations were found between Hvisu and TF, whereas SUVCOV and CHAUC were not correlated with Hvisu. Several factors may explain this difference. This previous study included only 9 gastrointestinal stromal tumors (GIST) and 12 malignant lymphomas (ML), manually delineated within a single 2-dimensional slice. A 4-value scale was used for visual scoring, and interobserver variability was not reported. The authors did not take into account the difference in volumes between GIST and ML. These volumes were also much larger (119 ± 102 cm3) than in our study (48 ± 58 cm3), suggesting that CHAUC and SUVCOV might be appropriate to characterize high heterogeneity levels as found in large GIST and ML lesions but may not be sufficient to quantify finer heterogeneity differences found in smaller NSCLC tumors. This is also supported by the distributions of CHAUC values, with a small range (SD = 0.05) in our study (0.32 ± 0.05), compared with those found in Watabe et al. (0.41 ± 0.14 for GIST and 0.64 ± 0.08 for ML) (31). Finally, FLAB delineation excluded areas with uptake similar to the background or lower, contrary to manual delineation, as in Watabe et al. However, only 4 cases presented areas with uptake low enough to be excluded and already presented large volumes and high heterogeneity. It is thus unlikely that the exclusion of the low-uptake region in these 4 cases might have had an impact on either the survival analysis or the correlation between Hvisu and CHAUC.
The second advantage of TF analysis is that it leads to additional prognostic value that may be useful for patient management. A stronger differentiation between groups of patients with different outcome was highlighted by combining parameters, although the parameters correlated with each other. As an example, patients with an MATV greater than 35 cm3 combined with entropy greater than 0.74 and ZP of 0.32 or less had a median survival of 9 mo and a 3-y survival of 0%, whereas the others had a median survival of 60 mo and a 3-y survival of 50% (Fig. 4). As shown in Figure 5, despite the correlation between TF parameters and MATV, patient outcome could not be fully described using the MATV alone (Fig. 5A). This is illustrated in Figure 5B, showing that smaller but more heterogeneous lesions were associated with poorer OS than larger and more homogeneous ones.
A recent study suggested that entropy is unable to predict tracer uptake heterogeneity for tumors with a MATV less than 45 cm3 (32). In our cohort, volumes were 48 ± 58 cm3 (range, 3–415; median, 34). Our results only partly confirm this, because entropy provided additional information with respect to MATV in larger volumes (Fig. 5). MATV between 30 and 45 cm3 exhibited an entropy between 0.55 and 0.81 (Supplemental Fig. 4A), with a weak correlation for r of 0.57. For tumors with volumes less than 30 cm3, this correlation was equal to 0.95, suggesting that for a MATV less than 30 cm3 the information provided by entropy was indeed similar to that of volume. Finally, the proposed threshold value of 45 cm3 may not be applicable for other heterogeneity measurements, because in our study different values of homogeneity or ZP were observed for similar volumes down to the lower limit of 3 cm3 (Supplemental Figs. 4B and 4C).
Regarding the prognostic value of PET parameters in NSCLC, including SUV, MATV, and derived TLG (5–9) and TF (15), our findings are in line with previous results. The only study that investigated the prognostic value of 18F-FDG PET heterogeneity in NSCLC was conducted on 53 patients with stage 3 and above, exclusively treated with combined chemoradiotherapy (nonsurgical patients) (15). Their results regarding MATV and TLG, showing no significant association with outcome, might be confounded by the fact that all their patients were stage 3 and 4 combined with a fixed-thresholding delineation approach. However, considering tracer distribution they found that heterogeneity quantified through busyness, coarseness, contrast, and complexity was significantly associated with RFS and OS. None of these parameters were included in our study because we have previously demonstrated their lower reproducibility (22). However, although our parameters were different and extracted from MATVs delineated using a more robust segmentation method, we also found that intratumor 18F-FDG heterogeneity was significantly associated with outcome independently of sex, age, stage, and surgery. These results strengthen the assumption that higher intratumor activity distribution heterogeneity is associated with more complex vascularization and proliferation, properties that are currently not considered by standard treatments. Because higher heterogeneity was also a prognostic factor for the surgical group, heterogeneity may be also considered in identifying tumors with higher global aggressiveness.
Our study is limited by its retrospective nature, and the proposed automated quantification should be tested prospectively in a larger patient population. It included a mixture of different treatments (with or without surgery, radiotherapy, chemotherapy), leading to a heterogeneous cohort. However, the relatively large number of patients and events allowed taking into account surgery in the survival analysis. The large number of squamous cell carcinomas in our cohort was due to the exclusion of metastatic disease (mostly adenocarcinomas), because related patient management and prognosis differ greatly. We considered it more interesting to assess new parameters to refine patient stratification beyond the well-established TNM classification. A last limitation of our study is that we focused on the primary tumor. Including lymph nodes in the analysis could be of importance because of their impact on prognosis (33) but was outside the scope of the present study focusing on tracer distribution heterogeneity, which is meaningless to assess on small structures such as lymph nodes, considering the limited spatial resolution in PET imaging. The main objective of this study was to determine whether automated quantification through TF analysis could relate to visual assessment of PET images, and primary tumor analysis was sufficient within this context.
CONCLUSION
Automated quantification of intratumor 18F-FDG uptake heterogeneity in NSCLC through textural-features analysis provides parameters that are correlated with visual analysis by experts. Nevertheless, our results also highlight several advantages of using automated quantification, including objective heterogeneity evaluation with reduced interobserver variability, and more clinically pertinent stratification through independent prognostic factors in NSCLC.
DISCLOSURE
The costs of publication of this article were defrayed in part by the payment of page charges. Therefore, and solely to indicate this fact, this article is hereby marked “advertisement” in accordance with 18 USC section 1734. No potential conflict of interest relevant to this article was reported.
Footnotes
Published online Jun. 5, 2014.
- © 2014 by the Society of Nuclear Medicine and Molecular Imaging, Inc.
REFERENCES
- Received for publication December 5, 2013.
- Accepted for publication March 25, 2014.


Jump to section
Related Articles
Cited By...
- Heterogeneity in Metastatic Breast Cancer 18F-Fluoroestradiol Uptake: Clinically Actionable, Biologically Illuminating?
- Understanding Changes in Tumor Texture Indices in PET: A Comparison Between Visual Assessment and Index Values in Simulated and Patient Data
- Radiomics in PET/CT: More Than Meets the Eye?
- The Impact of Optimal Respiratory Gating and Image Noise on Evaluation of Intratumor Heterogeneity on 18F-FDG PET Imaging of Lung Cancer
- Comparison of Tumor Uptake Heterogeneity Characterization Between Static and Parametric 18F-FDG PET Images in Non-Small Cell Lung Cancer
- Pretreatment 18F-FDG PET Textural Features in Locally Advanced Non-Small Cell Lung Cancer: Secondary Analysis of ACRIN 6668/RTOG 0235
- Primary tumour standardised uptake value is prognostic in nonsmall cell lung cancer: a multivariate pooled analysis of individual data
- Impact of Image Reconstruction Settings on Texture Features in 18F-FDG PET