


Abstract
The κ-opioid receptors (KORs) are implicated in several neuropsychiatric diseases and addictive disorders. PET with radioligands provides a means to image the KOR in vivo and investigate its function in health and disease. The purpose of this study was to develop the selective KOR antagonist 11C-LY2459989 as a PET radioligand and characterize its imaging performance in nonhuman primates. Methods: LY2459989 was synthesized and assayed for in vitro binding to opioid receptors. Ex vivo studies in rodents were conducted to assess its potential as a tracer candidate. 11C-LY2459989 was synthesized by reaction of its iodophenyl precursor with 11C-cyanide, followed by partial hydrolysis of the resulting 11C-cyanophenyl intermediate. Imaging experiments with 11C-LY2459989 were performed in rhesus monkeys with arterial input function measurement. Imaging data were analyzed with kinetic models to derive in vivo binding parameters. Results: LY2459989 is a full antagonist with high binding affinity and selectivity for KOR (0.18, 7.68, and 91.3 nM, respectively, for κ, μ, and δ receptors). Ex vivo studies in rats indicated LY2459989 as an appropriate tracer candidate with high specific binding signals and confirmed its KOR binding selectivity in vivo. 11C-LY2459989 was synthesized in high radiochemical purity and good specific activity. In rhesus monkeys, 11C-LY2459989 displayed a fast rate of peripheral metabolism. Similarly, 11C-LY2459989 displayed fast uptake kinetics in the brain and an uptake pattern consistent with the distribution of KOR in primates. Pretreatment with naloxone (1 mg/kg, intravenously) resulted in a uniform distribution of radioactivity in the brain. Further, specific binding of 11C-LY2459989 was dose-dependently reduced by the selective KOR antagonist LY2456302 and the unlabeled LY2459989. Regional binding potential values derived from the multilinear analysis-1 (MA1) method, as a measure of in vivo specific binding signal, were 2.18, 1.39, 1.08, 1.04, 1.03, 0.59, 0.51, and 0.50, respectively, for the globus pallidus, cingulate cortex, insula, caudate, putamen, frontal cortex, temporal cortex, and thalamus. Conclusion: The novel PET radioligand 11C-LY2459989 displayed favorable pharmacokinetic properties, a specific and KOR-selective binding profile, and high specific binding signals in vivo, thus making it a promising PET imaging agent for KOR.
The opioid receptors (ORs) are G-protein–coupled receptors with at least 3 subtypes: μ, κ, and δ (1). The ORs share extensive homology but differ in their pharmacology and physiologic effects (2). The presence of κ-opioid receptors (KORs) is widespread in the human brain and is found in greater density than the μ-opioid receptor (MOR) in most brain regions (3–5). KORs are present in the deep layers of cortical regions and in the striatum, hippocampus, amygdala, and thalamus (3,5,6). A similar distribution of KORs is seen in the nonhuman primate brain (7,8).
KORs are implicated in the pathophysiology of a variety of neuropsychiatric diseases and addictive disorders (9). For example, multiple lines of evidence point to the involvement of KORs in depression and related mood disorders (10–16). In turn, these findings raise the possibility that KOR antagonists might be efficacious antidepressants. As such, KORs are a target for development of newer antidepressants. In addition, the role of the opioid system in alcohol addiction and treatment is well established, as the nonselective opioid antagonist naltrexone is effective in the prevention of relapse in some alcoholics (17). There is also a large body of literature indicating that the opioid system, especially the KOR, is critically involved in the biology of addiction to psychostimulants, and thus pharmacologic intervention at the KOR/dynorphin system may be an effective avenue for treatment of drug and alcohol abuse (18).
Because KORs are involved in several psychiatric diseases and addictive disorders, the successful deployment of a PET imaging agent for use in humans will allow the noninvasive investigation of the KOR in vivo and lead to new understandings of its function and dysfunction/dysregulation in these disorders. It will also make it possible to correlate and translate preclinical findings in animal models to humans and help in the development of novel therapeutic agents by correlating dose, pharmacokinetic parameters, and receptor occupancy.
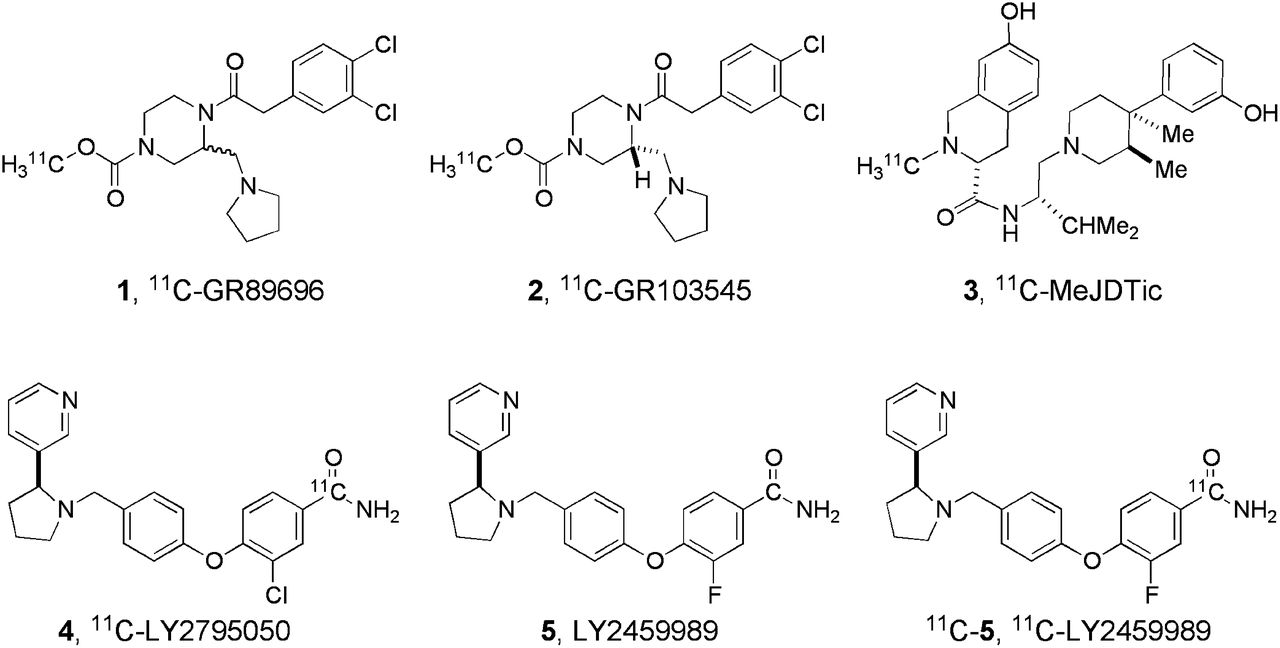
Several radiotracers are currently available for imaging the ORs in humans. They include 11C-carfentanil, 11C-/18F-diprenorphine, 11C-buprenorphine, 11C-cyclofoxy, and 11C-methylnaltrindole (19,20). None of these ligands can be used to selectively image KOR in vivo. Over the years, many groups have attempted to develop KOR-selective PET radioligands, such as the agonist ligands 11C-GR89696 and 11C-GR103545 and the antagonist ligand 11C-MeJDTic (Fig. 1) (21–24). However, only 11C-GR103545 has been evaluated extensively in nonhuman primates and recently in humans in our laboratory (25–28). We previously reported the synthesis of 11C-LY2795050 as the first-ever selective antagonist radioligand able to image the KOR in nonhuman primates and humans (29). In this paper, we report the discovery and characterization of 11C-LY2459989 (11C-5, Fig. 1) as a KOR-selective radioligand with improved imaging characteristics over 11C-LY2795050.

Structures of selected KOR ligands.
MATERIALS AND METHODS
Chemistry
Synthesis of LY2459989 and the radiolabeling precursor for 11C-LY2459989 is described in the supplemental materials (available at http://jnm.snmjournals.org).
In Vitro Binding Assays
In vitro binding experiments and GTP-γ-S antagonist functional assays were performed according to the published procedures (30).
Ex Vivo Experiments in Rodents: Tracer Distribution and Receptor Occupancy Studies
Male Sprague–Dawley rats (225–300 g; Harlan Laboratories) were group-housed with ad libitum food and water and maintained on a 12-h light–dark cycle. All experiments were conducted under protocols approved by the Institutional Animal Care and Use Committee of Eli Lilly & Co.
LY2459989 was dissolved in 25% 3-hydroxypropyl-β-cyclodextrin at a concentration of 6 μg/mL and administered intravenously via the lateral tail at a dose of 3 μg/kg to groups of rats (4 rats in each group) in a volume of 0.5 mL/kg. Animals were sacrificed at 5, 20, 40, or 60 min after LY2459989 injection. The striatum and cerebellum were dissected, weighed, and positioned in conical centrifuge tubes placed on ice. Four volumes (w/v) of acetonitrile containing 0.1% formic acid were added to each tube. These samples were then homogenized using an ultrasonic probe (7–8 watts power using a sonic probe dismembrator; Fisher Scientific) and centrifuged at 14,000 rpm for 16 min. The supernatant was separated and diluted 1:4 with sterile water in high-performance liquid chromatography (HPLC) injection vials for LC/MS/MS analysis using a model 1200 HPLC (Agilent Technologies) system and an API 4000 mass spectrometer (Applied Biosystems). The chromatographic separation used a Zorbax Eclipse XDB-C18 column (2.1 × 50 mm, 3.5 μm; Agilent) and a mobile phase gradient of acetonitrile (A) and water (B), each containing 0.1% formic acid over 5 min (5% A for 1 min, then increasing to 95% A from 1 to 2 min and holding from 2 to 3 min, decreasing to 5% A at 3.1 min and holding until 5 min), at a flow rate of 0.25 mL/min. Detection of LY2459989 was accomplished by monitoring the precursor to product ion transition with a mass-to-charge ratio (m/z) of 392.301 to 244. Standards were prepared by adding known quantities of LY2459989 to brain tissue samples from nontreated rats and processed as described above. Concentrations of LY2459989 in the striatum were presumed to represent total binding, whereas levels in the cerebellum represented nonspecific binding because this is a region with little or no expression of ORs (31). The concentration ratio between striatum and cerebellum is presented as a measure of specific binding.
Occupancies of LY2459989 at KOR, MOR, and DOR were determined using an in vivo rat model of central receptor occupancy and the procedures described previously, with GR103545, naltrexone, and naltriben as in vivo tracers for KOR, MOR, and DOR, respectively (32). They were injected intravenously 1 h after oral administration of vehicle or LY2459989 (0.01, 0.03. 0.1, 0.3, 1, 3, 10, or 30 mg/kg). Animals were sacrificed by cervical dislocation 30 min after tracer administration. Tracer analysis was performed using a model 6460 MS/MS system equipped with a 1260 HPLC system (Agilent Technologies). The chromatographic separation was performed with a Zorbax SB-C18 column (2.1 × 50 mm, 1.8 μm; Agilent) and gradient of components A (0.1% formic acid in acetonitrile) and B (0.1% formic acid in water) over 3.5 min (5% A for 1 min, then increasing to 90% A from 1 to 1.75 min and holding from 1.75 to 2 min, decreasing to 5% A at 2.1 min and holding until 3.5 min) at a flow rate of 0.40 mL/min. The detection of tracers was accomplished by monitoring ion transitions 414.1/343.0, 342.2/270.2, and 416.0/301.1 mass-to-charge ratio for GR103545, naltrexone, and naltriben, respectively.
Radiochemistry
Instruments used were as follows: a preparative HPLC system including a Shimadzu LC-20A pump, a Rheodyne 7133i injector with a 2-mL loop, a Knauer K200 ultraviolet detector, a Bioscan γ-flow detector, and a laptop computer running the EZStart data acquisition software and an analytic HPLC system consisting of a Shimadzu LC-20A quarternary pump, a Rheodyne 7133i injector, a Shimadzu SPD-M20A PDA or SPD-20A ultraviolet detector, a flow cell γ detector (Bioscan), and a PC with Shimadzu Class VP 7.2 software used for system control. Chiral HPLC analysis was performed with a Chiralpak AS-H column (4.6 × 150 mm) eluting with 0.2% triethylamine in MeOH at a flow rate of 0.6 mL/min.
The production of 11C-CO2 was started with the 14N(p,α)11C nuclear reaction by bombardment of a mixture of nitrogen and oxygen (0.5%–1%) with a proton beam. In a high-pressure target in a PETtrace cyclotron (GE Healthcare). The cyclotron-produced 11C-CO2 was transferred into a ProCab (GE Healthcare) and reacted with hydrogen at 400°C under a nickel catalyst to afford 11C-methane, which was converted to 11C-cyanide by reaction with ammonia over a platinum catalyst at 950°C. Radiolabeling was performed by trapping 11C-cyanide in a solution of precursor 6 (1–3 mg) (Fig. 2), K2HCO3, Pd2dba3, and dppf in DMF (0.3 mL) at room temperature. Reaction at 80°C for 5 min produced the intermediate 11C-7, which was then treated with NaOH (1 N, 0.2 mL) and H2O2 (0.2 mL) at 80°C for 5 min to afford 11C-LY2459989 (11C-5) (Fig. 2).
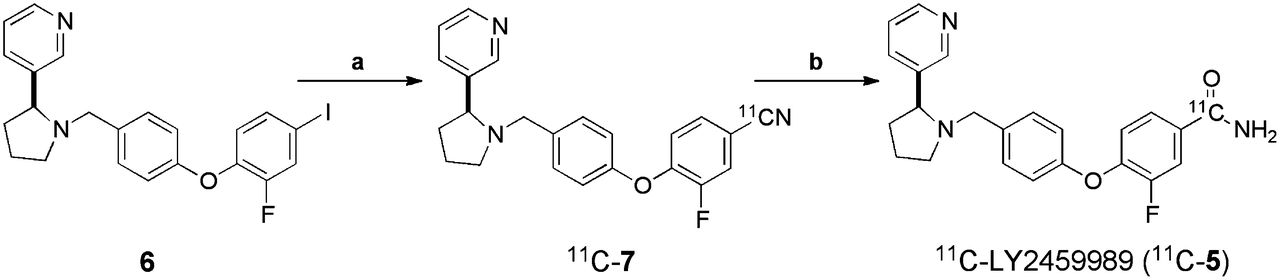
Radiosynthesis of 11C-LY2459989. Reagents and conditions: a. H11CN, KHCO3, Pd2(dba)3, dppf, DMF, 80°C, 5 min; b. NaOH, H2O2, 80°C, 5 min.
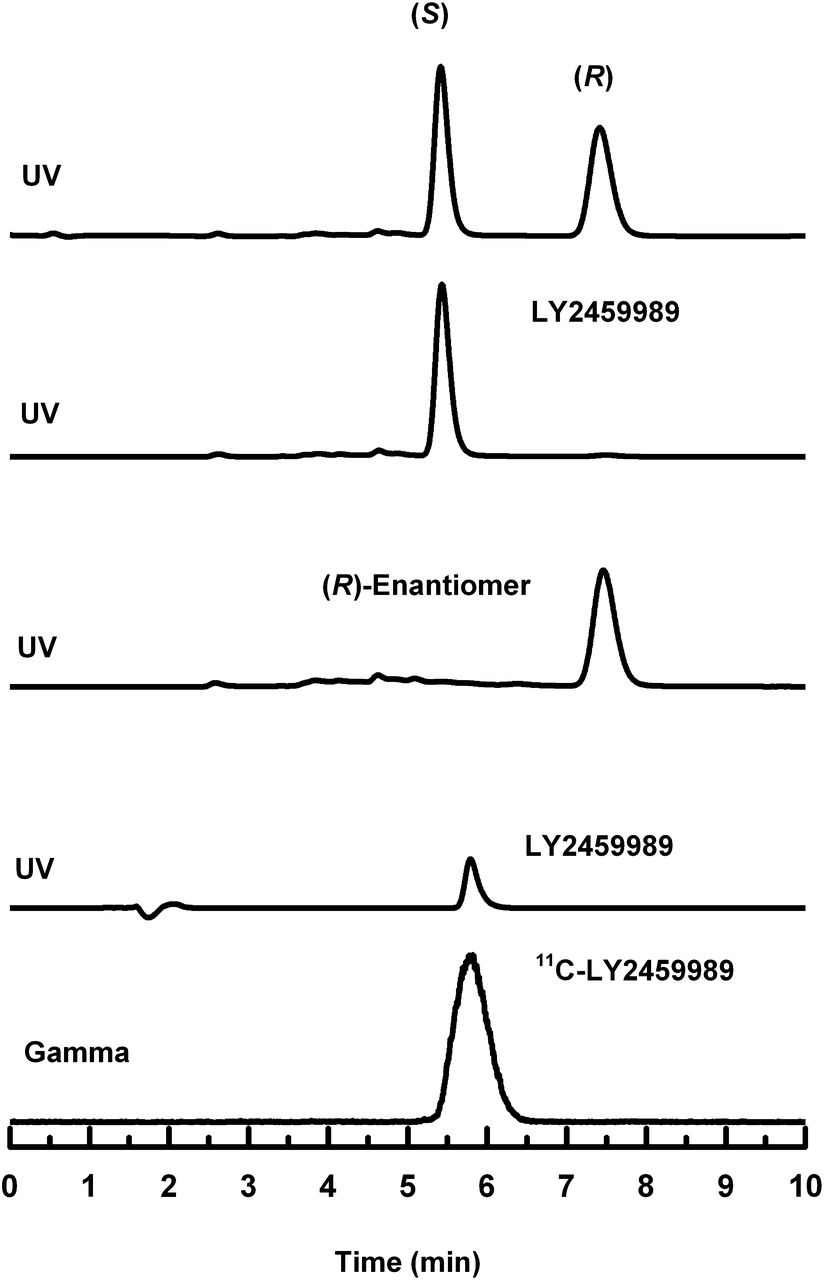
Purification was achieved by preparative HPLC using a Genesis C18 column (10 × 250 mm, 4 μm). The column was eluted with 22% acetonitrile and 78% 0.1 M aqueous ammonium formate solution with 0.5% acetic acid (v/v, pH 4.2), at a flow rate of 5 mL/min. The desired product fraction (eluting at 11–13 min) was collected, diluted with water (50 mL), and passed through a Waters C-18 SepPak cartridge. The cartridge was rinsed with 10 mL of 0.01 N HCl solution. The radioactive product was recovered by eluting the SepPak with 1 mL of United States Pharmacopeia (USP) absolute ethanol, followed by 3 mL of USP saline, into a product vial containing 7 mL of USP saline and 40 μL of 4.2% USP sodium bicarbonate solution. This mixture was then passed through a sterile membrane filter (0.22 μm) for terminal sterilization and collected in an empty sterile vial to afford a formulated solution ready for intravenous administration. The chemical purity, radiochemical purity, and specific activity of 11C-LY2459989 were determined by HPLC analysis of the final product solution (column: Genesis C18, 4.6 × 250 mm, 4 μm; mobile phase: 22% acetonitrile and 78% 0.1 M aqueous ammonium formate with 0.5% acetic acid [v/v, pH 4.2]; flow rate: 2 mL/min; ultraviolet detector wavelength: 254 nm). The identity of the labeled compound was confirmed by coinjection of the product with the unlabeled LY2459989. Radiolabeled product and LY2459989 coeluted on the analytic HPLC (retention time for the product, ∼6.3 min).
PET Imaging Experiments in Rhesus Monkeys
PET Procedures
Experiments were performed in rhesus monkeys (Macaca mulatta) according to a protocol approved by the Yale University Institutional Animal Care and Use Committee and procedures as described previously (33).
Three animals were used in this study. In the first set of experiments, a control scan with 11C-LY2459989 alone was followed by a blocking scan with intravenous injection of naloxone (1 mg/kg) at 10 min before the second injection of 11C-LY2459989. In the second set of experiments, a 11C-LY2459989 baseline scan was followed by a blocking scan either with LY2456302 (29,30) or with unlabeled LY2459989. Twelve PET scans were obtained.
Metabolite Analysis and Arterial Input Function Measurement
Procedures for measurement of the input function have previously been described (29). Arterial samples were collected at preselected time points to measure radioactivity concentrations in plasma and whole blood. Six samples, collected at 2, 5, 15, 30, 60, and 90 min were also processed and analyzed by HPLC to determine the fraction of unmetabolized tracer over time using a column-switching method (34). Procedures for sample preparation, HPLC analysis, and data processing were the same as those previously reported for 11C-LY2795050 (29). The procedure for plasma-free fraction measurement was also the same.
Image Analysis and Kinetic Modeling
The procedures for PET image reconstruction and definition of regions of interest (ROIs) were the same as described previously (29). For each scan, radiotracer concentrations over time were measured in 15 ROIs.
Total distribution volume (VT, mL⋅cm−3) was derived by kinetic analysis of the regional time–activity curves, using the metabolite-corrected arterial plasma concentration as the input function, according to a 1-tissue (1T) or 2-tissue (2T)-compartment model as well as the multilinear analysis-1 (MA1) method (35,36). Kinetic parameters (K1 and k2 for the 1T model; K1–k4 for the 2T model) were derived first. In the 1T model, K1 (mL⋅min−1⋅cm−3) and k2 (min−1) are the rate constants governing the transfer of the ligand into and out of the brain, respectively. In the 2T model, K1 and k2 are the rate constants governing the transfer of the ligand into and out of the nondisplaceable compartment, whereas k3 (min−1) and k4 (min−1) describe the respective rates of association to and dissociation from the receptors (36). The values of VT were calculated from the kinetic parameters as K1/k2 in the 1T model and as (K1/k2) × (1 + k3/k4) in the 2T model (36). The Akaike information criterion (AIC) was used to evaluate the optimal model for regional VT estimates.
Cerebellar VT (VT CER) was used as an estimate of the nondisplaceable distribution volume to calculate the regional nondisplaceable binding potential (BPND) as BPND = (VT ROI – VT CER)/VT CER (36).
KOR occupancies by naloxone, LY2456302, or LY2459989 were calculated using VT values from all 15 ROIs to create occupancy plots according to the method of Cunningham et al. (37).
RESULTS
Chemistry
Both LY2459989 (5, Fig. 1) and its less-active (R)-enantiomer were synthesized in greater than 98% enantiomeric purity. The radiolabeling precursor (6, Fig. 2) was also prepared in greater than 99% chemical purity and greater than 99% enantiomeric purity. Detailed synthetic procedures are described in the supplemental material.
In Vitro Binding Assays and Ex Vivo Evaluation in Rats
LY2459989 displayed high KOR affinity (Ki = 0.18 nM) and more than 43-fold selectivity for KOR over other ORs (Ki = 7.68 nM for MOR and 91.3 nM for DOR) (supplemental materials).
The potential of LY2459989 as a tracer candidate was assessed in rats using an intravenous dose of 3 μg/kg and analysis of tissue concentrations by the LC/MS/MS method (38). A rapid initial brain uptake was seen at 5 min after injection. Ligand concentration was higher in the striatum than cerebellum at all time points (Fig. 3A). The striatum–to–cerebellum concentration ratio, as a measure of specific binding, was 2.9, 4.1, and 4.0, respectively, at 20, 40, and 60 min after injection.
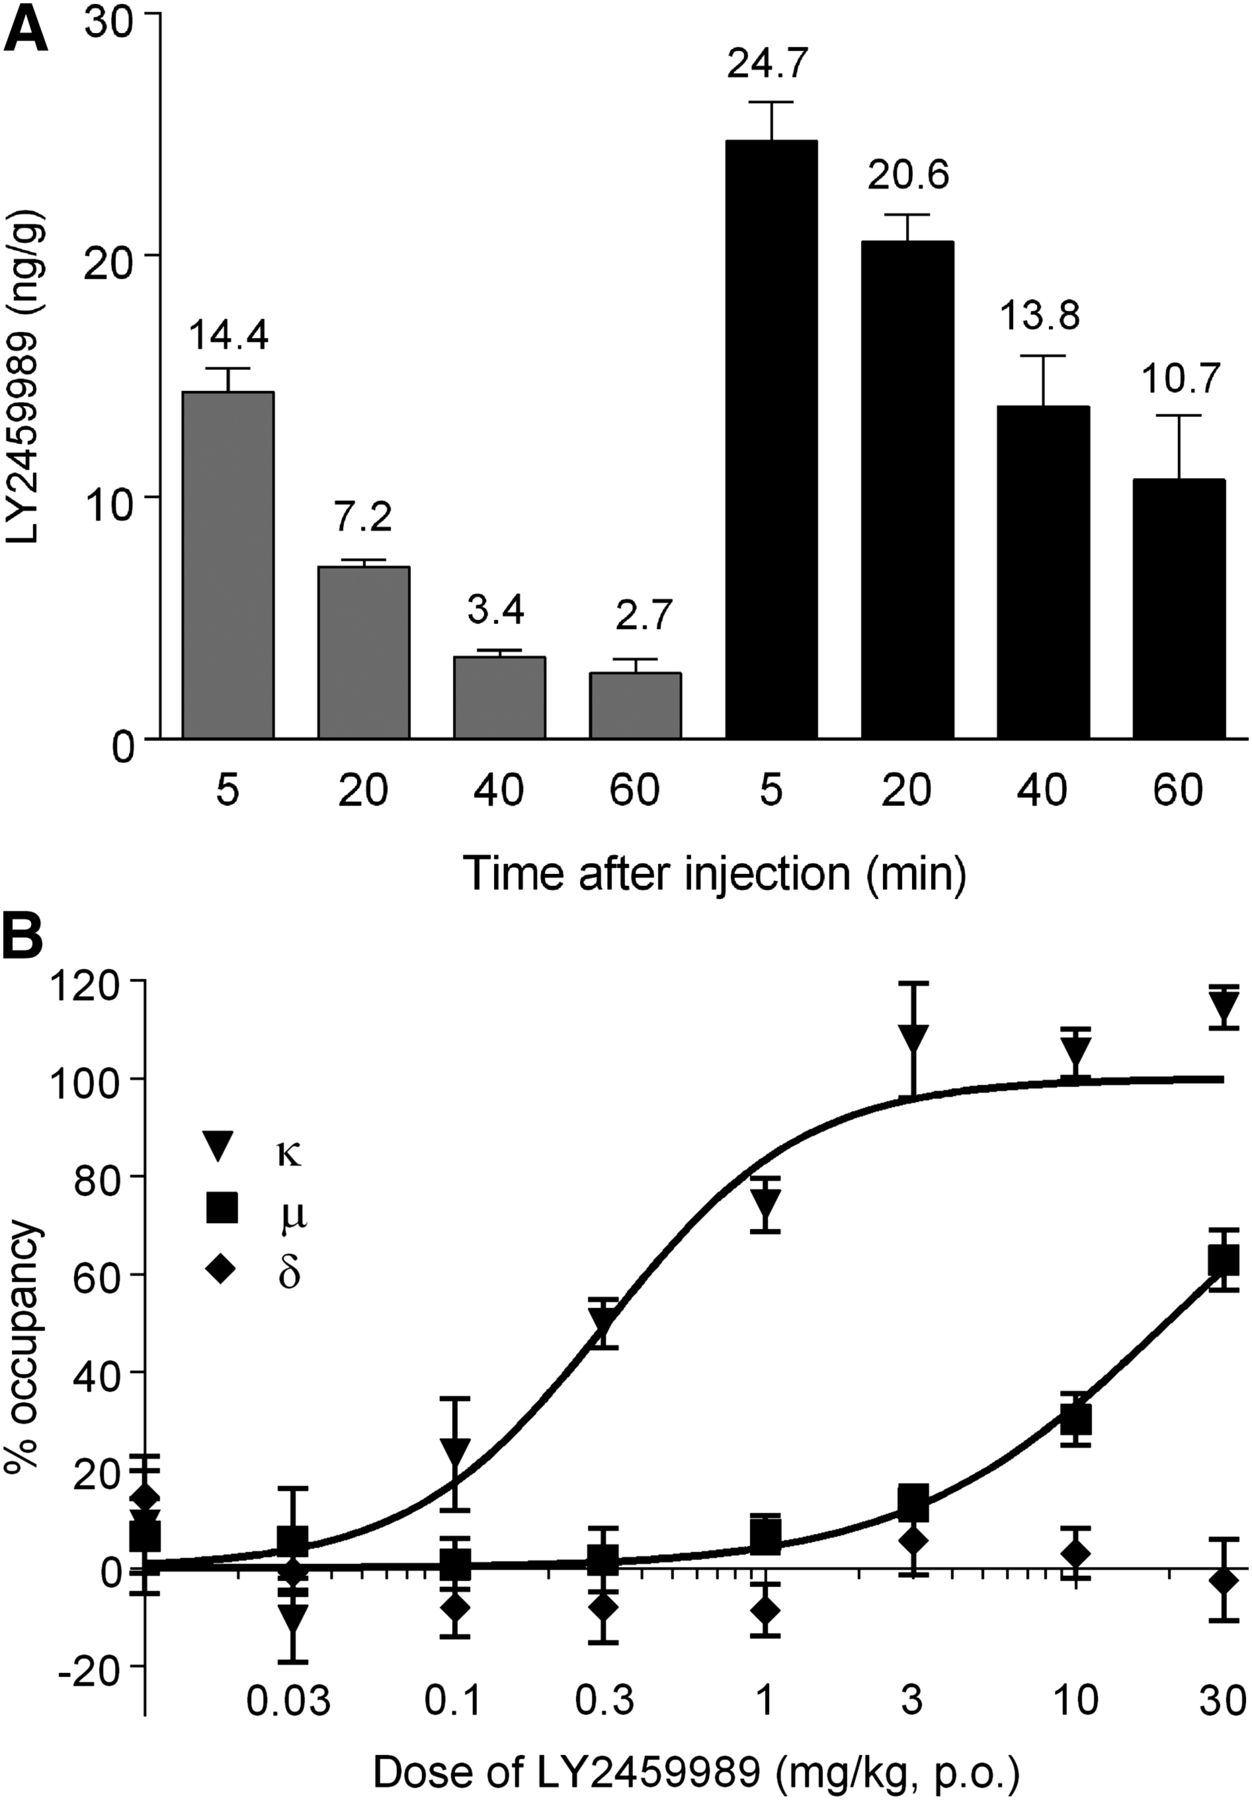
(A) Ligand concentrations (ng/g of brain tissue) in cerebellum (gray bar) and striatum (black bar) of Sprague–Dawley rats at 5, 20, 40, and 60 min (n = 4 rats per time point) after intravenous administration of LY2459989 (3 μg/g). (B) Dose–receptor occupancy relationship of LY2459989 at KOR, MOR, and DOR. p.o. = oral administration.
In vivo binding at KOR, MOR, and DOR was also assessed with LC/MS/MS after oral administration of ascending doses of LY2459989 using the triple-tracer method (32). Dose-dependent blockade of KOR and MOR binding by LY2459989 was demonstrated (Fig. 3B). The effective doses to produce 50% receptor occupancy were calculated to be 0.31 and 19.5 mg/kg, respectively, for KOR and MOR. These ED50 values translated to a selectivity of approximately 63 folds for KOR over MOR, similar to the selectivity measured in vitro (∼43 times; supplemental material and Supplemental Table 1). At the maximum dose administered (30 mg/kg), LY2459989 induced no blockade of DOR binding, consistent with its low affinity for this receptor subtype (Fig. 3B; supplemental material and Supplemental Table 1).
Radiochemistry
Radiosynthesis of 11C-LY2459989 is depicted in Figure 2. Palladium-catalyzed displacement of the iodo group in the precursor by 11C-cyanide resulted in the intermediate 11C-7, which, without separation and purification, was reacted with H2O2 under basic condition to afford the amide 11C-LY2459989 (11C-5). This 2-step 1-pot radiosynthesis provided 11C-LY2459989 in greater than 99% enantiomeric purity (Fig. 4). The radiochemical purity of the product was greater than 98%. The radiochemical yield was 7.4% ± 3.8% at the end of synthesis (calculated from trapped 11C-cyanide and uncorrected for decay), with a specific activity of 22.6 ± 0.9 GBq/μmol (end of synthesis, n = 16). Total synthesis time was 40 ± 5 min.

Chiral HPLC chromatograms for the racemic compound (first row), (S)-enantiomer LY2459989 (second row), (R)-enantiomer (third row), and radiolabeled compound 11C- LY2459989 (last 2 rows). The (S)-enantiomer eluted first at 5.4 min, and (R)-enantiomer eluted later at 7.5 min.
In Vivo Evaluation in Rhesus Monkeys
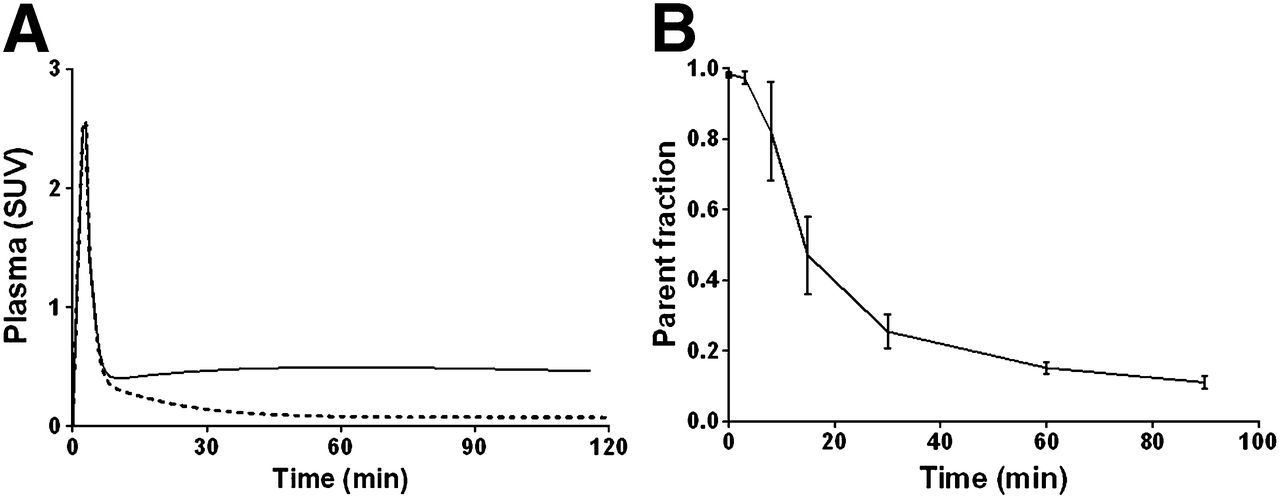
After a bolus injection of 11C-LY2459989 (140.6 ± 45.5 MBq; specific activity, 12.2 ± 4.7 GBq/μmol at time of injection; injected mass, 4.8 ± 0.7 μg, n = 12) into a rhesus monkey, total activity and parent activity in the plasma exhibited a rapid rise and clearance phase and then either stabilized or decreased slowly over time (Fig. 5A). At 30 min after tracer injection, parent fraction was approximately 25%, indicating a fairly rapid metabolism of the radioligand (Fig. 5B). The plasma-free fraction of 11C-LY2459989 was about 4.6%, compared with less than 1% for 11C-LY2795050 (29).

Analysis of 11C-LY2459989 in plasma. (A) Total radioactivity (solid line) and metabolite-corrected parent activity (dotted line) over time. (B) Time course of parent fraction from 6 baseline scans (mean ± SD). SUV = standardized uptake value.
In the rhesus monkey brain, 11C-LY2459989 displayed good uptake and a heterogeneous distribution pattern (Fig. 6A). The nonselective opioid antagonist naloxone at a dose of 1 mg/kg reduced 11C-LY2459989 uptake in all brain regions to nearly homogeneous levels (Fig. 6B), an effect similarly induced by 0.3 mg/kg of the selective KOR antagonist LY2456302 (Fig. 6C).

PET images of 11C-LY2459989 in transaxial (left), coronal (middle), and sagittal (right) views from baseline (A) and blocking scans with 1 mg/kg of naloxone (B) or 0.3 mg/kg of LY2456302 (C). Images are summed from 30 to 45 min after 11C-LY2459989 injection and presented in standardized uptake value unit.
Time–activity curves of 11C-LY2459989 in selected brain regions are presented in Figure 7. Higher uptake was seen in the globus pallidus, cingulate cortex, insula, caudate, and putamen; lower in the frontal cortex and thalamus; and lowest in the cerebellum (Fig. 7A). Regional activity in the brain typically reached peak levels within 10–20 min after tracer injection, indicating fast uptake kinetics. When naloxone was given before 11C-LY2459989, time–activity curves in higher binding regions trended down to the same level as that in the cerebellum (Fig. 7B). Furthermore, regional uptake of 11C-LY2459989 was also markedly reduced by pretreatment with LY2456302 (0.3 mg/kg, Fig. 7C).
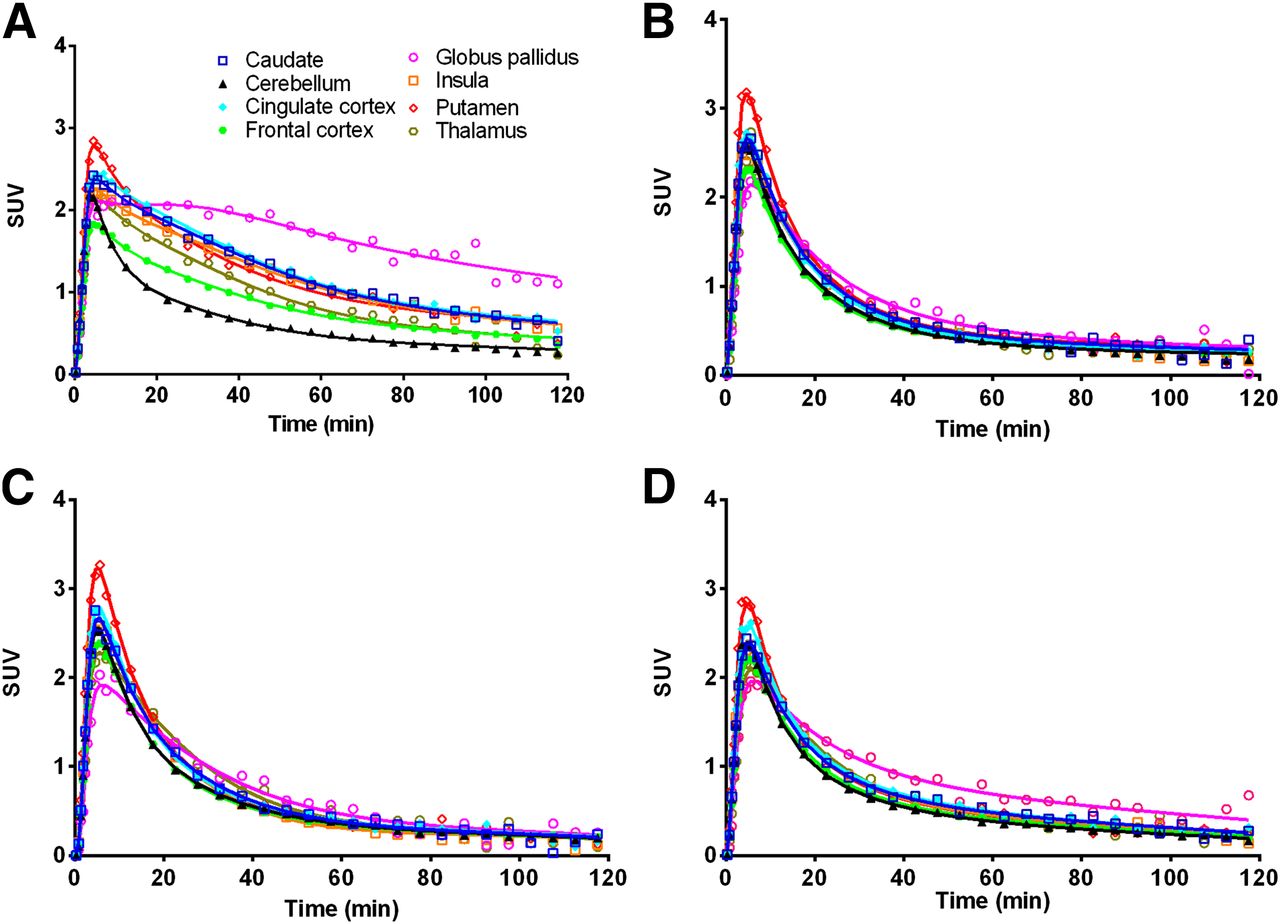
Time–activity curves in selected brain regions from 11C-LY2459989 baseline scan (A) and blocking scans after naloxone (B), 0.3 mg/kg of LY2456302 (C), or 36 μg/kg of LY2459989 (D).
Regional time–activity curves were analyzed with 1T and 2T compartment models (36) and the MA1 method (35) using the metabolite-corrected plasma input function. The 2T model was found to provide better fits to the data than the 1T model (AIC [2T] < AIC [1T]). Therefore, the 2T would be considered an appropriate model for analysis of the imaging data. Regional VT values (mL⋅cm−3) estimated by MA1 showed high correlation with 2T values (VT (MA1) = 0.987 VT (2T) + 0.027, r2 = 0.994). Listed in Table 1 are MA1-derived VT values. Regional values of nondisplaceable binding potential (BPND), as a measure of specific binding signal, were calculated using the cerebellum as the reference region (Table 2). In the baseline scans, MA1-derived VT or BPND values followed the order of globus pallidus > cingulate cortex > insula ∼ caudate ∼ putamen > frontal cortex ∼ temporal cortex ∼ thalamus > cerebellum. When the monkeys were pretreated with naloxone (1 mg/kg), LY2456302 (0.3 mg/kg), or unlabeled LY2459989 (36 μg/kg), the specific binding of 11C-LY2459989 was significantly blocked, as reflected by the negligible BPND values in most brain regions. On the basis of the occupancy plot analysis of the MA1-derived VT values (37), 91% ± 2% of KOR was occupied by 1 mg/kg of naloxone in 2 monkeys. KOR occupancies of 77% and 93%, respectively, were induced by 0.03 and 0.3 mg/kg of LY2456302, whereas an occupancy of 72% ± 5% was achieved in the self-blocking experiments with 36 μg/kg of LY2459989 in 2 separate monkeys.
Regional VT Values of 11C-LY2459989 Under Different Conditions
Regional BPND Values of 11C-LY2459989 Under Different Conditions
DISCUSSION
In this paper, we describe the synthesis and evaluation of 11C-LY2459989 as an improved antagonist radiotracer for PET imaging of KOR in rhesus monkeys. 11C-LY2459989 is a fluorine-containing analog of 11C-LY2795050, a first antagonist tracer developed at our laboratory and shown to be suitable for in vivo imaging and quantification of KOR in nonhuman primates (29). LY2459989 was synthesized in a route similar to that for LY2795050 (30). In radioligand competition assays in vitro, LY2459989 displayed high KOR binding affinity (Ki = 0.18 nM) and more than 43-fold selectivity for KOR over other ORs (Ki = 7.68 nM for MOR and 91.3 nM for DOR). Compared with LY2795050 (Ki = 0.72 nM for KOR), LY2459989 exhibited 4-times-higher KOR affinity and similar selectivity. Given this favorable in vitro binding profile, ex vivo evaluation was performed in rodents to assess its potential as a tracer candidate.
LY2459989 was administered intravenously to rats at a dose of 3 μg/kg. This dose was selected to be low enough to approximate tracer conditions while allowing the accurate measurement of tissue concentrations by LC/MS/MS analysis (32). LY2459989 was found to have excellent brain penetration, with initial uptake levels of 24.7 and 14.4 ng/g in the striatum and cerebellum at 5 min after injection, which were more than 6 times higher than those of LY2795050 (4.0 and 2.0 ng/g) (29). Specific binding of LY2459989 was also higher, with striatum-to-cerebellum ratios of 4.1 and 4.0 at 40 and 60 min after injection, respectively, versus 2.2 and 3.3 for LY2795050 (29).
Receptor occupancies at the rat KOR, MOR, and DOR were also assessed with LC/MS/MS after oral administration of ascending doses of LY2459989 using the triple-tracer method, with intravenous injection of GR103545 (1.5 μg/kg), naltrexone (10 μg/kg), and naltriben (10 μg/kg) as tracers for measuring binding to KOR, MOR, and DOR (32). KOR and MOR binding was reduced by LY2459989 in a dose-dependent manner. From the saturation curves, the LY2459989 ED50 was calculated to be 0.31 mg/kg for KOR and 19.5 mg/kg for MOR, which corresponded to about 63-fold KOR/MOR selectivity in vivo, consistent with the approximate 43-times KOR/MOR selectivity measured in vitro.
The radiolabeled ligand 11C-LY2459989 was prepared in high radiochemical purity in a 2-step radiosynthetic pathway using 11C-HCN as the radiolabeling agent. The reaction conditions used in the radiosynthesis did not lead to any racemization of the chiral structure and thus resulted in high enantiomeric purity (>99%) of the product.
PET imaging experiments in rhesus monkeys indicated a fairly rapid rate of metabolism for 11C-LY2459989, with approximately 25% of parent tracer remaining in the plasma at 30 min after injection. Similarly, fast uptake kinetics were detected in the monkey brain, with peak uptake times within 10–20 min after tracer administration. The distribution of 11C-LY2459989 was consistent with the rank order of KOR concentrations in monkey brain regions. Regional time–activity curves were amenable to kinetic analysis by the 2T model and MA1 method to derive reliable estimates of binding parameters (VT and BPND). In blocking experiments, the binding of 11C-LY2459989 in KOR-rich regions was significantly reduced by pretreatment of the monkeys with either the nonselective OR antagonist naloxone (1 mg/kg) or the unlabeled LY2459989 (36 μg/kg). In addition, pretreatment with the selective KOR antagonist LY2456302 decreased 11C-LY2459989 binding in a dose-dependent manner. Further, VT remained largely unchanged in the cerebellum when various blocking drugs were administered, suggesting that, in the rhesus monkey, the cerebellum could be used as a reference region. As a measure of specific binding signals, BPND was calculated from MA1-derived VT using cerebellum as the reference region. Values of BPND were high, and greater than 0.5 in most brain regions, and thus can be reliably measured from kinetic analysis of PET imaging data (Table 1) (39). Taken together, results from the current study demonstrated several favorable characteristics of 11C-LY2459989 as a PET imaging tracer, such as fast uptake kinetic, specific and selective binding to KOR, and high specific binding signals in vivo.
Compared with 11C-LY2795050, the new PET radioligand 11C-LY2459989 displays higher in vitro binding affinity for KOR with similar selectivity over other ORs. In rhesus monkeys, both tracers display good brain uptake (peak standardized uptake value, ∼3) and fast tissue kinetics, with peak uptake levels within 10–20 min after injection. Because of the higher KOR binding affinity, specific binding of 11C-LY2459989 is much higher, with regional BPND values more than twice of those for 11C-LY2795050 in the monkey brain (Table 2).
CONCLUSION
In this report, we demonstrate that the novel radioligand 11C-LY2459989 exhibits a favorable metabolic profile, brain uptake kinetics appropriate for a 11C tracer, and high regional specific binding signals in rhesus monkeys. Hence, 11C-LY2459989 represents a much improved radiotracer for PET imaging and quantification of KOR in vivo.
DISCLOSURE
The costs of publication of this article were defrayed in part by the payment of page charges. Therefore, and solely to indicate this fact, this article is hereby marked “advertisement” in accordance with 18 USC section 1734. The study was supported by a grant from the National Institute of Mental Health (R21MH092664). This publication was also made possible by CTSA grant number UL1 RR024139 from the National Center for Research Resources (NCRR) and the National Center for Advancing Translational Science (NCATS), components of the National Institutes of Health (NIH), and NIH roadmap for Medical Research. Its contents are solely the responsibility of the authors and do not necessarily represent the official view of NIH. No other potential conflict of interest relevant to this article was reported.
Acknowledgments
The authors thank the staff at the Yale PET Center for their expert technical assistance.
Footnotes
Published online May 22, 2014.
- © 2014 by the Society of Nuclear Medicine and Molecular Imaging, Inc.
REFERENCES
- Received for publication February 8, 2014.
- Accepted for publication March 25, 2014.


