


Abstract
PET using O-(2-18F-fluoroethyl)-l-tyrosine (18F-FET) provides important diagnostic information in addition to that from conventional MR imaging on tumor extent and activity of cerebral gliomas. Recent studies suggest that perfusion-weighted MR imaging (PWI), especially maps of regional cerebral blood volume (rCBV), may provide similar diagnostic information. In this study, we directly compared 18F-FET PET and PWI in patients with brain tumors. Methods: Fifty-six patients with gliomas were investigated using static 18F-FET PET and PWI. For comparison, 8 patients with meningiomas were included. We generated a set of tumor and reference volumes of interest (VOIs) based on morphologic MR imaging and transferred these VOIs to the corresponding 18F-FET PET scans and PWI maps. From these VOIs, tumor-to-brain ratios (TBR) were calculated, and normalized histograms were generated for 18F-FET PET and rCBV maps. Furthermore, in rCBV maps and in 18F-FET PET scans, tumor volumes, their spatial congruence, and the distance between the local hot spots were assessed. Results: For patients with glioma, TBR was significantly higher in 18F-FET PET than in rCBV maps (TBR, 2.28 ± 0.99 vs. 1.62 ± 1.13; P < 0.001). Histogram analysis of the VOIs revealed that 18F-FET scans could clearly separate tumor from background. In contrast, deriving this information from rCBV maps was difficult. Tumor volumes were significantly larger in 18F-FET PET than in rCBV maps (tumor volume, 24.3 ± 26.5 cm3 vs. 8.9 ± 13.9 cm3; P < 0.001). Accordingly, spatial overlap of both imaging parameters was poor (congruence, 11.0%), and mean distance between the local hot spots was 25.4 ± 16.1 mm. In meningioma patients, TBR was higher in rCBV maps than in 18F-FET PET (TBR, 5.33 ± 2.63 vs. 2.37 ± 0.32; P < 0.001) whereas tumor volumes were comparable. Conclusion: In patients with cerebral glioma, tumor imaging with 18F-FET PET and rCBV yields different information. 18F-FET PET shows considerably higher TBRs and larger tumor volumes than rCBV maps. The spatial congruence of both parameters is poor. The locations of the local hot spots differ considerably. Taken together, our data show that metabolically active tumor tissue of gliomas as depicted by amino acid PET is not reflected by rCBV as measured with PWI.
Although its ability to differentiate tumor tissue from nonspecific tissue changes is limited (1), 3-dimensional contrast-enhanced MR imaging currently remains the method of choice for diagnosis of glial tumors. To gain additional functional information on tumor biology, advanced MR imaging techniques, especially perfusion-weighted imaging (PWI), are increasingly used. Regional cerebral blood volume (rCBV) is the most relevant parameter derived from PWI, whereas others such as regional cerebral blood flow (rCBF) and mean transit time (MTT) are less frequently used (2–4). rCBV in brain tumors shows a significant correlation with microvessel density, expression of vascular endothelial growth factor, and proliferation (5–7) and has been explored for preoperative tumor grading (8), monitoring of neurooncologic treatment (9), assessment of prognosis (10), and the differentiation of tumor recurrence from radiation-induced changes (2,11). Although the preliminary data available are promising, they remain somewhat controversial.
For many years, radiolabeled amino acids have been used successfully for brain tumor diagnosis with PET (12). Because the uptake of amino acids by healthy brain tissue is relatively low, cerebral gliomas can be distinguished from the surrounding healthy tissue by increased amino acid incorporation. Most PET studies of cerebral gliomas have been performed with the amino acid l-[methyl-11C]-methionine (half-life, 20 min), but for logistic advantages the 18F-labeled amino acid O-(2-18F-fluoroethyl)-l-tyrosine (18F-FET) (half-life, 109.8 min) has become a well-established PET tracer (13). Several studies have proven the clinical value of 18F-FET PET to determine the extent of cerebral gliomas for treatment planning, biopsy guidance, detection of tumor recurrences, prognosis, and treatment monitoring (14–18).
Recent studies reported on a significant correlation between rCBV and l-[methyl-11C]-methionine uptake in brain tumors and suggested that PWI may provide diagnostic information similar to that of amino acid PET (11,19–21). The aim of this study was to compare the diagnostic information of 18F-FET PET with various parameters obtained by PWI in a larger series of patients with glioma. For comparison, several patients with meningioma were included since these tumors are characterized by high rCBV and are well suited to demonstrate the validity of our PWI approach (22).
MATERIALS AND METHODS
Patient Population
From February 2011 to January 2013, 64 adult patients with histologically confirmed cerebral glioma or meningioma were investigated by 18F-FET PET and PWI. Fifty-six patients had cerebral glioma (25 women and 31 men; mean age, 49 y; range, 25–75 y). The diagnosis was World Health Organization (WHO) grade IV glioblastoma in 24 cases, WHO grade III anaplastic astrocytoma in 11 cases, WHO grade II astrocytoma in 4 cases, WHO grade III anaplastic oligodendroglioma in 1 case, WHO grade II oligodendroglioma in 4 cases, WHO grade III anaplastic oligoastrocytoma in 7 cases, WHO grade II oligoastrocytoma in 2 cases, WHO grade III anaplastic ependymoma in 2 cases, and WHO grade III anaplastic ganglioglioma in 1 case. Of the 56 patients with glioma, 30 were untreated and 26 had undergone previous tumor resection, radiation therapy, chemotherapy, or a combination thereof. In 8 of these 26 patients, tumor recurrence was confirmed histologically; in 14, tumor recurrence was assumed because of increased 18F-FET uptake, which indicates a relapse with high accuracy (18); and in 4, imaging findings were ambiguous with respect to a tumor relapse. In the meningioma group, 7 patients had an untreated tumor but 1 patient had undergone previous tumor resection and radiotherapy (3 woman and 5 men; mean age, 63 y; range, 49–73 y). Six patients had WHO grade I meningioma, and 2 patients, including the one with previous treatment, had WHO grade II meningioma (Supplemental Tables 1 and 2, available at http://jnm.snmjournals.org).
The study was approved by the university ethics committee and federal authorities. All subjects gave prior written informed consent for their participation in the study.
MR Imaging
MR imaging was performed using a 3-Tesla Magnetom Trio MR scanner (Siemens Medical Systems). Standard imaging included a T1-weighted magnetization-prepared rapid gradient echo (MPRAGE) sequence, a T2-weighted fluid-attenuated inversion recovery sequence, and a contrast-enhanced T1-weighted MPRAGE sequence conducted 3 min after injection of the contrast agent gadoteric acid (Dotarem; Guerbet), with a dose of 0.1–0.2 mmol/kg of body weight (T1+C).
For PWI, we used a dynamic susceptibility-weighted contrast-enhanced T2* sequence measuring the first pass of a contrast agent bolus (single-shot echo planar imaging sequence; dynamic interscan interval, 1,500 ms; echo time, 32 ms; flip angle, 90°, image matrix, 128 × 128; field of view, 230 × 230 mm; slice thickness, 5 mm). The contrast agent was injected with a power injector, Injektron 82 MRT (Medtron AG), via an 18- to 20-gauge intravenous catheter at a dose of 0.1 mmol/kg of body weight (flow rate, 5 mL/s).
In addition to the regular procedure, we performed a second PWI sequence on 10 glioma patients to compare our method with the preloading approach. In those patients, the initial injection of contrast agent during the regular PWI sequence served as a prebolus and another PWI sequence was started after injection of a second bolus administered 3 min after the first. The postprocessing of the second PWI sequence was identical to that of the first PWI sequence. Since both procedures led to comparable results regarding mean tumor signal, volume, and localization, data evaluation in this study was based on PWI data derived from the first bolus.
PET Imaging
The amino acid 18F-FET was produced and applied as described previously (15). Dynamic PET studies were acquired up to 50 min after intravenous injection of 3 MBq of 18F-FET/kg of body weight on the same day as MR imaging.
PET imaging was performed either on an ECAT Exact HR+ PET scanner in 3-dimensional mode (Siemens Medical Systems) (axial field of view, 15.5 cm; image resolution, 6 mm) (23 glioma and 5 meningioma patients) or simultaneously with MR imaging using a BrainPET insert (33 glioma and 3 meningioma patients). The BrainPET is a compact cylinder that fits in the bore of the Magnetom Trio MR scanner (axial field of view, 19.2 cm; optimum image resolution, 3 mm) (23). The data from both PET scanners are presented together since major changes in tumor physiology are unlikely within the short interval between scans (<60 min) when performed sequentially.
Postprocessing
Parametric maps of rCBV, rCBF, and MTT were created from dynamic susceptibility-weighted contrast-enhanced T2* MR data using the program Stroketool, version 2.7 (24). For the evaluation of 18F-FET uptake, summed PET images from 20 to 40 min after injection were used. The data from the different modalities were analyzed using the commercially available software PMOD, version 3.203/3.403 (PMOD Ltd.).
Comparison of Tumor Imaging in Different Modalities
18F-FET PET and MR imaging data were manually coregistered in PMOD using anatomic landmarks, especially for sequential investigations and in those studies with minor patient movement in the BrainPET during the investigation. To compare tumor-to-background contrast in the different functional parameters, the tumor was defined by a volume of interest (VOI) based on signal alterations in morphologic MR imaging (MPRAGE, fluid-attenuated inversion recovery). In contrast-enhancing tumors, the tumor volume was determined using a visually guided 3-dimensional autocontouring process with an individually determined visual cutoff as described previously (15). In nonenhancing tumors, a spheric VOI of 10 cm3 was placed in the center of signal abnormalities in T1- and T2-weighted images. A large reference VOI was placed in the contralateral hemisphere in an area of normal-appearing brain tissue including white and gray matter. These VOIs were transferred to the corresponding parametric maps of rCBV, rCBF, MTT, and the static 18F-FET PET scan. The tumor-to-brain ratios (TBR) were calculated by dividing the mean value of the respective parameter in the tumor VOI by the corresponding mean value of the normal-brain VOI (19).
Furthermore, raw histograms for the tumor VOI and the reference VOI were provided for 18F-FET PET and rCBV maps using PMOD. The maximal pixel value of these VOIs was determined for 18F-FET PET and rCBV data, respectively, and the raw histograms were normalized to a standardized bin width and a unity of 1 for the curve integral. For PWI, meaningful tumor volumes could be evaluated in rCBV maps only. rCBF and MTT maps showed signal changes in the range of the background levels and were therefore discarded.
The spatial overlap of the brain tumor volumes as depicted in 18F-FET PET and rCBV maps was compared. An 18F-FET tumor volume was defined in each 18F-FET PET scan with a TBR threshold of 1.6 or more. This cutoff was based on a previous, biopsy-controlled study in which a TBR of 1.6 had best separated tumor from nontumor tissue (16). Because a corresponding threshold is not available for rCBV maps, we used the same threshold value as for 18F-FET PET to define rCBV tumor volume. Manual corrections of the tumor VOI were carefully applied if blood vessels were included and their signal exceeded the cutoff value. The spatial congruence of 18F-FET tumor volume and rCBV tumor volume was calculated. The hot spots in the tumor area in 18F-FET PET and rCBV maps of all gliomas were localized and their distance calculated. The sensitivity of 18F-FET scans and rCBV maps for detecting tumors was determined by recording the values of 18F-FET uptake and rCBV in the tumor VOI that exceeded the signal in the background region by more than 1 SD (z score, 1).
Statistical Analysis
Values are expressed as mean and SD. To compare 2 groups the Student t test was used, and to compare many groups 1-way ANOVA was used. The Mann–Whitney rank sum test or 1-way ANOVA on ranks was applied when variables were not normally distributed.
For correlation analysis, the Pearson product moment correlation and multiple linear regression analysis were used. The McNemar test was applied to compare the diagnostic sensitivity of PWI and 18F-FET PET to detect gliomas. Probability values of less than 0.05 were considered as significant.
RESULTS
Correlation Analyses
The correlation analysis applied to the data of 56 glioma patients yielded a significant positive correlation between rCBV and TBR of 18F-FET uptake (r = 0.55; P < 0.0001), between rCBF and TBR of 18F-FET uptake (r = 0.35; P < 0.01), and between rCBF and rCBV (r = 0.38; P < 0.01), indicating that all parameters increased concurrently. Furthermore, a significant negative correlation was observed between rCBV and MTT (r = −0.35; P < 0.0001).
A multiple linear regression analysis (TBR of 18F-FET uptake as dependent variable; rCBV, rCBF, and MTT as independent variables) revealed that rCBV was an independent parameter to predict 18F-FET uptake (P < 0.001) whereas rCBF and MTT showed no significant independent influence on 18F-FET uptake.
Comparison of TBRs and Sensitivity to Detect Tumors
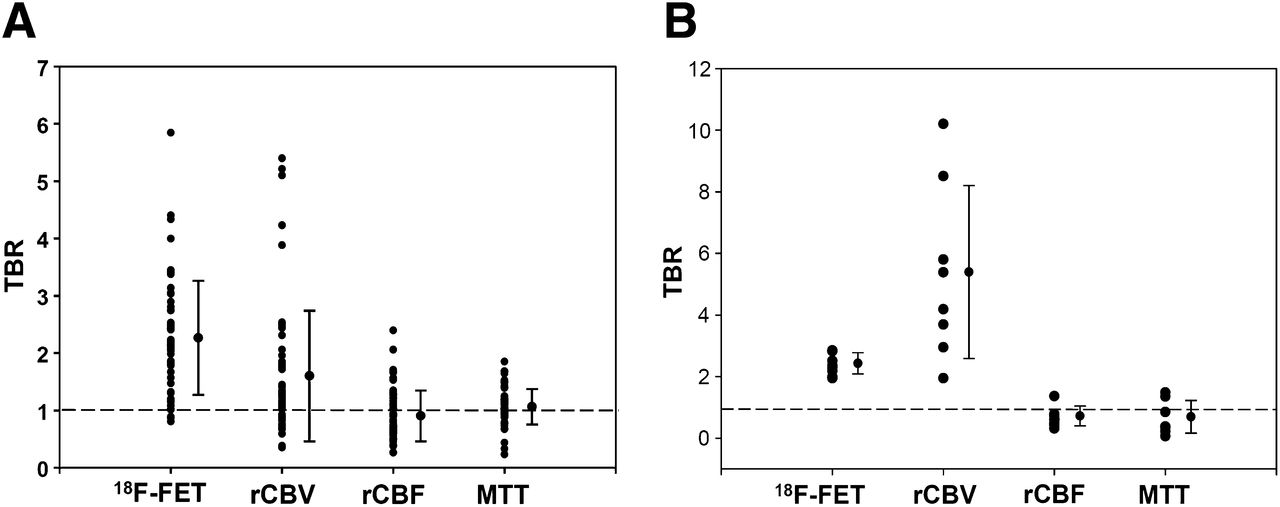
For patients with glioma, tumor-to-background contrast as determined by the TBR of 18F-FET uptake was significantly higher than in rCBV, rCBF, and MTT maps (TBR, 2.28 ± 0.99 vs. 1.62 ± 1.13, vs. 0.92 ± 0.44, and vs. 1.08 ± 0.31, respectively; P < 0.001) (Table 1; Figs. 1A and 2A). As expected, TBR showed the highest values in rCBV maps of meningiomas. In these tumors, TBR in rCBV maps were significantly higher than those observed in 18F-FET PET, rCBF, and MTT maps (TBR, 5.33 ± 2.63 vs. 2.37 ± 0.32, vs. 0.67 ± 0.30, and vs. 0.64 ± 0.50, respectively; P < 0.001) (Table 1; Figs. 1C and 2B; supplemental Tables 1 and 2).
Mean Results for Glioma and Meningioma Patients

(A) Hybrid PET/MR imaging study of patient with recurrent WHO grade II oligoastrocytoma after resection and radiation therapy; contrast-enhanced T1-weighted MR imaging on left shows no enhancement in tumor, 18F-FET PET (center) clearly depicts recurrent tumor, and tumor depiction in rCBV map (right) is poor. (B) Hybrid PET/MR imaging study of patient with untreated glioblastoma. MR imaging on left shows enhancing tumor. Local hot spots of 18F-FET uptake (center) and rCBV map (right) are spatially different. (C) PET/MR imaging study of patient with untreated WHO grade I meningioma. Contrast-enhanced T1-weighted image (left), 18F-FET PET (center), and rCBV map (right) demonstrate similar tumor extent.

(A) Gliomas (n = 56): comparison of mean TBRs of 18F-FET PET, rCBV, rCBF, and MTT maps in tumor and brain. Dotted line indicates background level (TBR = 1). 18F-FET PET provides highest tumor-to-brain contrast. (B) Meningiomas (n = 8): comparison of TBR of 18F-FET PET, rCBV, rCBF, and MTT maps in tumor and brain. In this tumor type, rCBV maps and 18F-FET PET provide highest tumor-to-brain contrast.
The sensitivity of 18F-FET uptake for detecting a glioma was 84% (47/56) and that of rCBV maps was 38% (21/56) for rCBV (P < 0.001). In meningiomas, the sensitivity of both methods was 100% (8/8).
Comparison of Histograms of 18F-FET-PET and rCBV VOIs
In glioma patients, the histograms of 18F-FET uptake allowed for a clear separation of tumor from background whereas separation based on histograms of rCBV was poor (Fig. 3). In contrast, in meningiomas a clear separation of tumor from background was possible with both 18F-FET PET and rCBV maps.

Comparison of mean histograms in tumor and brain VOIs in gliomas and meningiomas. 18F-FET PET allows clear separation of tumor and brain in both tumor types, whereas rCBV separates tumor and brain in meningiomas but not in gliomas.
Comparison of Tumor Volumes: 18F-FET Versus rCBV
Tumor volumes in glioma patients as determined by a TBR threshold of 1.6 or more were significantly larger in 18F-FET PET than in rCBV maps (tumor volume, 24.3 ± 26.5 cm3 vs. 8.9 ± 13.9 cm3; P < 0.001). The volume of contrast enhancement in T1-weighted images showed the smallest value (tumor volume, 4.7 ± 7.5 cm3) (Fig. 4). In patients with meningioma, tumor volumes in 18F-FET PET and rCBV maps were not significantly different (tumor volume, 28.9 ± 17.0 cm3 vs. 35.2 ± 16.9 cm3) (Table 1).

Comparison of tumor volume of gliomas (n = 56) in MR imaging (T1+C), 18F-FET PET, and rCBV. Tumor volumes in 18F-FET PET are significantly larger than those observed in contrast-enhanced MR imaging and in rCBV maps (P < 0.001).
Comparison of Spatial Congruence: 18F-FET Uptake and rCBV
In patients with glioma, the tumor volume based on a TBR threshold of 1.6 or more in 18F-FET PET and rCBV maps (18F-FET tumor volume and rCBV tumor volume) showed only a poor spatial overlap (11.0%) (Table 1). In contrast, in meningioma patients, tumor depiction by contrast-enhanced MR imaging, abnormal 18F-FET uptake, and increased rCBV was comparable.
DISCUSSION
This study demonstrated that in glioma patients the diagnostic information that can be derived from PWI is different from that provided by amino acid PET. In our study, PWI showed different information from 18F-FET PET with respect to the extent of the metabolically active tumor volume and localization. Numerous studies have demonstrated that PET using radiolabeled amino acids such as l-[methyl-11C]-methionine or 18F-FET provides a valid depiction of the metabolic active tumor volume of cerebral gliomas, thereby providing important diagnostic information over and above that provided by conventional MR imaging (12). Thus, our observations suggest that PWI has a considerably lower diagnostic value in depicting metabolic active tumor tissue than does amino acid PET.
In patients with gliomas, rCBV maps showed a low tumor-to-brain contrast, a low sensitivity to detect gliomas, highly variable background, and a poor spatial overlap compared with 18F-FET uptake. Furthermore, the localization of the local hot spots in the tumor area differed for the 2 methods. This aspect is of high importance for biopsy planning, and future studies should address the differential potential of both methods to depict anaplastic foci. Maps of rCBF and MTT were also evaluated, but because of the low tumor-to-background contrast the final evaluation focused on rCBV maps. The signal in the rCBV maps did not allow a reliable differentiation of tumor tissue from unaffected brain tissue in glioma patients, as was also reflected by the histogram analysis (Fig. 3). Several studies have investigated individual histograms in rCBV maps (25–27), but to the best of our knowledge this was the first study to compare mean histograms of 18F-FET PET and rCBV maps in gliomas.
The limitations of rCBV maps in brain tumor diagnosis have been addressed in the literature (25). One drawback of this method is the fact that PWI is difficult in regions close to a brain–bone–air interface such as the base of skull (3). Moreover, identifying a hot spot in rCBV maps is highly user-dependent because a clear differentiation from blood vessels can be challenging and may require the knowledge of a specialist (26,28). Moreover, unaffected white matter is commonly used as a reference, but an incorrect selection of the reference may lead to under- or overestimation of the normalized rCBV (25).
Our results do not replicate previous studies that reported tumor-to-background ratios in rCBV maps similar to those of amino acid PET (11,19,20). In those studies, however, the regions of interest for measurement of rCBV in the tumor and background area were quite small and arbitrarily chosen and might thus have failed to properly reflect the average signal of the tumor area. To avoid this potential confound, we generated a set of tumor and reference VOIs based on morphologic MR imaging and transferred these VOIs to the corresponding 18F-FET PET scans and PWI maps. To avoid errors induced by the highly variable background in the rCBV maps, we used a mean value of those VOIs instead of the maximum value.
Furthermore, rCBV measurements are not standardized (29). In our study, we measured a first-pass PWI similar to that applied in the clinical setting to investigate intracranial mass lesions (30). Some authors recommend a preinjection of contrast agent to achieve a more accurate rCBV (29,31). In a subgroup of 10 patients with glioma, we measured 2 consecutive PWI studies, one without and one with a prebolus of contrast agent. The results of the 2 different approaches showed no major differences with respect to mean TBRs, spatial overlap of the tumor area, and localization of the local hot spots in rCBV maps and 18F-FET PET (data not shown). The reliability of our PWI approach is confirmed by the results in patients with meningioma. These tumors are highly vascularized, and rCBV maps provided an excellent tumor depiction. Thus, rCBV maps are indeed well suited to depict tumors with high blood volume, but this is not generally the case in patients with cerebral gliomas. Obviously, rCBV maps in gliomas do not provide information on the extent of metabolically active tumor tissue, and the information is not equivalent to that provided by amino acid PET.
The relation of amino acid uptake in PET and vascularity of cerebral gliomas remains a matter of debate. We observed a significant correlation between rCBV and 18F-FET PET uptake indicating that these physiologic parameters are linked to each other, as is in line with the observations of other studies (32,33). Our findings demonstrate, however, that rCBV and 18F-FET PET are not equivalent with respect to the depiction of tumor extent or localization of local hot spots. Our observations are similar to a study that demonstrated a spatial heterogeneity between 18F-FET uptake and rCBF measured with 15O-labeled water in low-grade gliomas, indicating that amino acid uptake and vascularity are not intimately coupled (34).
The results of the present study do not exclude a potential clinical impact of rCBV maps on estimating tumor grade, differentiating posttreatment changes from tumor recurrence, or identifying malignant transformation, but imaging of tumor extent is essentially different from that observed with 18F-FET PET, and the localization of tumor hot spots for biopsy planning may not correspond in the 2 methods.
CONCLUSION
Our study demonstrated that the information provided by 18F-FET PET and rCBV maps in gliomas differs substantially. In patients with glioma, 18F-FET PET, compared with rCBV maps, exhibited higher TBR and larger tumor volumes. Importantly, the spatial congruence of both methods was poor and the localization of tumor hot spots led to different results. In contrast, in meningiomas, rCBV maps and 18F-FET PET showed high congruence, indicating the reliability of our approach to measure rCBV using PWI. Taken together, our data strongly suggest that metabolically active tumor tissue of gliomas as depicted by amino acid PET is not appropriately reflected by PWI, and the diagnostic information provided by rCBV maps cannot replace amino acid PET.
DISCLOSURE
The costs of publication of this article were defrayed in part by the payment of page charges. Therefore, and solely to indicate this fact, this article is hereby marked “advertisement” in accordance with 18 USC section 1734. No potential conflict of interest relevant to this article was reported.
Acknowledgments
We thank Lutz Tellmann, Suzanne Schaden, Elisabeth Theelen, Kornelia Frey, and Natalie Judov for assistance with the PET and MR imaging studies, and Silke Grafmüller, Erika Wabbals, Sascha Rehbein, and Dr. Johannes Ermert for radiosynthesis of 18F-FET according to good manufacturing practice.
Footnotes
Published online Feb. 27, 2014.
- © 2014 by the Society of Nuclear Medicine and Molecular Imaging, Inc.
REFERENCES
- Received for publication July 8, 2013.
- Accepted for publication October 17, 2013.


Jump to section
Related Articles
Cited By...
- Amino Acid Tracer PET MRI in Glioma Management: What a Neuroradiologist Needs to Know
- Treatment-Related Uptake of O-(2-18F-Fluoroethyl)-L-Tyrosine and L-[Methyl-3H]-Methionine After Tumor Resection in Rat Glioma Models
- Epileptic Activity Increases Cerebral Amino Acid Transport Assessed by 18F-Fluoroethyl-L-Tyrosine Amino Acid PET: A Potential Brain Tumor Mimic
- Hybrid PET/MR Imaging in Neurology: Present Applications and Prospects for the Future
- PET/MR Imaging: A Critical Appraisal