


Abstract
O-(2-18F-fluoroethyl)-l-tyrosine (18F-FET) PET is a well-established method increasingly used for diagnosis, treatment planning, and monitoring in gliomas. Epileptic activity, frequently occurring in glioma patients, can influence MRI findings. Whether seizures also affect 18F-FET PET imaging is currently unknown. The aim of this retrospective analysis was to investigate the brain amino acid metabolism during epileptic seizures by 18F-FET PET and to elucidate the pathophysiologic background. Methods: Ten patients with 11 episodes of serial seizures or status epilepticus, who underwent MRI and 18F-FET PET, were studied. The main diagnosis was glioma World Health Organization grade II–IV (n = 8); 2 patients suffered from nonneoplastic diseases. Immunohistochemical assessment of LAT1/LAT2/CD98 amino acid transporters was performed in seizure-affected cortex (n = 2) and compared with glioma tissues (n = 3). Results: All patients exhibited increased seizure-associated strict gyral 18F-FET uptake, which was reversible in follow-up studies or negative shortly before and without any histologic or clinical signs of tumor recurrence. 18F-FET uptake corresponded to structural MRI changes, compatible with cortical vasogenic and cytotoxic edema, partial contrast enhancement, and hyperperfusion. Patients with prolonged postictal symptoms lasting up to 8 wk displayed intensive and widespread (≥ 1 lobe) cortical 18F-FET uptake. LAT1/LAT2/CD98 was strongly expressed in neurons and endothelium of seizure-affected brains and less in reactive astrocytosis. Conclusion: Seizure activity, in particular status epilepticus, increases cerebral amino acid transport with a strict gyral 18F-FET uptake pattern. Such periictal pseudoprogression represents a potential pitfall of 18F-FET PET and may mimic brain tumor. Our data also indicate a seizure-induced upregulation of neuronal, endothelial, and less astroglial LAT1/LAT2/CD98 amino acid transporter expression.
PET with the amino acid tracer O-(2-18F-fluoroethyl)-l-tyrosine (18F-FET) is increasingly used as an adjunct to magnetic resonance tomography (MRI) for brain tumor diagnosis, treatment planning, and monitoring (1,2). 18F-FET uptake is primarily mediated by the system L amino acid transporter subtypes LAT1 and LAT2 (3,4). These transporters are heterodimers consisting of a light (LAT1, LAT2) and a heavy chain (CD98) and function as obligatory stereospecific exchanger (antiporter) of neutral amino acids (3,4).
LAT1/LAT2 are highly expressed in primary brain tumors. The highest levels have been detected in glioma cells and tumor-associated endothelium (5). Consequently, 18F-FET PET has a high specificity for gliomas mediated by a tracer uptake almost independent of blood–brain barrier (BBB) dysfunction. 18F-FET uptake by nonneoplastic tissue is considered as a rare phenomenon and has been reported for various inflammatory and vascular brain lesions (1,6–10).
Epileptic seizures are among the most common symptoms of primary brain tumors (11). Focal symptoms after seizures usually disappear within 36 h (12–14). Prolonged postictal deficits, however, are often similar to symptoms that arise from progressive tumor growth. On the other hand, an increase of seizure frequency may be an early sign of tumor progression (11,15). Therefore, the differentiation of purely seizure-related postictal symptoms from tumor progression is of paramount importance in the clinical management of brain tumor patients.
To complicate this matter, seizure activity, in particular status epilepticus (SE), may result in MRI changes difficult to differentiate from tumor progression (16). For 18F-FET PET, it is still unknown whether and to which extent seizures influence cerebral amino acid metabolism and 18F-FET tracer uptake. Therefore, we retrospectively studied patients with serial epileptic seizures or SE who underwent MRI and 18F-FET PET imaging, with a particular focus on spatial distribution pattern and time course of 18F-FET uptake, and elucidated the pathophysiologic background by histopathologic assessment of amino acid transporter expression in specific cell types involved in epileptogenesis.
MATERIALS AND METHODS
Study Design and Data Collection
We identified 8 patients with glioma World Health Organization (WHO) grade II–IV and 2 patients with nonneoplastic diseases from 3 neurooncology centers (Salzburg, Austria; Regensburg and Freiburg, Germany), who fulfilled the following inclusion criteria: presentation with typical clinical or electroencephalographic (EEG) signs of highly frequent seizures (several times per day, serial seizures) or SE and multimodal imaging work-up consisting of 18F-FET PET and serial MRI scans.
According to the definitions of the International League Against Epilepsy types of epileptic seizures were classified as simple partial seizure (SPS), complex partial seizure (CPS), tonic-clonic seizure (TCS), and series of epileptic seizures (SES) (17). SE was defined as ≥5 min of convulsive seizures or ≥10 min of nonconvulsive seizures with impairment of consciousness confirmed by EEG criteria (18–20).
Clinical data, laboratory values, EEG, standard MRI, 18F-FET PET, and histologic records of all patients were analyzed (Table 1). Besides MRI and 18F-FET PET during the course of disease, MR perfusion-weighted imaging (PWI), 99mTc-hexa-methyl-propylen-aminooxim (99mTc-HMPAO) SPECT, and 18F-FDG PET scans at the time of epileptic disorder were additionally evaluated if available.
Patient Characteristics at Time of Seizure Diagnosis
The local ethics committee of the University of Regensburg approved this retrospective study (no. 14-101-0185), and the requirement to obtain informed consent was waived. The study was conducted according to the standards of the Declaration of Helsinki in its recent revised version of 2013.
Standard MR Imaging
Standard MR imaging was routinely performed at the local departments of neuroradiology. At the time of seizure disorder and afterward in the course of disease, all patients underwent MRI scans using 1.5-T or 3.0-T scanners with standard head coils before and after administration of a gadolinium-based contrast agent. The routine MRI protocol included T1-weighted sequences with and without contrast agent (T1w, T1wCE), T2 and FLAIR (fluid-attenuated inversion recovery) sequences, and MR diffusion-weighted imaging (DWI) with calculation of the apparent diffusion coefficient (ADC). In 5 patients, additional dynamic susceptibility contrast (DSC) PWI was available.
MR Image Analysis
For study evaluation, the cortical changes in standard MRI and, if available, DSC-PWI were retrospectively reviewed by 2 independent investigators. During this analysis, contrast enhancement in T1wCE sequence (BBB permeability), T2/FLAIR sequences (hyperintensity, vascular edema), DWI/ADC sequences (diffusion restriction, cytotoxic edema), and DSC-PWI (hypo- or hyperperfusion) were graded visually on a 3-point scale (no, weak, and strong).
18F-FET PET Imaging
18F-FET PET was routinely performed at the local departments of nuclear medicine according to the German and Austrian guidelines for brain tumor imaging using labeled amino acid analogs (21). All patients fasted for at least 6 h before PET scanning. Before the investigation, a low-dose CT scan was obtained for attenuation correction. PET acquisition was started 20 min after intravenous injection of about 250 MBq of 18F-FET with a scan duration of at least 20 min. The methodologic differences between the different neurooncology centers (PET scanner equipment, reconstruction methods, and acquisition specifics) are summarized in Supplemental Table 1 (supplemental materials are available at http://jnm.snmjournals.org). All 18F-FET PET scans were conducted between March 2011 and June 2015.
18F-FET PET Image Analysis
18F-FET PET and MR images were coregistered using dedicated software (Vinci V4.40; Max-Planck-Institute for Metabolism Research). The results were reviewed and, if necessary, adapted on the basis of anatomic landmarks. The region-of-interest (ROI) analysis was based on the summed static 18F-FET PET data. The transaxial slice showing the highest tracer accumulation in the brain lesion was chosen for ROI analysis. The tracer uptake in the unaffected brain was determined by the largest possible ROI placed on the contralateral hemisphere in an area of normal-appearing brain, including white and gray matter and excluding basal ganglia, thalamus, and ventricles. 18F-FET uptake was expressed as SUVs. The ROI of the suspicious lesion was determined using a 3-dimensional autocontouring process with a lesion-to-brain ratio (LBR) of ≥ 1.6 as described previously (22). Because of the reversibility of seizure-related cortical tracer uptake in follow-up studies and 18F-FET PET shortly before seizure activity, cortical LBRmax was < 1.6. In these cases, a circular ROI with a diameter of 1.6 cm was centered exactly on the cortex of maximal 18F-FET uptake observed during seizure activity. Mean and maximum LBRs (LBRmean, LBRmax) were calculated by dividing SUVmean and SUVmax of the 18F-FET uptake by the SUVmean of the contralateral unaffected hemisphere.
For study evaluation, the cortical changes in 18F-FET PET were assessed visually by 2 independent investigators. Cortical 18F-FET uptake extension was graded as focal (extension ≤ 5 cm), enlarged (extension > 5 cm, within 1 lobe), and widespread (more than 1 lobe).
In 1 patient (patient 3), a time–activity curve of SUVmean in the frontal epileptic brain lesion was generated by measuring a spheric volume of interest of 2 mL centered on the maximal 18F-FET brain lesion uptake and in a reference ROI of unaffected brain (as described above) using the entire dynamic dataset.
Histologic Assessment and Immunostaining
Histologic specimens were available for study analysis from 2 patients of the study cohort (Table 2): patient 3 with oligodendroglioma WHO grade II (no residual tumor) and nonconvulsive SE resulting in partial frontal lobe resection of seizure-affected cortex, and patient 7 with repeated CPS and TCS leading to first diagnosis of glioblastoma WHO grade IV and resection of seizure-affected cortex and subcortical tumor. Seizure-affected cortex was defined as cortical tissue with seizure-induced changes in MRI and 18F-FET PET and without tumor cells in histopathologic evaluation.
Overview on Seizure Activity, EEG Findings, MRI, and 18F-FET PET Imaging and Disease Course of Study Population
For comparison, 3 tissue specimens of archival material with astrocytoma WHO grade II, anaplastic astrocytoma WHO grade III, and glioblastoma WHO grade IV were evaluated. All specimens were assessed for the protein expression pattern of LAT1, LAT2, and CD98 using formalin fixed and paraffin-embedded (FFPE) tissues.
Immunohistochemical staining was performed according to standard protocols. Paraffin sections were deparaffinized through an alcohol series and rehydrated. After antigen retrieval for 20 min (ethylene diamine tetraacetic acid buffer, pH 8.5; Sigma-Aldrich) and a blocking step, sections were incubated with the primary antibodies (LAT1/LAT2 for 45 min at room temperature, CD98 overnight at 4°C). The following primary antibodies were used: rabbit-anti SLC7A5 (PA2187 [Booster Immunoleader], 1:100), rabbit-anti SLC7A8 (NBP1-70389 [Novus Biologicals], 1:1,000), rabbit-anti CD98 (bs-6659R [Bioss], 1:100). Immunoreactivity was detected by the EnVision Detection System (#K406511-2; Dako) and 3,3′-diaminobenzidine tetrahydrochloride (EnVision+; Dako) and afterward counterstained by hematoxylin. As positive control, FFPE tissue from placenta was used, and negative controls were run without the primary antibody. Neuropathologic evaluation was performed by a board-certified neuropathologist masked to clinical and imaging findings. The immunostaining pattern of neurons, astrocytes, microglia, and tumor and vascular endothelial cells of tumor bulks and tumor infiltrative zones were analyzed separately.
RESULTS
Study Population
In this multicenter study, 10 patients with 11 episodes of SES/SE were identified (8 patients with gliomas WHO grade II–IV; 2 patients with nonneoplastic diseases and final diagnoses of ischemic stroke and nonconvulsive SE caused by septic encephalopathy; Table 1). One patient presented with identical serial focal motor seizures and focal SE followed by prolonged postictal hemiparesis in 2011 and 2014. Because combined MRI and 18F-FET PET was available from both time points, this patient was examined twice (cases 1 and 2). 18F-FET PET was performed during or within 7 d after termination of the clinical or EEG signs of seizure activity (Table 2). MRI and 18F-FET PET were also obtained out of an epileptic episode. This was during the clinical follow-up after seizure initiation in 5 cases (range, +8 to +12 wk) and before seizure onset in 2 other cases (−4 and −10 wk).
Structural MRI Changes During Seizure Activity
During SES/SE and prolonged postictal symptoms, we observed structural MRI changes including cortical hyperintensity in T2/FLAIR sequences and diffusion-restriction with low ADC values in DWI/ADC (9/11 cases; Table 2; Figs. 1–3; Supplemental Fig. 1), consistent with the presence of cortical vasogenic and cytotoxic edema. In 3 of 11 cases, additional focal gyral contrast enhancement in T1wCE was noted (Figs. 1 and 2). Cortical perfusion was increased in DSC-PWI in 3 of 5 available cases with clinical or electrophysiologic signs of SE or treatment-resistant series of SPS (Figs. 1–3). Patients with high seizure frequency but without SE (2/11 cases) did not exhibit any visible structural brain changes on standard MRI.

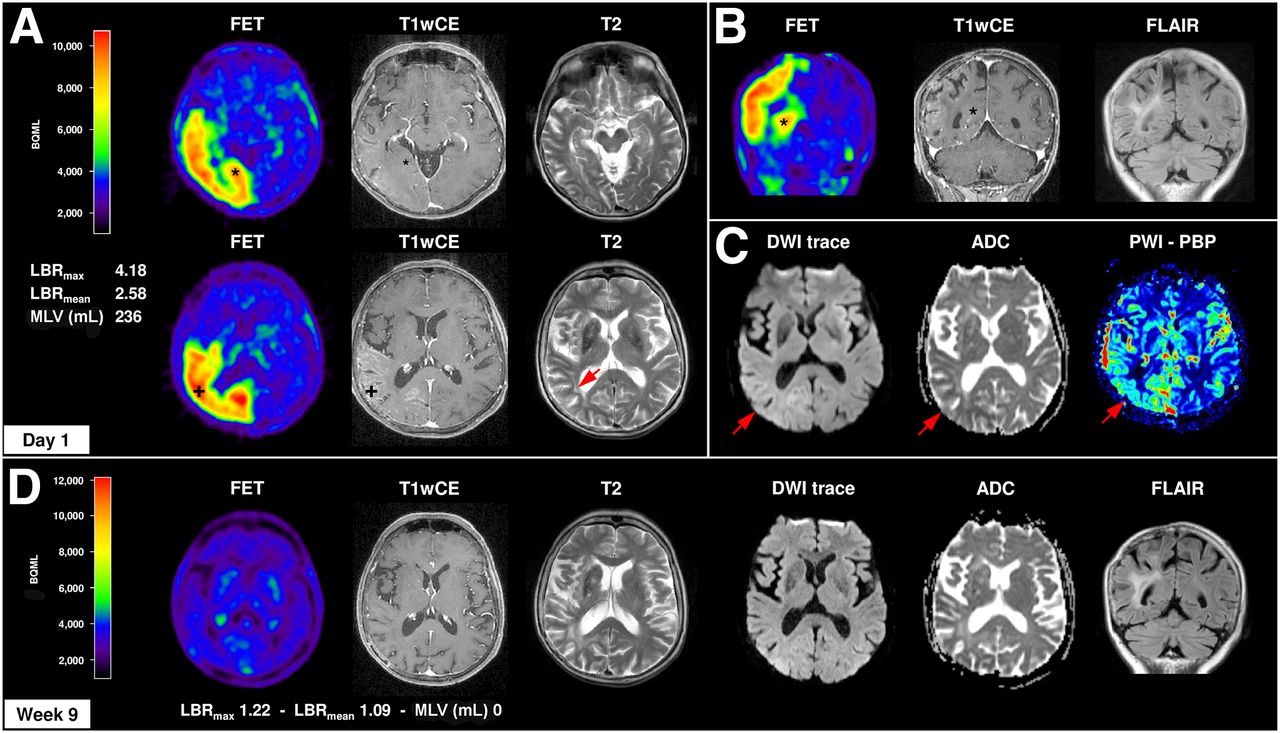
Structural and metabolic changes in MRI and 18F-FET PET in focal SE. Case 1 represents a 64-y-old woman with clinically stable right frontal anaplastic astrocytoma WHO III without residual tumor. In 2011, she developed a series of treatment-refractory motor SPS and a focal SE of left arm and leg, followed by a severe and prolonged postictal left hemiparesis for 4 wk. (A–C) MRI/18F-FET PET was performed simultaneously with motor SPS and revealed a distinct increased and extended cortical 18F-FET uptake right temporo–parieto–occipital (LBRmax, 4.18; LBRmean, 2.58) associated with cortical vasogenic (T2/FLAIR hyperintensity) and cytotoxic (diffusion-restriction in DWI + low ADC values) edema, contrast enhancement (T1wCE, BBB leakage), and hyperperfusion (PWI-PBP, baseline at peak map). 18F-FET uptake was observed independently from BBB disruption in cortex with (*) and without (+) contrast enhancement in T1wCE. (D) Nine weeks after seizure onset and antiepileptic treatment, structural and metabolic MRI and 18F-FET PET signal alterations completely resolved, except for slight cortical atrophy in T1 and T2/FLAIR. In 2014, same patient again developed treatment-resistant series of motoric SPS with prolonged postictal hemiparesis for 4 wk with similar morphologic and metabolic changes in MRI/18F-FET PET (LBRmax 4.02, LBRmean 2.50) (not shown).

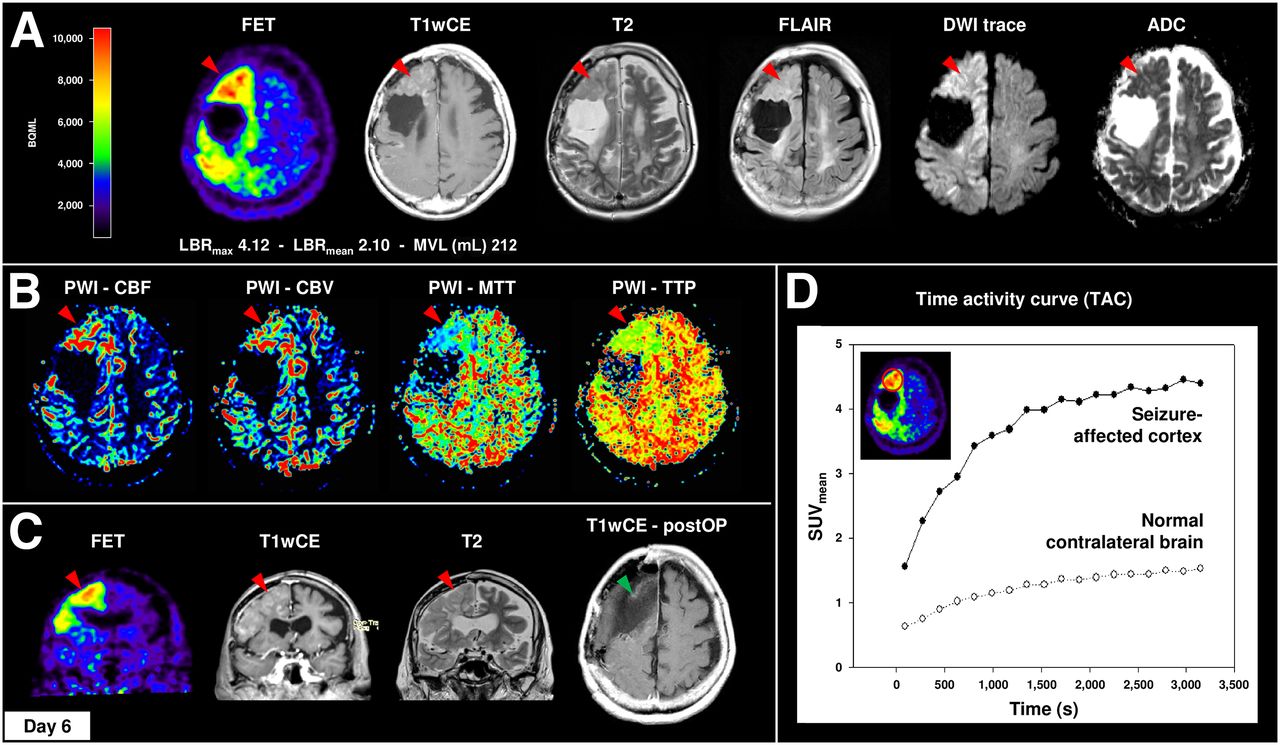
Widespread 18F-FET uptake, vasogenic and cytotoxic edema, contrast enhancement, and hyperperfusion with strict gyral pattern during nonconvulsive SE. Case 3 demonstrates a 66-y-old woman with clinically stable right frontal oligodendroglioma WHO II without residual tumor. In 2014, the patient presented with repeated CPS followed by treatment-resistant nonconvulsive SE. 18F-FET PET revealed distinct elevated cortical 18F-FET uptake of right hemisphere with frontal and parietal accentuation (LBRmax, 4.42; LBRmean, 2.45), corresponding to cortical contrast enhancement in T1wCE, marked gyral vasogenic (T2/FLAIR, cortical swelling), and cytotoxic (DWI/ADC) edema (A) and cortical hyperperfusion in DSC-PWI (B). (C) Clinical deterioration in combination with MRI and 18F-FET PET imaging was interpreted as tumor recurrence. Therefore, patient underwent subtotal frontal lobe resection without any histologic evidence of tumor progression. (D) Additional 18F-FET kinetic analysis of right frontal lesion and normal contralateral brain demonstrated SUVmean time–activity course curve pattern with continuously increasing 18F-FET uptake without washout. CBF = cerebral blood flow; CBV = cerebral blood volume; MTT = mean transit time; TTP = time to peak.

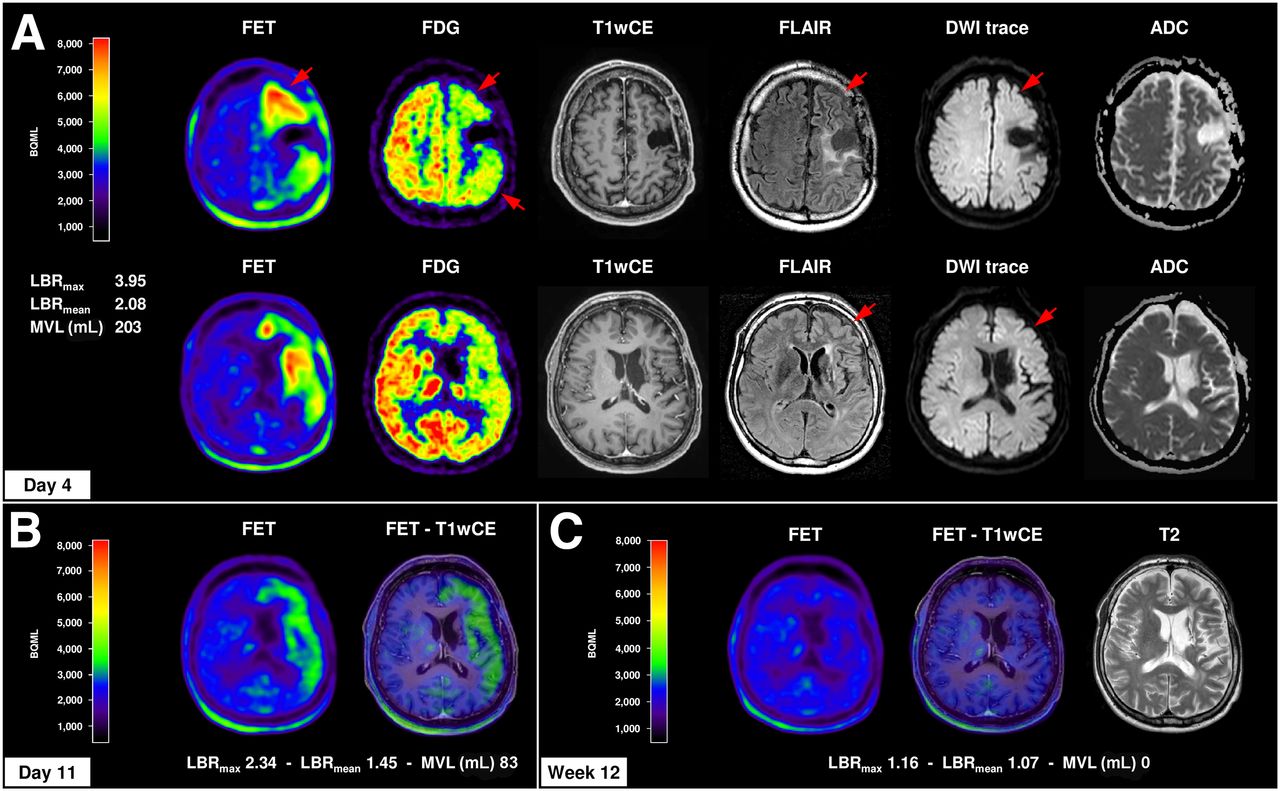
Cortical amino cid metabolism in 18F-FET PET in course of prolonged postictal episode. Case 4 demonstrates 44-y-old man with clinically stable anaplastic astrocytoma WHO III without any residual tumor over years who presented with TCS followed by severe and prolonged postictal symptoms (global aphasia, right-sided hemiplegia, and hemineglect) over 8 wk. (A) MRI (day 1) and 18F-FET PET (day 4) showed distinct increased and extended cortical 18F-FET uptake of left brain hemisphere (LBRmax, 3.95; LBRmean, 2.08) with frontal and temporal accentuation, corresponding to slight cortical vasogenic and cytotoxic edema (T2/FLAIR, DWI/ADC) without contrast enhancement (T1wCE). EEG monitoring, 18F-FDG PET (glucose hypometabolism, red arrows), and 99mTc-HMPAO SPECT (hypoperfusion, only written medical report available), however, revealed no evidence of SE. (B) For 18F-FET PET 11 d after symptom onset and 7 d after first 18F-FET PET, slight regression of cortical 18F-FET uptake (LBRmax, 2.34; LBRmean, 1.45) was observed. (C) Patient slowly recovered within 8 wk after seizure onset. 18F-FET PET and MRI 12 wk after symptom onset demonstrated complete recovery of cortical 18F-FET uptake and brain edema; only residual cortical atrophy in T1 and T2/FLAIR sequences remained.
18F-FET Uptake During Seizure Activity
Seven patients with SES/SE or prolonged postictal symptoms demonstrated increased 18F-FET uptake strictly following the cortical ribbon of seizure-affected brain areas (patients 1–6 and 10; Table 2) corresponding to structural MRI changes. 18F-FET PET revealed increased LBRmax (range, 1.83–4.42; median ± SD, 3.95 ± 1.02) and LBRmean (range, 1.46–2.58; median ± SD, 2.27 ± 0.40). 18F-FET tracer uptake occurred in areas with and without contrast enhancement in T1wCE (Figs. 1–3; Supplemental Figure 1). In contrast, patients with TCS followed by prolonged postictal hemiparesis (patient 11; Supplemental Fig. 1D) or high frequent seizures without SE (patients 7–9) exhibited lower LBRmax (range, 1.69–1.81; median ± SD, 1.77 ± 0.05) and LBRmean (range, 1.42–1.57; median ± SD, 1.49 ± 0.08) of more focally enhanced cortical 18F-FET uptake (Supplemental Fig. 1).
In case 3, the time–activity curve of 18F-FET uptake in the frontal epileptic brain lesion was calculated and compared with the unaffected contralateral hemisphere (Fig. 2D). The curve pattern showed a continuously increasing 18F-FET uptake without clear identifiable peak uptake and washout kinetics, comparable to that usually observed in low-grade gliomas.
18F-FET Uptake and Prolonged Postictal Symptoms
Four SES/SE patients showed an increased and widespread cortical 18F-FET uptake spreading into 2 or 3 lobes, combined with cortical vasogenic and cytotoxic edema and partial contrast enhancement in MRI (patients 1, 2, 5, and 6). This observation was associated with prolonged postictal symptoms lasting 1–6 wk (Table 2).
In contrast, patient 4 suffered from clinical stable anaplastic astrocytoma WHO grade III without residual tumor over years and presented with a TCS followed by severe postictal symptoms over 8 wk (Fig. 3). This condition was associated with distinctly increased cortical 18F-FET uptake over 3 lobes of the left hemisphere with frontotemporal accentuation (LBRmax, 3.95; LBRmean, 2.08) and slight cortical vascular and cytotoxic edema without contrast enhancement in MRI. Importantly, there was no evidence of SE in EEG monitoring, 18F-FDG PET (regional hypometabolism), and 99mTc-HMPAO (regional hypoperfusion; not shown in detail), indicating prolonged increased cerebral amino acid metabolism in the postictal period.
Reversibility of Metabolic and Structural Cortical Changes
Follow-up MRI and 18F-FET PET scans from 5 patients were available after seizure termination (range, 2–12 wk). Despite antiepileptic treatment, patients with widespread and extensive cortical 18F-FET uptake showed only a slow recovery of structural and metabolic cortical changes within 4–12 wk (Table 2; Figs. 1D, 3B, and 3C). Figures 4A–4C show the time course of 18F-FET uptake decrease. 18F-FET PET scans were acquired 4 d (LBRmax, 3.95; LBRmean, 2.08), 11 d (LBRmax, 2.34; LBRmean, 1.45), and 12 wk (no tracer uptake) after seizure onset.

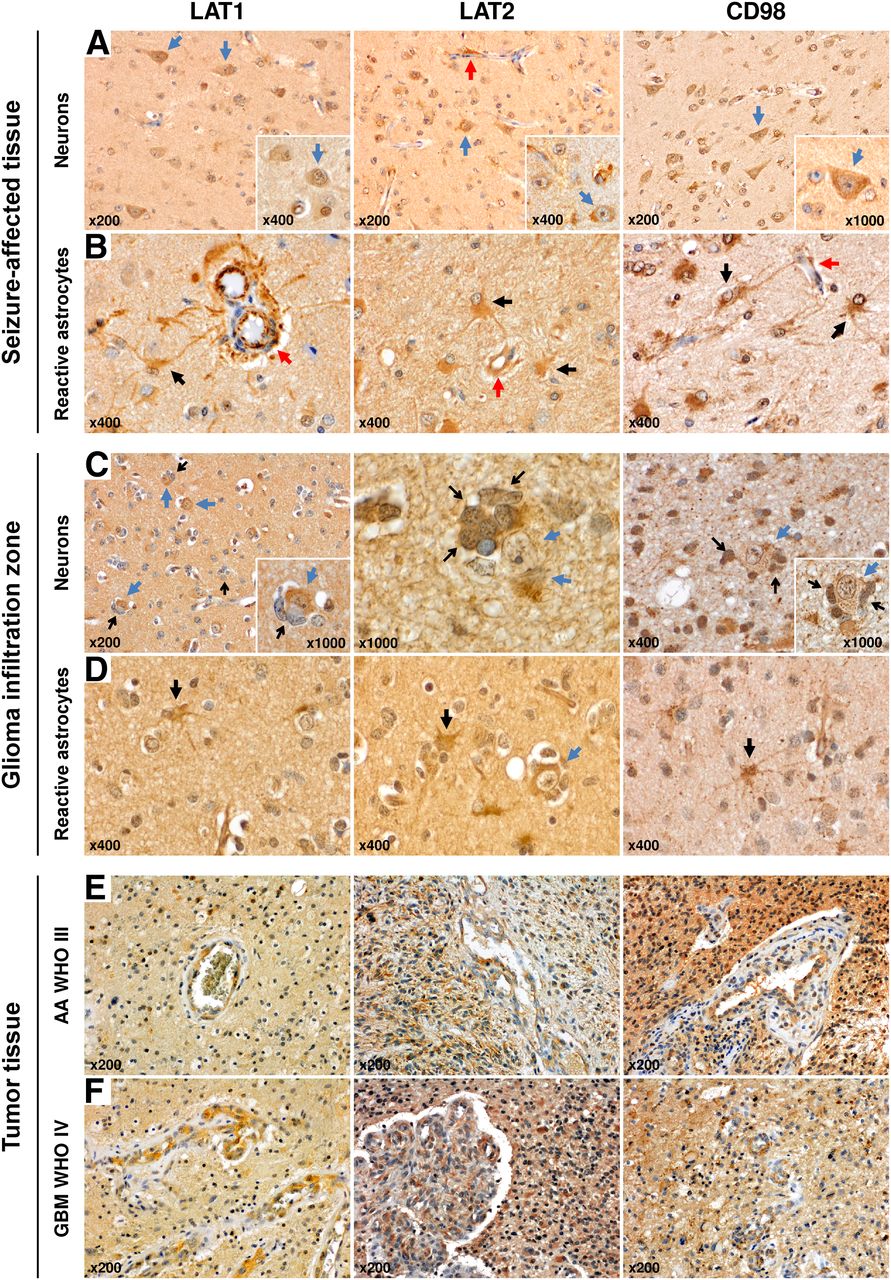
LAT1, LAT2, and CD98 protein expression pattern in seizure-affected and glioma tissue. (A) LAT1, LAT2, and CD98 showed strong and widespread expression in neurons of seizure-affected cortex obtained from patient with nonconvulsive SE and subtotal frontal lobe resection (case 3; Fig. 2; blue arrow, neuron; red arrow, vessel). (B) LAT1, LAT2, and CD98 were also detected in brain endothelial cells and reactive astrocytes (astrocyte–endothelium interaction as part of BBB; red arrow, vessel; black arrow, reactive astrocyte). Overall, LAT1, LAT2, and CD98 expression from neurons was more frequent than that from reactive astrocytes as reactive astrocytosis was only focally represented. (C) Within infiltration zone of astrocytoma WHO grade II cortical neurons revealed pronounced staining of LAT1/LAT2/CD98, in particular when glioma cells directly interact with neurons (tumor cells as satellites of neurons; blue arrow, neuron; open black arrow, satellitosis by tumor cells). (D) In addition, sporadic LAT1/LAT2/CD98-positive reactive astrocytes were observed within tumor infiltration zone. In comparison, tumor cells and tumor endothelium of anaplastic astrocytoma WHO grade III (E) and glioblastoma WHO grade IV (F) were also strongly positive for LAT1, LAT2, and CD98 expression.
Histopathologic Evaluation and Immunostaining
Because MRI and 18F-FET PET findings suggested tumor recurrence or progression, 3 patients underwent stereotactic biopsy or microsurgical resection of the putative lesions (patients 1, 3, and 6; Table 2). In those cases, standard neuropathologic evaluation of seizure-affected brain yielded cortical brain edema with reactive astrocytosis and microglial activation without any evidence of tumor cells.
On the basis of the known transport mechanisms of 18F-FET, additional immunohistochemical analysis of LAT1, LAT2, and CD98 protein expression was performed using FFPE tissue specimens derived from partial frontal lobe resection of seizure-affected brain tissue in MRI and 18F-FET PET (case 3; Figs. 2, 4A, and 4B) and tumor resection of a newly diagnosed glioblastoma WHO grade IV including histologic tumor-free cortex and subcortical tumor tissue (case 7). For comparison, 3 tissue samples from archival material with astrocytoma WHO grade II, anaplastic astrocytoma WHO grade III, and glioblastoma WHO grade IV were additionally evaluated (Figs. 4C–4F).
In seizure-affected cortex, LAT1/LAT2/CD98 amino acid transporter showed a strong and extended expression in neurons and brain endothelium (Figs. 4A and 4B) and was also detected in reactive astrocytes, especially when located adjacent to brain capillaries (Fig. 4B). Overall, LAT1/LAT2/CD98 staining in neurons and vascular endothelial cells was much more frequently observed than in reactive astrocytosis. Within the glioma infiltration zone, cortical neurons also revealed a pronounced expression of LAT1/LAT2/CD98, in particular when neurons and glioma cells interacted directly (tumor cells as satellites of neurons, Fig. 4C). Additionally, interspersed LAT1/LAT2/CD98-positive reactive astrocytes were observed (Fig. 4D). As expected, glioma and tumor-associated endothelial cells strongly expressed LAT1/LAT2/CD98 (Figs. 4E and 4F).
DISCUSSION
For the first time, we report a substantial increase of cortical amino acid transport assessed by 18F-FET PET during and after serial seizures or SE in patients with gliomas and nonneoplastic brain lesions. Elevated 18F-FET tracer uptake appears to be associated with cortical vasogenic and cytotoxic edema, hyperperfusion, and contrast enhancement in MRI. 18F-FET uptake was clearly not caused by tumor progression or relapse in the subgroup of glioma patients, as proven by multimodal long-term follow-up MR/PET imaging and histologic confirmation in 3 patients. Therefore, our observation represents a so far unknown limitation of 18F-FET PET in brain tumor diagnosis resembling periictal pseudoprogression.
18F-FET uptake values in SES and SE patients were similar to those observed in high-grade gliomas (LBRmax median ± SD, SES and SE vs. high-grade gliomas, 3.95 ± 1.02 vs. 2.04 ± 0.72) (1). In contrast, patients with frequent seizures but without SES and SE presented with lower and more focally pronounced cortical 18F-FET uptake, comparable with values seen in low-grade gliomas (LBRmax median ± SD, seizures vs. low-grade gliomas, 1.77 ± 0.05 vs. 1.52 ± 0.70) (1). In addition, the time–activity curve pattern of 18F-FET uptake corresponded to that described for low-grade gliomas (23). On the basis of these results, it appears that 18F-FET tracer uptake values, and possibly dynamic 18F-FET PET imaging, are not capable of distinguishing between seizure-induced alterations and tumor progression. In contrast, typical findings for seizure-induced 18F-FET tracer uptake were the strict gyral uptake pattern and the reversibility in follow-up-studies. Although methodologic differences between the neurooncology centers exist (Supplemental Table 1), quantification of tracer uptake should in principle lead to similar results. In any case, it can be assumed that the methodologic differences are less relevant for intraindividual courses.
Structural changes of the brain cortex in MRI are the most stereotypic imaging features suggesting seizure activity or SE (16). On this account, the combination of a strict gyral, and mostly extended, 18F-FET uptake associated with cortical MRI changes and high seizure activity, SE, or unusually prolonged postictal symptoms should raise the suspicion of periictal pseudoprogression. To avoid overtreatment, this phenomenon must be considered in the interpretation of 18F-FET PET images and clinical decision making, especially in patients with cerebral glioma and symptomatic epilepsy.
In general, transient postictal deficits are reversible within 36 h (12–14). In our study population, however, prolonged postictal symptoms were observed for up to 8 wk after seizure termination and were associated with structural and metabolic cortical changes of more than 1 lobe in MRI and 18F-FET PET. In all patients with follow-up investigations, increased gyral 18F-FET uptake, cortical edema, contrast enhancement, and hyperperfusion normalized in parallel with clinical symptoms and EEG findings. Therefore, if clinically justified, a close clinical, MRI and 18F-FET PET follow-up for at least 8 wk should be considered in these patients before therapeutic decisions, in particular invasive procedures, are undertaken.
Our findings also provide new insights into the pathophysiologic changes in seizure-associated cortical amino acid metabolism. Previous studies have shown that 18F-FET does not participate in specific metabolic pathways and is transported predominantly via the system L amino acid transporters LAT1 and LAT2 (3,4). In normal cerebral cortex, LAT1 protein is only moderately expressed and LAT2 protein is absent (24). In contrast, immunohistochemical analysis of tissue specimens derived from seizure-affected cortex revealed a strong expression of LAT1/LAT2/CD98 in neurons and brain endothelium, indicating a seizure-induced upregulation of LAT1/LAT2 transporter mediating cortical 18F-FET tracer uptake.
Interestingly, also neurons in the infiltration zone of glial tumors strongly expressed LAT1/LAT2/CD98, in particular when directly interacting with tumor cells as satellites (Fig. 4C). This observation supports the hypothesis of a link between LAT1/LAT2/CD98 expression and epileptogenesis, because in glial brain tumors epileptogenic activity arises in the cortex adjacent to the tumor, whereas the tumor itself is considered electrically inert with regard to seizure initiation (25). Structural and metabolic changes in the peritumoral tissue may lead to cortical cell alterations with imbalance between excitatory and inhibitory neurotransmitters, especially high intra- and peritumoral glutamate levels (25–27).
Reactive astrocytosis has been shown to be associated with increased 18F-FET uptake in various nonneoplastic brain lesions (e.g., inflammatory and demyelinating lesions, brain ischemia and hemorrhage, brain abscesses, and radiation necrosis), representing another potential pitfall in 18F-FET PET (1,6–10). In the presented group of patients, however, there were no clinical or radiologic signs that would have been consistent with 1 of these differential diagnoses. Furthermore, the presented lesions showed a strict gyral pattern, which is untypical for the lesions mentioned above and suggests a connection with an epileptogenic genesis. This notion is further supported by the fact that in specimens of seizure-affected cortex, LAT1/LAT2/CD98 was more strongly expressed in neurons and brain endothelium than in reactive astrocytes, indicating a predominant neuronal 18F-FET uptake during seizure activity.
Other aspects that need to be discussed concern the relationship of seizure-mediated increased 18F-FET uptake, regional blood flow, and BBB disruption. Numerous PET and SPECT studies using various tracers have shown that the cerebral blood flow is increased in the ictal and decreased in the interictal state (28). In the present report, enhanced cortical 18F-FET uptake was observed in brain areas with increased (Figs. 1–3) and decreased regional perfusion as well as increased (Supplemental Fig. 1) and decreased (Fig. 3) glucose metabolism. Similarly, previous studies have shown high 18F-FET uptake in gliomas with low cerebral blood flow or blood volume (29,30). Therefore, it is unlikely that increased 18F-FET uptake during seizure activity is caused by hyperperfusion to a major extent.
Along with gyral hyperperfusion most SES/SE patients developed a mixture of vasogenic and cytotoxic edema, and partly contrast enhancement in MRI, indicating enhanced permeability or disruption of the BBB. BBB dysfunction is one of the earliest pathophysiologic features of SE mediated by several mechanisms, including glutamate receptor activation of endothelial cells, rapidly activated brain inflammation, and seizure-associated angiogenesis (31,32).
Although a correlation between 18F-FET uptake and contrast enhancement in brain tumors has been reported (1), there are many examples of brain lesions with BBB disruption and contrast enhancement (e.g., radionecrosis, abscesses) that are clearly negative on 18F-FET PET. This observation excludes that 18F-FET uptake is significantly influenced by BBB disruption. Therefore, it is most likely that the observed phenomenon of increased 18F-FET uptake in epileptogenic brain areas is due to a process that mediates an upregulation of LAT1/LAT2/CD98 expression in neurons and the brain endothelium.
Enhanced amino acid uptake during seizure activity has also been discussed in a few case reports using 11C-methionine (33–35), which is also transported via LAT1/LAT2 (36). Moreover, increased amino acid uptake in epileptic foci was reported for PET using α-11C-methyl-l-tryptophan (37,38), which measures the serotonin synthesis rate. It was speculated that its increased uptake in epileptogenic tubers reflects changes in the kynurenine pathway. Since l-tryptophan is also a substrate of LAT1/LAT2 (39), it is tempting to hypothesize that increased α-11C-methyl-l-tryptophan uptake in epileptogenic foci has also been influenced by increased LAT1/LAT2 transport as observed in the present study for 18F-FET.
CONCLUSION
Seizure-induced increase of cerebral amino acid transport seems to be primarily mediated by neuronal, endothelial, and to a lesser extent astroglial LAT1/LAT2/CD98 expression. A strict gyral 18F-FET uptake in combination with cortical MRI changes, high seizure activity, and unusually prolonged postictal focal symptoms should raise the suspicion of periictal pseudoprogression. To avoid overtreatment, this phenomenon has to be considered in the interpretation of 18F-FET PET images, and a close clinical and MRI/18F-FET PET reevaluation for at least 8 wk should be considered.
DISCLOSURE
No potential conflict of interest relevant to this article was reported.
Acknowledgments
We thank Nicole Niemietz and Maria Hirblinger for excellent technical assistance. Parts of the study were presented at the 2014 Scientific Meeting of the Society for Neurooncology (SNO) as a poster.
Footnotes
Published online Jul. 28, 2016.
- © 2017 by the Society of Nuclear Medicine and Molecular Imaging.
REFERENCES
- Received for publication April 7, 2016.
- Accepted for publication June 29, 2016.


Jump to section
Related Articles
Cited By...
- Comprehensive Update and Review of Clinical and Imaging Features of SMART Syndrome
- Comprehensive Update and Review of Clinical and Imaging Features of SMART Syndrome
- Amino Acid PET in Neurooncology
- Amino Acid PET in Neurooncology
- Early Treatment Response Assessment Using 18F-FET PET Compared with Contrast-Enhanced MRI in Glioma Patients After Adjuvant Temozolomide Chemotherapy