


Abstract
The goal of this study was to compare the value of contrast-enhanced MRI and O-(2-[18F]fluoroethyl)-l-tyrosine (18F-FET) PET for response assessment in glioma patients after adjuvant temozolomide chemotherapy (TMZ). Methods: After biopsy or resection and completion of radiotherapy with concomitant TMZ, 41 newly diagnosed and histomolecularly characterized glioma patients (glioblastoma, 90%; age range, 20–79 y) were subsequently treated with adjuvant TMZ. MR and 18F-FET PET imaging were performed at baseline and after the second cycle of adjuvant TMZ. We obtained 18F-FET metabolic tumor volumes (MTVs) as well as mean and maximum tumor-to-brain ratios (TBRmean and TBRmax, respectively). Threshold values of 18F-FET PET parameters to predict outcome were established by receiver-operating-characteristic analyses using a median progression-free survival (PFS) of ≥ 9 mo and overall survival (OS) of ≥ 15 mo as reference. MRI response assessment was based on the Response Assessment in Neuro-Oncology (RANO) working group criteria. The predictive value of changes of 18F-FET PET and MRI parameters on survival was evaluated subsequently using univariate and multivariate survival estimates. Results: After 2 cycles of adjuvant TMZ chemotherapy, a treatment-induced reduction of MTV and TBRmax predicted a significantly longer PFS and OS (both P ≤ 0.03; univariate survival analyses) whereas RANO criteria were not significant (P > 0.05). Multivariate survival analysis revealed that TBRmax changes predicted a prolonged PFS (P = 0.012) and changes of MTV a prolonged OS (P = 0.005) independent of O6-methylguanine-DNA-methyltransferase promoter methylation and other strong prognostic factors. Conclusion: Changes of 18F-FET PET parameters appear to be helpful for identifying responders to adjuvant TMZ early after treatment initiation.
The prognosis of patients with glioblastoma is still relatively poor, with median overall survival (OS) rates ranging between 15 and 20 mo (1–3). Since 2005, first-line treatment has consisted of cytoreductive surgery, followed by radiotherapy with concomitant and adjuvant temozolomide (TMZ) chemotherapy, according to the EORTC-NCIC 22981/26981 protocol (1). More recently, in glioblastoma patients, further survival benefit has been achieved by adding tumor-treating fields concurrent to adjuvant TMZ chemotherapy (4,5), or by lomustine/TMZ combination chemotherapy in glioblastoma patients with O6-methylguanine-DNA-methyltransferase (MGMT) promoter methylation (6). Nevertheless, in many centers, radiotherapy with concomitant and adjuvant TMZ is still the standard of care.
For decades, the method of choice for treatment response assessment in brain tumor patients was contrast-enhanced anatomic MRI. Predominantly, changes of contrast enhancement are used as a surrogate of treatment response or tumor progression (7,8). However, contrast enhancement resulting from increased blood–brain barrier permeability is nonspecific and may not always be an accurate indicator of neoplastic tissue, tumor extent, or treatment effect (9–11). Importantly, since the introduction of chemoradiation with TMZ, there has been an increasing awareness of progressive enhancing lesions on MRI, which are related to the treatment. These findings eventually either remain stable or may ultimately even regress, as observed during follow-up MRI without any change of treatment. Accordingly, this phenomenon was termed pseudoprogression (12–14). Typically, this phenomenon occurs within the first 12 wk after chemoradiation completion (7) and may also occur beyond the 12-wk time window (15,16). Similarly, radiation necrosis, which usually manifests several months later than pseudoprogression, may also lead to contrast enhancement on MRI (17). Additionally, nonspecific contrast enhancement may result from postoperative inflammation, ischemia, and seizures (18,19). Consequently, alternative diagnostic methods are needed to improve the evaluation of treatment response.
In the recent past, numerous studies have shown that PET using the radiolabeled amino acid O-(2-[18F]fluoroethyl)-L-tyrosine (18F-FET) provides valuable additional diagnostic information for various indications in neurooncology, including the assessment of treatment response (20,21). Moreover, the Response Assessment in Neuro-Oncology (RANO) working group has emphasized that for gliomas and brain metastases, the additional clinical value of amino acid PET compared with standard MRI is excellent as it provides valuable diagnostic information for treatment response assessment (22,23).
However, studies evaluating the value of 18F-FET PET for treatment response assessment in glioma patients (24–27) are predominantly based on mostly heterogeneous patient groups (i.e., usually heavily pretreated glioma patients with different histomolecular diagnoses or inconsistent imaging time points). Additionally, very few studies have addressed the value of 18F-FET PET only for the assessment of response to chemoradiation with concurrent TMZ in newly diagnosed glioblastoma patients treated according to the EORTC/NCIC 22981/26981 trial (28–30).
To evaluate the response to adjuvant TMZ chemotherapy using 18F-FET PET and contrast-enhanced MRI, we performed a study in newly diagnosed glioma patients. We aimed to identify which 18F-FET PET parameter in comparison to MRI is best suited for predicting a significantly longer survival early after adjuvant TMZ treatment initiation.
MATERIALS AND METHODS
Patients
From 2015 to 2019, we examined 41 consecutive adult patients (mean age, 52 ± 13 y; age range, 20–79 y; 19 women) with a Karnofsky performance status ≥ 70% and newly diagnosed glioma (predominantly glioblastoma, 90%) using MR and 18F-FET PET imaging. All patients underwent resection or stereotactic biopsy and had histomolecularly confirmed gliomas and completed radiotherapy with concomitant TMZ chemotherapy according to the EORTC/NCIC 22981/26981 trial (1). Neuroimaging was performed at baseline (within 7 d before adjuvant TMZ initiation) and after the second cycle of adjuvant TMZ. Further details on the patients’ characteristics are listed in Table 1.
Patient Characteristics and Neuroimaging Findings
Treatment and Follow-up
After resection or biopsy, all patients were treated with radiotherapy (60 Gy) and concomitant and adjuvant TMZ chemotherapy over 6 cycles according to the EORTC/NCIC 22981/26981 trial (1). Contrast-enhanced conventional MRI was performed within the first 48 h after resection and every 8–12 wk. Patients were assessed by neurologic examination and the Karnofsky performance score at baseline and every 8–12 wk during the treatment and after treatment completion. The patients’ outcome was prospectively followed. The progression-free survival (PFS) was defined as the time interval between histomolecularly confirmed glioma diagnosis and tumor progression according to RANO criteria (7). The OS was defined as the time interval between histomolecularly confirmed glioma diagnosis and death.
Conventional MR Imaging
In accordance with the International Standardized Brain Tumor Imaging Protocol (31), MRI was performed using a 1.5-T or 3.0-T MRI scanner with a standard head coil before and after administration of a gadolinium-based contrast agent (0.1 mmol/kg body weight). The sequence protocol comprised 3-dimensional (3D) isovoxel T1-weighted, 2-dimensional (2D) T2-weighted, and 2D fluid-attenuated inversion recovery-weighted sequences. MRI changes at first follow-up compared with the baseline scan were assigned according to the RANO criteria (7). The criteria for stable disease, partial response, and complete response were considered for assessing the response to treatment.
18F-FET PET Imaging
As described previously, the amino acid 18F-FET was produced via nucleophilic 18F-fluorination with a radiochemical purity of greater than 98%, molar radioactivity greater than 200 GBq/μmol, and a radiochemical yield of about 60% (32). According to international guidelines for brain tumor imaging using labeled amino acid analogs (33), patients fasted for at least 4 h before the PET measurements. All patients underwent a dynamic PET scan from 0 to 50 min after injection of 3 MBq of 18F-FET per kg of body weight at baseline (within 7 d before starting of adjuvant TMZ) and after the second cycle of adjuvant TMZ. PET imaging was performed either on an ECAT Exact HR+ PET scanner in 3D mode (n = 64 scans; Siemens; axial field of view, 15.5 cm) or simultaneously with 3T MRI using a BrainPET insert (n = 15 scans; Siemens; axial field of view, 19.2 cm). The BrainPET is a compact cylinder that fits into the bore of the Magnetom Trio MR scanner (34).
Iterative reconstruction parameters were 16 subsets, 6 iterations using the ordered-subset expectation maximization (OSEM) algorithm for the ECAT HR+ PET scanner and 2 subsets, 32 iterations using the ordinary Poisson-OSEM algorithm for the BrainPET. Data were corrected for random and scattered coincidences, dead time, and motion for both systems. Attenuation correction for the ECAT HR+ PET scan was based on a transmission scan, and for the BrainPET scan on a template-based approach (34). The reconstructed dynamic datasets consisted of 16 time frames (5 × 1 min; 5 × 3 min; 6 × 5 min) for both scanners.
To optimize the comparability of the results related to the influence of the 2 different PET scanners, reconstruction parameters, and postprocessing steps, a 2.5-mm 3D gaussian filter was applied to the BrainPET data before further processing. In phantom experiments using spheres of different sizes to simulate lesions, this filter kernel demonstrated the best comparability between PET data obtained from the ECAT HR+ PET and the BrainPET scanner (35).
18F-FET PET Data Analysis
For the evaluation of 18F-FET data, summed PET images over 20–40 min after injection were used. Mean tumoral 18F-FET uptake was determined by a 2D auto-contouring process using a tumor-to-brain ratio (TBR) of at least 1.6. This cutoff was based on a biopsy-controlled study in glioma patients and differentiated best between tumoral and peritumoral tissue (36). A circular region of interest (ROI) with a diameter of 1.6 cm was centered on the maximal tumor uptake for the evaluation of the maximal 18F-FET uptake, as previously reported (37). Mean and maximum TBRs (TBRmean and TBRmax, respectively) were calculated by dividing the mean and maximum SUV of the tumor ROI by the mean SUV of a larger ROI placed in the semioval center of the contralateral unaffected hemisphere including white and gray matter (33). The calculation of 18F-FET metabolic tumor volumes (MTVs) was determined by a 3D auto-contouring process using a threshold of 1.6, using PMOD (version 3.505; PMOD Technologies Ltd.).
Neuropathologic Tumor Classification and Analysis of Molecular Markers
All tumors were histomolecularly classified according to the World Health Organization (WHO) Classification of Tumors of the Central Nervous System of 2016 (38). For molecular biomarker analysis, tumor DNA was extracted from formalin-fixed and paraffin-embedded tissue samples with a histologically estimated tumor cell content of 80% or more. For assessment of the isocitrate dehydrogenase (IDH) mutation status, the presence of an IDH1-R132H mutation was evaluated by immunohistochemistry using a mutation-specific antibody in a standard immunohistochemical staining procedure as reported (39,40). If immunostaining for IDH1-R132H remained negative, the mutational hot spots at codon 132 of IDH1 and codon 172 of IDH2 were directly sequenced as reported (41,42). The MGMT promoter methylation status was assessed by methylation-specific polymerase chain reaction, as described elsewhere (42).
Statistical Analysis
Descriptive statistics are provided as mean and SD or median and range. The Student t test was used to compare 2 groups. The Mann–Whitney rank-sum test was used when variables were not normally distributed. The diagnostic performance of MRI for predicting a favorable PFS and OS were calculated using 2 × 2 contingency tables; statistical significance was determined by the Pearson χ2 test.
The prognostic value of the absolute 18F-FET PET parameters TBRmax, TBRmean, and MTV was assessed by receiver-operating-characteristic (ROC) curve analyses using a favorable PFS and OS as reference. Favorable outcome was defined as a PFS ≥ 9 mo and an OS ≥ 15 mo. These outcome thresholds were adopted from a previous response assessment study of our group in glioblastoma patients treated with temozolomide chemoradiation (28). In that study, the median PFS was 7.2 mo and the median OS 14.1 mo, similar to the survival reported in the EORTC-NCIC 22981/26981 trial (PFS, 6.9 mo; OS, 14.6 mo) (1). Thus, slightly higher values for PFS and OS were considered as favorable outcome thresholds. Decision cutoff was considered optimal when the product of paired values for sensitivity and specificity reached its maximum. As a measure of the test’s diagnostic quality, the area under the ROC curve (AUC), its SE, and level of significance were determined. Only patients with uncensored survival data were included in ROC analyses for the evaluation of the diagnostic performance. Additionally, the value of relative changes of TBRmax, TBRmean, and MTV to predict a significantly longer PFS and OS as an indicator for response to adjuvant TMZ was evaluated using a threshold of ≤ 0% vs. > 0%, as reported (28).
Univariate survival analyses were performed using Kaplan–Meier estimates. The log-rank test was used for comparison of the median PFS and OS between the subgroups. Patients were censored if the event (progression or death) had not occurred at the time of data evaluation (April 2020). Parameters that were significant in univariate analyses were included in multivariate models. Multivariate Cox proportional hazards models were constructed to test the relationship between relative changes of 18F-FET PET parameters and other strong prognostic factors (i.e., age, extent of resection, MGMT promoter methylation, and MTV or TBRmax at baseline) for a favorable survival as an indicator for response to adjuvant temozolomide chemotherapy. This analysis was done for each 18F-FET PET imaging parameter separately (i.e., for relative TBRmax and MTV change). Hazard ratios (HRs) and their 95% CIs were calculated.
P values of 0.05 or less were considered significant. Statistical analyses were performed using SPSS statistics (Release 25.0; SPSS Inc.).
RESULTS
Patients
Forty-one patients (mean age, 52 ± 13 y; age range, 20–79 y; 19 women) with newly diagnosed glioma (WHO grade IV glioblastoma, IDH-wildtype, n = 32; WHO grade IV glioblastoma, IDH-mutant, n = 3; WHO grade IV glioblastoma, not otherwise specified, n = 2; WHO grade III anaplastic astrocytoma, IDH-wildtype, n = 2; WHO grade II astrocytoma, IDH-wildtype, n = 1; WHO grade IV H3 K27-mutant diffuse midline glioma, n = 1) were examined. Sixteen patients had a methylated MGMT promoter (39%), and in 11 patients a complete tumor resection (27%) could be obtained. All 41 patients completed baseline 18F-FET PET and MRI (100%). At follow-up, 18F-FET PET in combination with MRI was available in 38 patients (93%). Because of subsequent clinical deterioration, 3 of 41 (7%) patients were not able to undergo follow-up 18F-FET PET imaging. At the time of data evaluation, tumor progression, according to RANO criteria, had occurred in 37 patients (90%) and death in 33 patients (80%). In the whole cohort, the median PFS was 9 mo (range, 3–54 mo), and the median OS was 14 mo (range, 5–54 mo). Further details regarding the patient characteristics and neuroimaging findings at baseline and follow-up are shown in Table 1.
Prognostic Value of 18F-FET Imaging Parameters as Assessed by ROC Analyses
The results of ROC analyses of absolute 18F-FET PET parameters for predicting a favorable PFS of ≥ 9 mo or an OS of ≥ 15 mo are presented in Supplemental Tables 1 and 2 (supplemental materials are available at http://jnm.snmjournals.org). Predominantly, all 18F-FET PET parameters at baseline and follow-up significantly predicted a favorable PFS or OS (range of AUC values, 0.73–0.86). Highest accuracies (AUC ≥ 0.80) to predict a favorable PFS were observed for TBRmax and MTV both at baseline and at follow-up, and for MTV at follow-up to predict a favorable OS. Of these significant prognostic 18F-FET PET imaging parameters, parameters at baseline (before start of adjuvant TMZ therapy) were selected for univariate survival analyses.
Univariate Survival Analyses Regarding Baseline Prognostic Factors and 18F-FET PET Imaging Parameters
Patients with completely resected tumors or an age ≤ 65 y had no significantly longer PFS or OS (Table 2). In contrast, patients with MGMT promoter–methylated tumors had a significantly longer PFS (12 vs. 8 mo; P = 0.010) and OS (21 vs. 13 mo; P = 0.030) (Table 2). Regarding 18F-FET PET parameters, patients with an absolute MTV of ≤ 28.2 mL or a TBRmax ≤ 2.0 at baseline had an almost doubled PFS (both 11 vs. 6 mo; P < 0.001 and P = 0.004, respectively). Additionally, an absolute MTV of ≤ 13.8 mL at baseline predicted a significantly longer OS (22 vs. 12 mo; P = 0.010) (Table 2).
Univariate Survival Analyses Regarding General Prognostic Factors and 18F-FET PET Imaging Parameters
Univariate Survival Analysis Regarding Changes of Imaging Parameters During Adjuvant TMZ Therapy
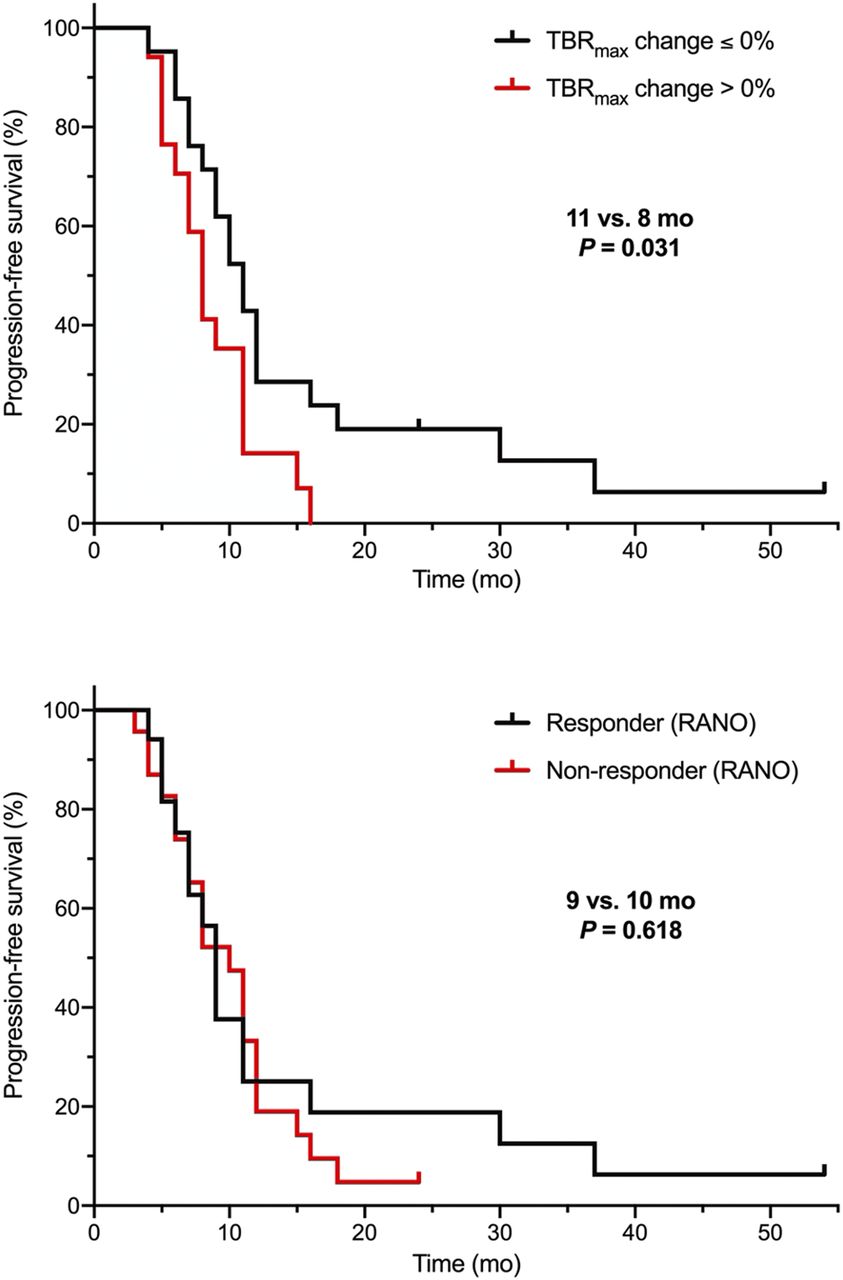
After application of 2 cycles of adjuvant TMZ, relative changes of TBRmax and MTV predicted a significantly (P = 0.031 and 0.007, respectively) longer PFS (both 11 vs. 8 mo) (Table 3). Relative changes of TBRmax and MTV after 2 cycles of adjuvant TMZ predicted also a significantly longer OS (24 vs. 12 mo; P = 0.032, and 29 vs. 12 mo; P = 0.005) (Table 3). Conversely, both the PFS and OS in responding patients on MRI (i.e., MRI findings consistent with Stable Disease or Partial Response according to RANO) was not significantly prolonged (9 vs. 10 mo; P = 0.618, and 16 vs. 17 mo; P = 0.752) (Figs. 1 and 2).
Univariate Survival Analysis Regarding Changes of Imaging Parameters During Adjuvant Temozolomide Therapy

Kaplan–Meier curves for PFS separated by relative changes of TBRmax on 18F-FET PET (top) and RANO criteria for MRI (bottom) after 2 cycles of adjuvant temozolomide. Responders on 18F-FET PET defined by any decrease or an unchanged TBRmax at follow-up compared with baseline had a significantly longer PFS than nonresponders (i.e., patients with an increase of TBRmax at follow-up compared with baseline) (11 vs. 8 mo; P = 0.031). On the other hand, PFS of responders according to RANO criteria regarding MRI was not significantly longer than in nonresponders.
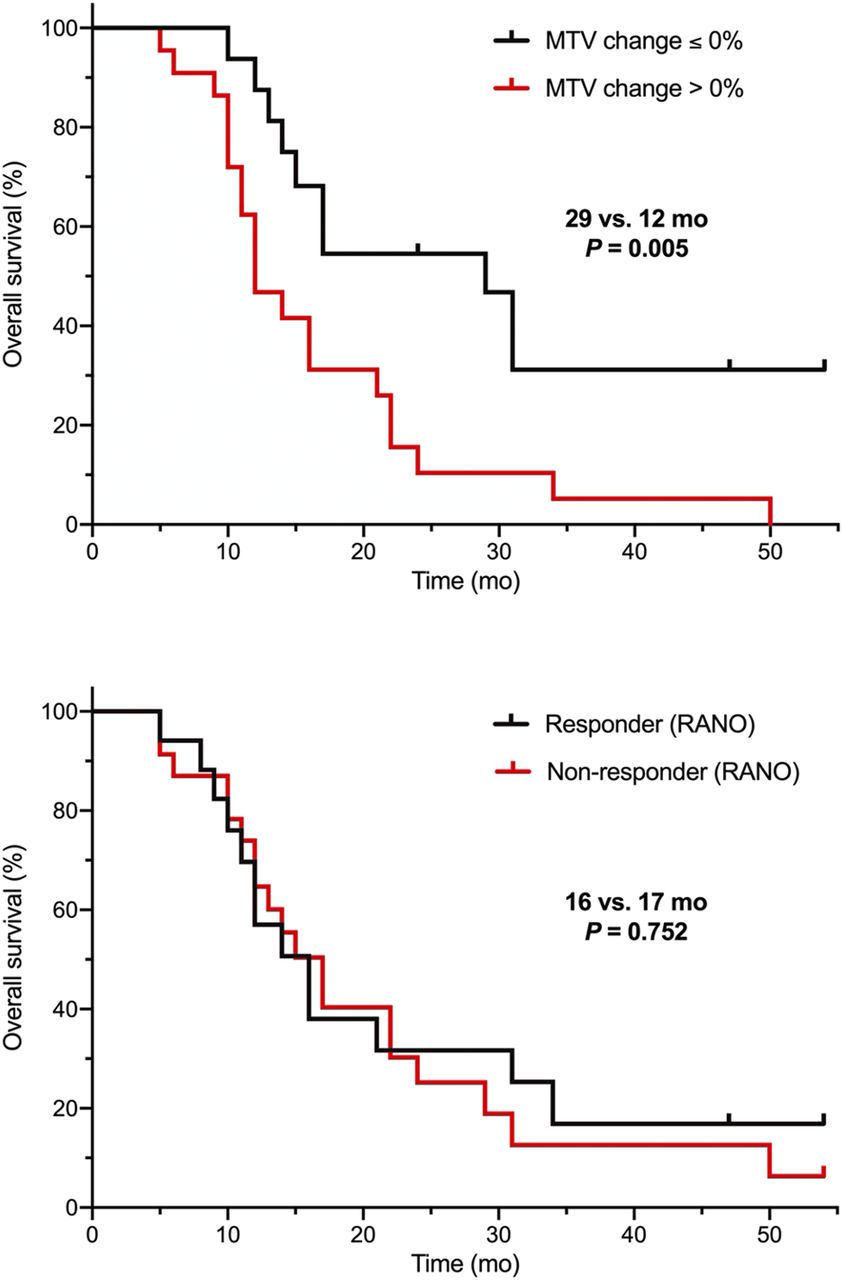
Kaplan–Meier curves for OS separated by relative MTV changes on 18F-FET PET (top) and RANO criteria for MRI (bottom) after 2 cycles of adjuvant temozolomide. Responders on 18F-FET PET defined by any decrease or an unchanged MTV at follow-up compared with baseline had a significantly 2.4-fold-longer OS than patients with an increase of MTV at follow-up compared with baseline (29 vs. 12 mo; P = 0.005). In contrast, OS of responders according to RANO criteria regarding MRI was not significantly longer than in nonresponders.
Multivariate Survival Analysis Regarding Changes of Imaging Parameters During Adjuvant TMZ Therapy
A TBRmax reduction was a significant parameter in the multivariate survival analysis (P = 0.012; HR, 2.920; 95% CI, 1.272–6.705), which predicts a significantly longer PFS (Table 2) independent of age, extent of resection, MGMT promoter methylation, and TBRmax at baseline. Furthermore, relative reductions of both TBRmax and MTV after 2 cycles of adjuvant TMZ predicted significantly longer OS (Table 4). A change of MTV after 2 cycles of adjuvant TMZ was the most significant parameter independent of age, extent of resection, MGMT promoter methylation, and MTV at baseline (P = 0.005; HR, 3.614; 95% CI, 1.481–8.820). Thus, a decrease of these 18F-FET PET parameters appears to be associated with response to adjuvant temozolomide chemotherapy.
Multivariate Survival Analysis of Changes of 18F-FET PET Imaging Parameters
DISCUSSION
The main finding of the present study is that relative changes of MTV and TBRmax obtained from 18F-FET PET provide valuable clinical information on tumor response to adjuvant TMZ after completion of radiotherapy with concurrent TMZ in patients with newly diagnosed glioma. Importantly, this information cannot be derived from an MRI response assessment based on RANO criteria. In contrast to MRI, relative MTV and TBRmax changes predicted both a significantly longer PFS (≥9 mo) and a significantly longer OS (≥15 mo), indicating that 18F-FET PET is a powerful tool for the evaluation of treatment effects. Moreover, prediction of response to adjuvant TMZ using these 18F-FET PET parameters was possible irrespective of MGMT promoter methylation and other strong prognostic factors. Thus, our data suggest that 18F-FET PET is highly sensitive in the early response assessment of adjuvant TMZ, which could be useful for patient management, for example, the diagnosis of pseudoprogression or reevaluation of other treatment options in the case of early tumor progression (Fig. 3). Furthermore, for the patient, the patient’s relatives, and the treating physician it is of great importance whether a favorable or unfavorable clinical course can be expected. Moreover, on the basis of the response assessment, treatment decisions may be facilitated, for example, an earlier change to a second-line therapy.
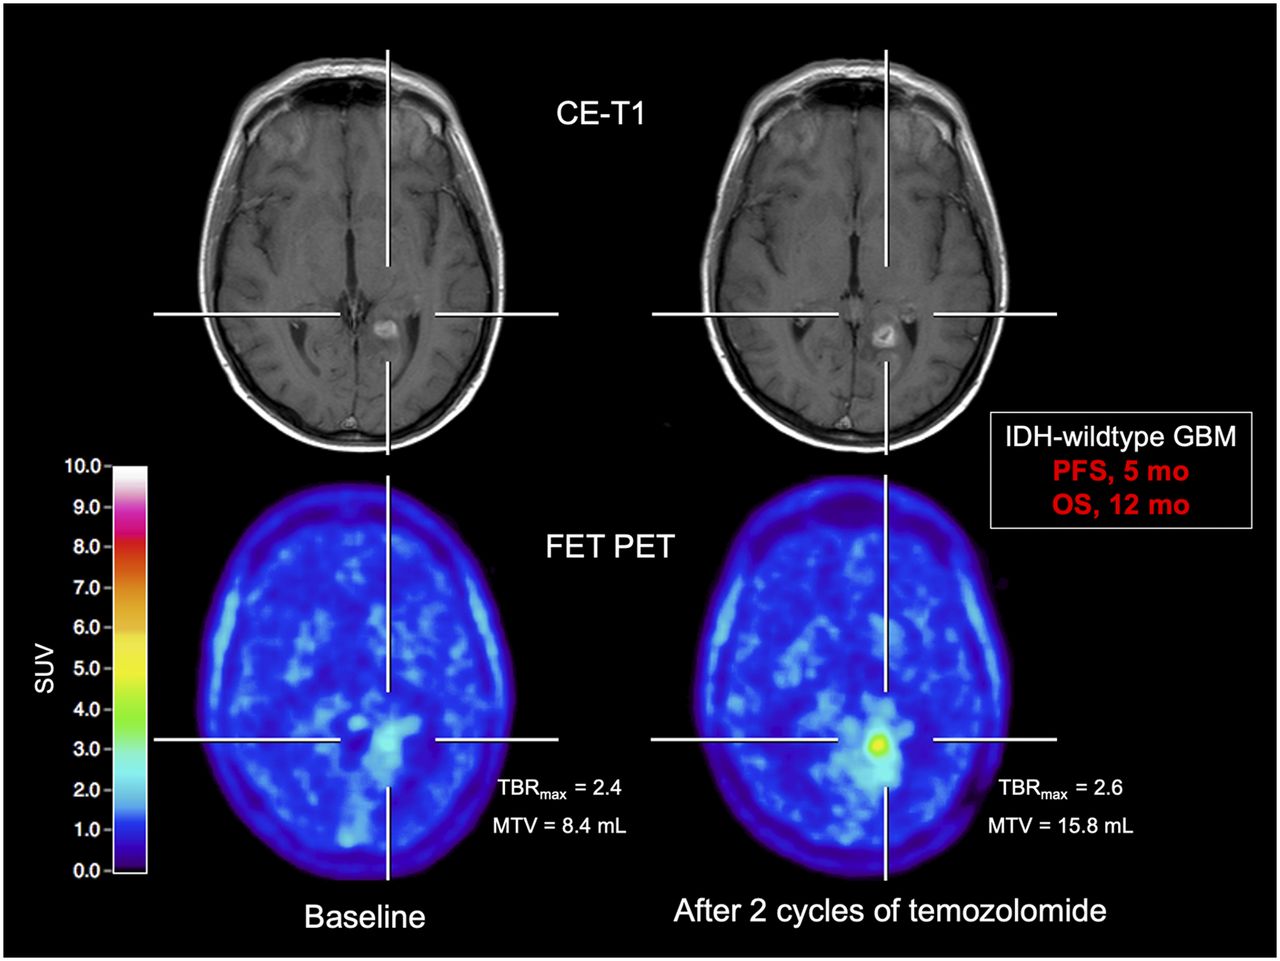
Patient with an IDH-wildtype glioblastoma (GBM) with unfavorable survival (patient 8). After 2 cycles of adjuvant temozolomide chemotherapy, the contrast-enhancing lesion on MRI is slightly enlarged (criterion progressive disease according to RANO criteria not fulfilled) compared with baseline MRI (upper row). In contrast, corresponding 18F-FET PET at follow-up shows relative to baseline scan (bottom row) an increase of metabolic activity as assessed by TBRmax and MTV (relative increase, 8% and 88%, respectively). Patient had unfavorable outcome with a PFS of 5 mo and an OS of 12 mo.
Our findings are in line with a previous study assessing the evaluation of response to radiotherapy in glioblastoma patients. That prospective study evaluated the predictive value of early TBR changes of 18F-FET uptake after postoperative radiotherapy with concurrent TMZ in patients with newly diagnosed glioblastoma (28,30). 18F-FET PET was performed at baseline (before chemoradiation) and early after chemoradiation completion (i.e., after 7–10 d and 6–8 wk later). One main finding of that study was that a relative decrease of TBRs related to radiotherapy with concurrent TMZ was associated with a significantly longer survival (i.e., PFS and OS). Furthermore, and consistent with our findings, the authors observed that 18F-FET PET tumor volume changes (MTV) relative to baseline were also associated with a significantly longer OS. However, in that study, the value of 18F-FET PET for the evaluation of effects to adjuvant TMZ after chemoradiation completion was not assessed. In addition to the latter study evaluating the effects of radiotherapy with concurrent TMZ on 18F-FET PET parameters and survival (28,30), we here observed the additional value of relative MTV change for the prediction of response to adjuvant TMZ chemotherapy.
The value of the relative MTV change has also been reported for the evaluation of the effects of other neurooncologic treatment options such as antiangiogenic therapy. In a prospective study by Schwarzenberg et al., predominantly heavily pretreated progressive glioma patients underwent bevacizumab and irinotecan therapy. They were examined using standard MRI and 3,4-dihydroxy-6-[18F]fluoro-l-phenylalanine (18F-FDOPA) amino acid PET at baseline and early after starting the therapy (i.e., after 2 wk and after 6 wk) (43). Consistent with our study, the relative 18F-FDOPA MTV change relative to baseline after bevacizumab and irinotecan predicted a significantly prolonged OS. Additionally, a prospective study by our group has also highlighted the value of MTV for the evaluation of response to bevacizumab plus lomustine (44). In that study, IDH-wildtype glioblastoma patients at first progression were treated with bevacizumab plus lomustine. Contrast-enhanced MRI and 18F-FET PET were performed at baseline and follow-up after 8–10 wk. Again, relative MTV changes enabled an OS prediction early after treatment initiation.
Furthermore, the predictive value of relative MTV changes has also been reported in patients with nonenhancing WHO grade II or III glioma treated with alkylating chemotherapy (TMZ or lomustine plus procarbacine) (26).
CONCLUSION
18F-FET PET–derived imaging parameters can be used to predict response to adjuvant TMZ chemotherapy and may thus provide important information concerning the patient’s PFS and OS. In particular, parameters derived from 18F-FET PET, such as relative MTV changes, appear to be a powerful tool for identifying responders to adjuvant TMZ early after treatment initiation irrespective of MGMT promoter methylation. Our results suggest that 18F-FET PET is a valuable diagnostic tool for treatment monitoring including response assessment and justifies its use in clinical routine. An important next step to evaluate the additional clinical value of 18F-FET PET is the monitoring of newer treatment options such as targeted therapy or immunotherapy, ideally in a prospective setting.
DISCLOSURE
The Wilhelm-Sander Stiftung, Germany, supported this work. No other potential conflict of interest relevant to this article was reported.
KEY POINTS
QUESTION: Is 18F-FET PET superior to conventional MRI for predicting a significantly longer survival early after adjuvant temozolomide chemotherapy initiation?
PERTINENT FINDINGS: The response to adjuvant temozolomide chemotherapy was evaluated in 41 newly diagnosed and histomolecularly defined glioma patients using 18F-FET PET and contrast-enhanced MRI. Already after 2 cycles, uni- and multivariate survival analyses revealed that a reduction of 18F-FET PET parameters compared with the baseline scan predicted a significantly longer PFS and OS whereas standard MRI response criteria were not significant.
IMPLICATIONS FOR PATIENT CARE: In contrast to conventional MRT, changes of 18F-FET PET parameters appear to be helpful for identifying responders after 2 cycles of temozolomide chemotherapy, which could be useful for patient management such as the diagnosis of pseudoprogression or reevaluation of other treatment options.
ACKNOWLEDGMENTS
All subjects gave prior written informed consent for their participation in the 18F-FET PET study and evaluation of their data for scientific purposes. The local ethics committee approved the evaluation of retrospectively collected neuroimaging data. All procedures performed in studies involving human participants followed the national ethical standards and the Declaration of Helsinki.
Footnotes
Published online Nov. 6, 2020.
- © 2021 by the Society of Nuclear Medicine and Molecular Imaging.
REFERENCES
- Received for publication July 28, 2020.
- Revision received October 8, 2020.


