


Abstract
The advancement of breast cancer therapy is limited by the biologic behaviors of cancer cells, such as metastasis and recurrence. β-adrenoceptors (ADRB) are reported to be associated with the biologic behaviors of breast cancer and may influence glucose metabolism. Here, we sought to investigate the relationship between the activation of ADRB and the expression of glucose transporter (GLUT)-1 and hexokinase (HK)-2 and to clarify the impact of ADRB on 18F-FDG PET imaging in breast cancer. Methods: ADRB1/2 expression in 4T1, MDA-MB-231, and MCF-7 breast cancer cell lines was detected by Western blotting and immunofluorescence. ADRB-dependent regulation of GLUT-1 and HK-2 was determined by in vitro pharmacologic intervention. 4T1 breast cancer cells were treated with phosphate-buffered saline, isoproterenol, or propranolol, and the transcription and expression of GLUT-1 and HK-2 were measured by quantitative real-time polymerase chain reaction (RT-PCR) and Western blotting, respectively. ADRB1/2 was, respectively, blocked by small-interfering RNA to investigate the direct relationship between ADRB1/2 and HK-2. To evaluate the impact of ADRB on 18F-FDG PET imaging, BALB/c mice bearing 4T1 tumors were injected with phosphate-buffered saline, isoproterenol, or propranolol, and 18F-FDG PET imaging was performed. The tumor-to-nontumor (T/NT) values of tumors and brown adipose tissue were calculated by defining the liver as a reference. The in vivo expression of GLUT-1 and HK-2 was observed by immunohistochemical analysis and Western blotting. Results: MDA-MB-231, MCF-7, and 4T1 breast cancer cells were positive for ADRB1/2 expression. The protein expression and posttranscriptional level of HK-2 were significantly decreased by treatment with propranolol in vitro, whereas GLUT-1 expression was not significantly altered by pharmacologic intervention. The expression of HK-2 could be reduced in ADRB2-blocked 4T1 cells. Mice in the propranolol-treated group exhibited lower T/NT values for the tumors and brown adipose tissue than the control group. Immunohistochemical analysis and Western blotting revealed reduced HK-2 expression in the tumors of propranolol-treated mice. Conclusion: The expression of HK-2 was regulated by the activation of ADRB2 in 4T1 breast cancer cells primarily at the posttranscriptional level. Additionally, propranolol prevented glucose metabolism and 18F-FDG PET imaging of 4T1 breast cancer tumors.
Breast cancer is the most frequently diagnosed cancer and the leading cause of cancer death among women, accounting for 23% of all cancer cases and 14% of cancer deaths in 2011 (1). Thanks to the advancement of treatment, the 5-y survival rate of patients with breast cancer has already risen to approximately 77.5%–90.3% (2); however, the issue of tertiary prevention is still challenging. For example, about 1 in 5 breast cancer survivors who are disease-free for 5 y after adjuvant and neoadjuvant systemic therapy suffer a recurrence within 10 y after the end of treatment (3).
Recently, accumulating clinical evidence has strongly indicated that propranolol (PROP), a commonly used β1/β2 adrenoceptor (ADRB1/2) blocker, could significantly reduce the progression of cancer stage, metastasis development, and tumor recurrence in breast cancer patients and improve their disease-free interval and relapse-free survival (4,5). In particular, treatment with PROP resulted in a 57% reduced risk of metastasis and a 71% reduction in breast cancer mortality after 10 y (6).
Results from preclinical studies suggested that epinephrine and norepinephrine, released by the sympathetic nerve system, which is responsible for stress responses, could activate ADRB and thereby promote the proliferation, invasion, angiogenesis, and antiapoptotic response of cancer cells, ultimately increasing the potential for recurrence and metastasis. Propranolol-mediated downregulation of ADRB is thought to contribute to its repressive effects on breast cancer (7–13). These studies partly explain the preventive effect of PROP on breast cancer; however, the relationship between ADRB and metabolic pathways in cancer has not been uncovered yet.
The enhancement of glucose metabolism in cancer, which is well known as the Warburg effect, is one of the key characteristics and indispensable behaviors of most of cancers (14,15). Therefore, 18F-FDG, a radionuclide-labeled glucose analog, can be an excellent tracer to visualize glucose metabolism and cancer lesions in the clinic. Glucose transporter-1 (GLUT-1) and hexokinase-2 (HK-2) are among the major proteins regulating the transportation and transformation of glucose, respectively, and they are closely related to the rate of 18F-FDG uptake in cancers, including breast cancer (16–18). Moreover, a series of preclinical and clinical studies demonstrated that PROP had an intense negative effect on the 18F-FDG uptake of brown adipose tissue (BAT) (19–23). The above conclusions strongly suggest that there is a similarly close relationship between the activity of ADRB and glucose metabolism/18F-FDG uptake in breast cancer, mediated through changes in the expression of either GLUT-1 or HK-2.
In this study, we aimed to investigate the relationship between the activation of ADRB and the expression of GLUT-1 and HK-2 and to test the effects of PROP intervention on glucose metabolism and 18F-FDG PET imaging in a mouse breast cancer model.
MATERIALS AND METHODS
Cell Line and Culture Condition
The mouse breast carcinoma cell line 4T1 and the human breast carcinoma cell lines MDA-MB-231 and MCF-7 were kept in the culture medium recommended by American Type Culture Collection containing 10% fetal calf serum in a 37°C humidified atmosphere with 5% CO2.
Immunofluorescence
Cells were fixed for 8–10 min with 4% paraformaldehyde in phosphate buffer, pH 7.3, containing 4% sucrose and permeabilized in phosphate-buffered saline (PBS) containing 0.3% Triton X-100 (Shanghai Sangon). Sections were then blocked for 1 h at room temperature with 1% bovine serum albumin and incubated with ADRB1 antibody (1:100; Sigma-Aldrich) or ADRB2 antibody (1:100; Abcam) for 1 h at room temperature. Cells were washed with PBS and incubated with fluorescent secondary tetramethyl rhodamine isothiocyanate antibodies (1:200; EarthOx) for 2 h at room temperature. After being washed 5 times, the slices were mounted with medium containing 4′,6-diamidino-2-phenylindole. Images were acquired with a fluorescence microscope (Olympus) and processed using Image-Pro Plus (Media Cybernetics).
Pharmacologic Interventions
For in vitro pharmacologic interventions, 4T1 cells were planted in 6-well plates at a concentration of 5 × 10⁵ cells per well. The β-adrenergic receptor agonist and antagonist were dissolved in PBS, filtered, and added to the medium of 4T1 cells 24 h after plating. The concentrations of the drugs were determined according to previous studies (24). The grouping was as follows: isoproterenol hydrochloride (Shanghai Harvest) was diluted to 10 μM for the isoproterenol-treated (ISO) group, and propranolol hydrochloride (Sigma-Aldrich) was diluted to 25 μM for the low-dose PROP (PROP-L) group or 50 μM for the high-dose PROP (PROP-H) group. The natural control (NC) group was treated with filtered PBS only. Cells were harvested 30 min after pharmacologic interventions for Western blotting and quantitative real-time (RT) reverse transcription polymerase chain reaction (PCR).
For in vivo pharmacologic interventions, mice models of breast cancer were established. Animal care and protocols were approved by the Fourth Military Medical University Animal Studies Committee (protocol 090260). All animal experiments were conducted in compliance with guidelines of the Institutional Animal Care and Use Committee and the Guide for the Care and Use of Laboratory Animals (25). Eight-week-old female BALB/c mice were purchased from the experimental animal center of the Fourth Military Medical University. Food and water were given ad libitum. 4T1 cells (106) were suspended in 100 μL of PBS and injected subcutaneously in the right flank of BALB/c mice. Tumor size was measured using digital calipers, and tumor volume was calculated as (length × width2)/2. BALB/c mice bearing 4T1 breast cancer tumors were available in about 10 d, when tumor volumes reached 150 mm3.
Animal models were randomly divided into 3 groups (n = 8 mice per group) and treated with PBS (NC group), propranolol (10 mg/kg, PROP group), or isoproterenol (10 mg/kg, ISO group) by intraperitoneal injection 1 h before 18F-FDG injection. The dosage and the time point for 18F-FDG injection were determined according to a previous report (26) and our preliminary studies. All mice were kept under nonfasted conditions and were housed at a constant room temperature of 21°C to avoid the influence of external factors on glucose uptake.
RNA Interference and Quantitative RT Reverse Transcription PCR
4T1 cells were planted in 6-well plates and transfected with 50 nM small-interfering RNA (siRNA) targeting ADRB1 (for-5′-GCUCUGGACUUCGGUAGAUdTdT-3′, rev-3′-dTdTCGAGACCUGAAGCCAUCUA-5′) or ADRB2 (for-5′-CCAUCCUCAUGUCGGUUAUdTdT-3′, rev-3′-dTdT GGUAGGAGUACAGCCAAUA-5′) or negative reference sequence (RIBOBIO) using Lipofectamine 2000 (Invitrogen) according to the manufacturer’s instructions. Forty-eight hours later, cells were harvested for RNA or protein extraction.
Total RNA was extracted by RNAiso reagent (TAKARA Bio), and reverse transcription was performed using an oligo(dT) primer and RevertAid First Strand cDNA Synthesis Kit (Life Tech). Quantitative PCR (qPCR) amplification was performed using Thunderbird SYBR qPCR Mix (TOYOBO) following the manufacturer’s instructions. The thermal profile was set as follows: 95°C for 1 min and 40 cycles at 95°C for 15 s, 58°C for 20 s, and 72°C for 20 s. Control reactions were performed in the absence of reverse transcriptase to exclude the possibility of genomic contamination. Melting curve analysis was included at the end of the qPCR to detect unspecific amplifications. The results were calculated using the 2−ΔΔCt method, allowing for the normalization to β-actin with the calibrator set to a value of 1. The pairs of primer are listed in Table 1.
Primers Used in Quantitative RT PCR Experiments
Western Blotting
Western blotting was performed to detect the expression of ADRB1/2, GLUT-1, and HK-2 in cells or tissues. Briefly, after lysing the cells or tissues, protein samples were quantified by bicinchonininc acid protein assay kit (Shanghai Sangon) and heated to 95°C for 10 min after adding loading buffer. Samples were then subjected to sodium dodecyl sulfate polyacrylamide gel electrophoresis on 10% gradient 1-mm acrylamide gels, followed by transfer to polyvinylidene difluoride membranes. Membranes were blocked for 2 h in Tris-buffered saline with 0.01% polysorbate 20 (TBST) and 5% bovine serum albumin and incubated overnight at 4°C with appropriate primary antibodies at a 1:800 dilution in TBST with 2.5% bovine serum albumin as follows: anti-ADRB-1 antibodies (Sigma-Aldrich), anti-ADRB2 antibodies(Abcam), anti-GLUT-1 antibodies (Abcam), rabbit monoclonal anti-HK-2 antibodies (Cell Signaling Technology), and anti-β-actin antibodies (loading control; Beijing Boisynthesis Biotech). After a 1-h incubation with horseradish peroxidase–conjugated antirabbit antibodies (1:5000; EarthOx), the membrane was washed in TBST. Blots were developed with an enhanced chemiluminescence kit (Thermo Scientific), and images were acquired using a high-sensitive optical camera system. Band intensity was quantified by ImageJ software (National Institutes of Health).
The relative expression levels of detected proteins were quantified by comparing their band intensities with that of β-actin and then normalized to those in the NC group. Statistics were acquired from 3 repeated experiments.
18F-FDG Small-Animal PET/CT Imaging
18F-FDG was produced via 18O-H2O (p,n)18F transmutation reactions on a PET trace cyclotron (GE Healthcare) using an 18F-FDG reagents kit (ABX). After in vivo pharmacologic interventions, 7.881–11.221 MBq (213–303 μCi) of 18F-FDG in 200 μL of saline were injected into the peritoneal cavity of each mouse. Water and food were supplied after 18F-FDG injection. Anesthesia was performed with 2% isoflurane 60 min later. The PET/CT data acquisition procedure was performed on a small-animal PET/CT system (Mediso) 5 min after anesthesia, when the mice were fully anesthetized. Body temperature was maintained using a heating pad provided with the small-animal PET/CT system. PET/CT data were acquired for 600 s for each mouse with continuous anesthesia. All PET/CT images were processed and analyzed using Interview Fusion 1.0 (Mediso) software. For semiquantitative analysis, 3-dimensional (3D) regions of interest were carefully delineated and adjusted in the iso-3D mode over the borders of the tumor and interscapular BAT on small-animal PET images of each mouse. Three-dimensional round regions of interest were delineated on the liver as a nontarget (NT) reference. Mean 18F-FDG uptake was acquired as kilobecquerels per milliliter (kBq/mL) automatically after delineating the 3D regions of interest. The uptake ratio (T/NT) of the mean tumor or interscapular BAT uptake and mean NT uptake was calculated and compared between different interventions.
Immunohistochemistry Analysis
After PET/CT imaging, the mice were sacrificed, and the tumors were harvested and fixed in 10% formalin. Formalin-fixed, paraffin-embedded tissue blocks were serially cut into 3-μm-thick sections, which were dewaxed in xylene and rehydrated through a graded series of ethanol solutions. After 3 washes in PBS, heat-induced antigen was retrieved in 0.01 M citric acid buffer (pH 6.0) and autoclaved for 5 min at 120°C. Nonspecific binding sites were blocked through preincubation with normal bovine serum for 30 min. Slices were washed 3 times in PBS for 5 min each wash. These tissue sections were then incubated with anti-GLUT-1 antibodies (1:100; Abcam) or anti-HK-2 antibodies (1:50; Cell Signaling Technology), followed by horseradish peroxidase–conjugated antirabbit IgG (1:1000; EarthOx). In all sections, positive cells were visualized using 3,3-diaminobenzidine tetrahydrochloride (Shanghai Sangon) as a chromogen and were counterstained with hematoxylin.
Quantification of the immunostaining was performed by digital image analysis with the Image-Pro Plus 6.0 software (Media Cybernetics). A total of 3 fields selected from hot-spot areas (400× objective lens) were acquired per slice, and 5 slices from separate animals within each group were examined. The integrated optical density (IOD) of all the positive staining in each field and area of interest (AOI) was measured. The IOD was used to evaluate the area and intensity of the positive staining. The mean density (IOD/AOI) represented the concentration of specific protein per unit area.
Statistical Analysis
All data were analyzed by GraphPad Prism 5.0 (GraphPad Software) and presented as mean ± SD. The differences between 2 groups were determined by Student t test, and multiple comparisons were performed by 1-way ANOVA and completed by Bonferroni multiple comparison test. A P value of less than 0.05 was considered statistically significant.
RESULTS
ADRB1/2 Expression in Breast Cancer Cells
As shown in Figure 1, ADRB2 could be detected in all these cell lines, and positive expression of ADRB1 could also be identified in 4T1 and MCF-7 cells. Immunofluorescence detected an obvious and specific signal both on the membrane and in the nucleus of 4T1 cells. The above findings revealed positive expression of ADRB1/2, suggesting that various types of breast cancer cells, including 4T1 cells, may be influenced by interventions targeting ADRB1/2.
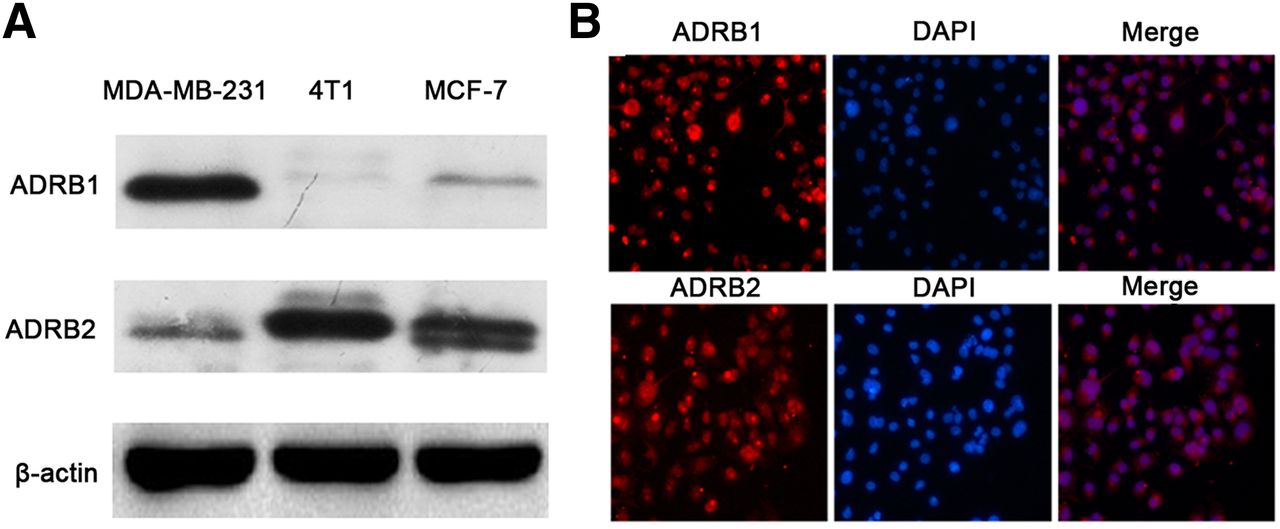
(A) Western blot of ADRB1 and ADRB2 of MDA-MB-231, MCF-7, and 4T1 breast cancer cells lines. (B) Immunofluorescence of ADRB1 and ADRB2 in 4T1 cells. In immunofluorescence analysis, ADRB1 and ADRB2 are shown in red, nuclei are in blue, and results of ADRB expression and nuclei staining were merged. DPAI = 4′,6-diamidino-2-phenylindole.
ADRB and Expressions of GLUT-1 and HK-2
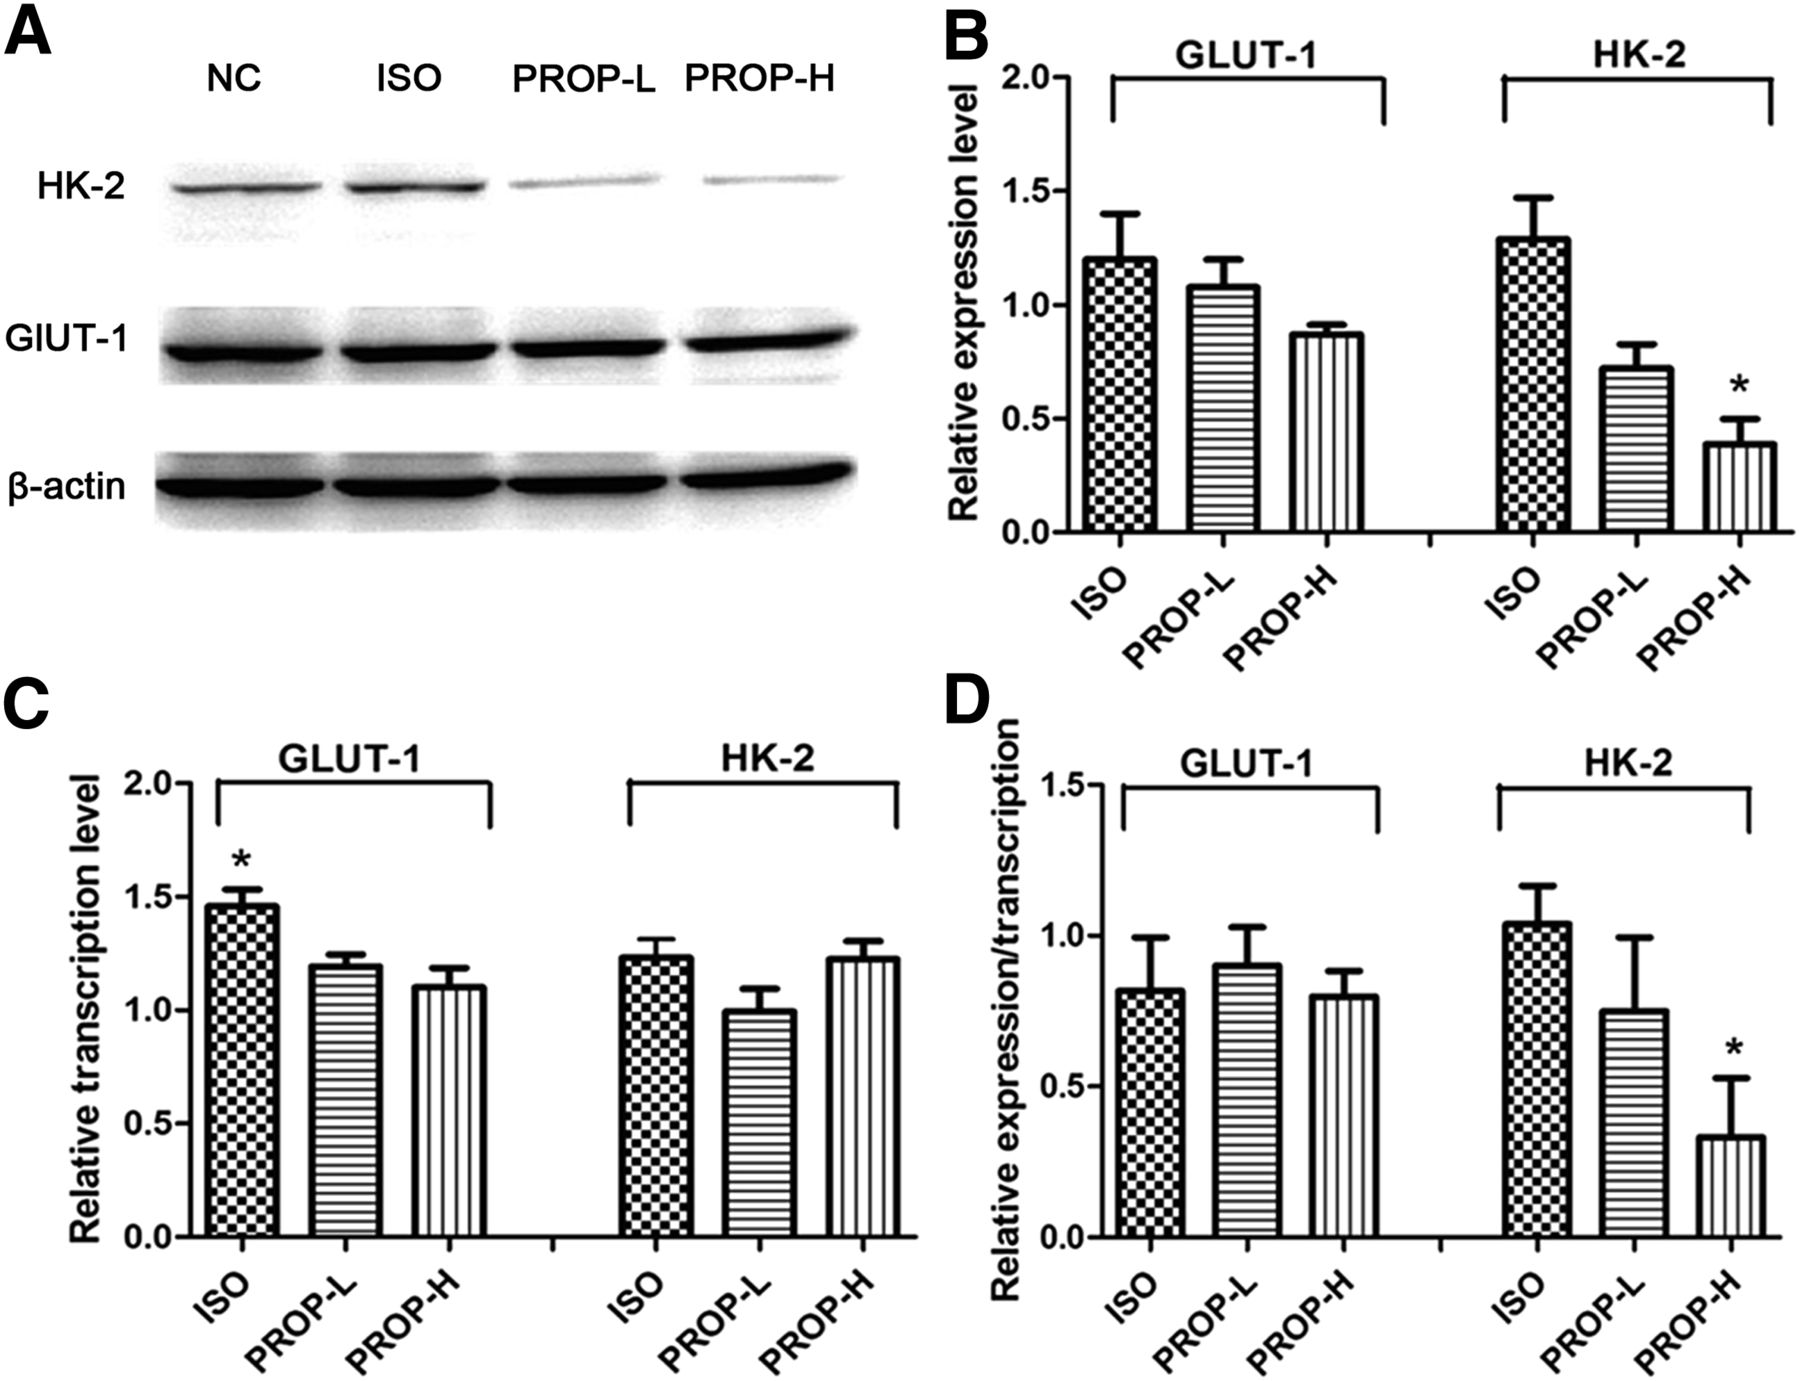
The results of the in vitro pharmacologic interventions revealed the relative protein and messenger RNA (mRNA) expression of GLUT-1 and HK-2 among the ISO, PROP-L, and PROP-H groups, using the NC group as a reference. As shown in Figures 2A and 2B, the relative expression of GLUT-1 was not significantly different among the 3 groups (P > 0.05), whereas the expression of HK-2 in the PROP-H group was significantly lower than that in the NC group (P < 0.05). To clarify the reason for the altered expression, quantitative RT-PCR was performed to track the mechanisms upstream of translation. As shown in Figure 2C, there was no significant variation of HK-2 transcription among the 3 groups (P > 0.05). The level of regulation at the posttranscriptional level was calculated by the numeric ratio of the relative protein level and the relative mRNA level. Data in Figure 2D demonstrated that the activity of ADRB1/2 did not significantly affect the posttranscriptional regulation of GLUT-1 (P > 0.05); however, the posttranscriptional levels of HK-2 were significantly decreased in the PROP-H group, compared with the ISO group (P < 0.05).

Analysis of regulatory mechanism of GLUT-1 and HK-2 in 4T1 cells after in vitro pharmacologic interventions. All data are normalized to results of NC group to obtain relative expression levels. (A and B) Western blot and semiquantitative analysis of expression levels of GLUT-1 and HK-2. (C) Transcription levels of GLUT-1 and HK-2 determined by quantitative RT-PCR. (D) Contribution of posttranscriptional regulation quantified by numeric ratio of relative protein expression and relative transcript levels. *P < 0.05.
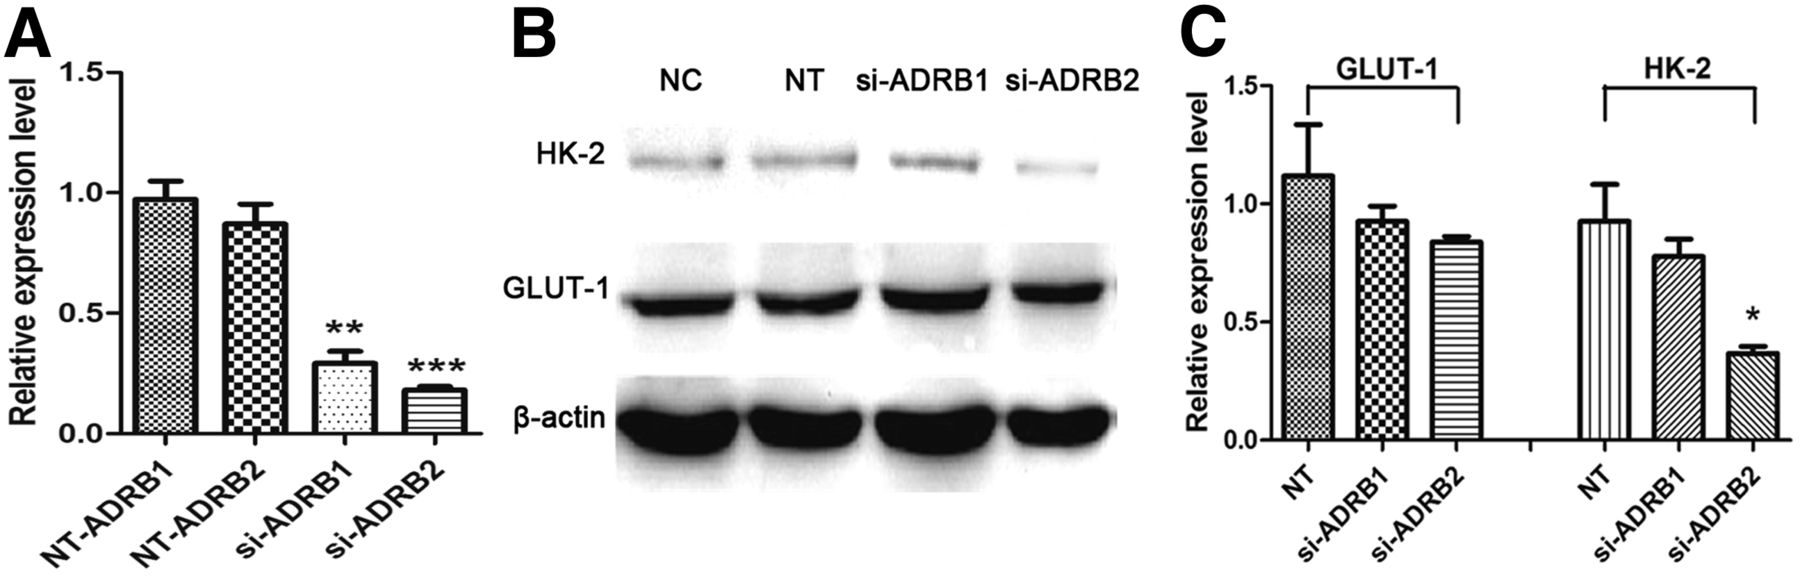
To clarify the relationship between HK-2 expression and ADRB, the expression of ADRB1 and ADRB2 were, respectively, blocked in 4T1 breast cancer cells using siRNA. As shown in Figure 3A, compared with the NC group, the mRNA levels of ADRB1 and ADRB2 were, respectively, reduced to 29.15% ± 5.05% and 18.05% ± 1.54% in the siRNA-treated groups (short for si-ADRB1/si-ADRB2 group), which are significantly lower than those in the negative transfection (NT) groups (P < 0.01 and < 0.001, respectively). As shown in Figures 3B and 3C, the HK-2 expression could be significantly reduced in si-ADRB2 group, compared with NT group (P < 0.05), which was similar to that in the PROP-treated groups. In addition, the expression level of HK-2 still maintained in the si-ADRB1 group, indicating the critical role of ADRB2 in the process of HK-2 expression regulation.

(A) mRNA levels of ADRB1 and ADRB2 in 4T1 cells transfected with negative reference (NT group) or ADRB1/2-targeted siRNA determined by quantitative RT-PCR. (B and C) Western blot and semiquantitative analysis of expression levels of GLUT-1 and HK-2 in 4T1 cells. All data are normalized to results of NC group to obtain relative expression levels. *P < 0.05. **P < 0.01. ***P < 0.001.
In Vivo Pharmacologic Interventions and 18F-FDG Imaging
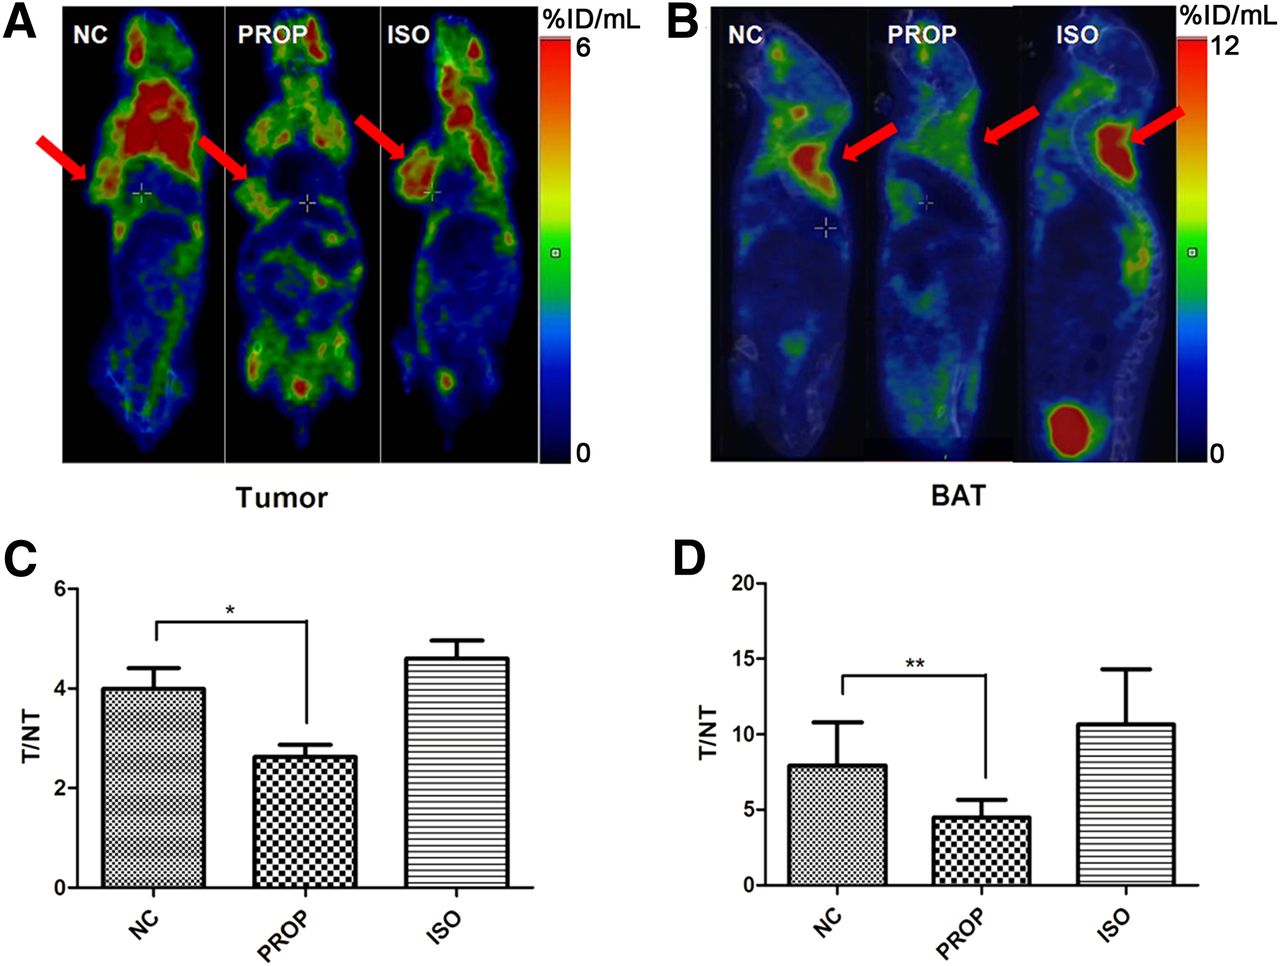
Overall, the influence of PROP or ISO on the 18F-FDG uptake of 4T1 tumors in vivo was not always distinguishable, which was consistent with the observations of a previous clinical study (23); however, some individuals in each group still exhibited obvious differences (Fig. 4A). Compared with tumors, 18F-FDG uptake in BAT seemed to be much more vulnerable to treatment with PROP or ISO (Fig. 4B). Because it was difficult to precisely control the injection dose of 18F-FDG, we assessed 18F-FDG uptake in tumors and BAT by comparison with 18F-FDG uptake in homolateral liver tissue (T/NT value). The T/NT values of tumors, as shown in Figure 4C, were significantly decreased between the NC and PROP groups (3.99 ± 0.42 vs. 2.62 ± 0.24, respectively, n = 8, P < 0.05). Additionally, as shown in Figure 4D, comparison of the T/NT values of BAT between the NC and PROP group revealed a sharp decrease (7.92 ± 1.01 vs. 4.49 ± 0.41, respectively, n = 8, P < 0.01). The T/NT values of the ISO group were numerically higher than those of the NC group, both in tumors (4.60 ± 0.37 vs. 3.99 ± 0.42, respectively, n = 8) and in BAT (10.66 ± 1.29 vs. 7.92 ± 1.01, respectively, n = 8); however, the differences failed to be significant (P > 0.05).

PET of 4T1 tumors and BAT from BALB/c mice treated with PBS (NC), 10 mg of propranolol per kilogram, or 10 mg of ISO per kilogram. (A) Representative coronal 18F-FDG PET images of tumors in differentially treated mice. Tumors are indicated by red arrows. (B) Representative sagittal 18F-FDG PET images of interscapular BAT in different groups of mice. Regions of BAT are indicated by red arrows. (C and D) Quantification of T/NT (target/nontarget) values of tumors and BAT. Homolateral liver tissue was defined as NT reference. *P < 0.05. **P < 0.01.
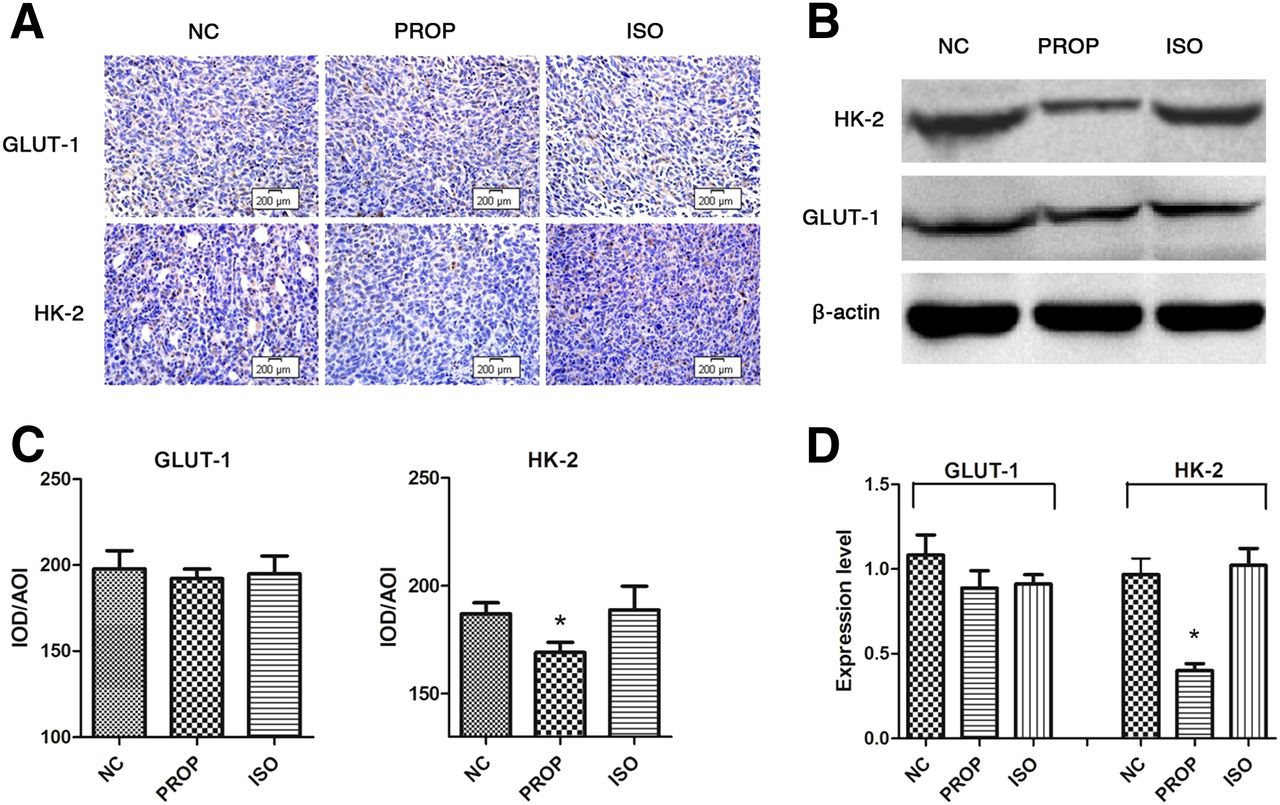
Immunohistochemistry analysis and IOD/AOI quantification revealed significantly decreased HK-2 expression in PROP-treated mice and similar expression levels of GLUT-1 in all groups, which partly confirmed the in vitro results (Figs. 5A and 5C). A Western blot of tumor tissue suggested a similar result (Figs. 5B and 5D).

Analysis of GLUT-1 and HK-2 levels in 4T1 breast cancer tumors after in vivo treatment with PBS (NC), 10 mg of propranolol per kilogram, or 10 mg of ISO per kilogram by intraperitoneal injection 1 h before analysis. (A) Immunohistochemical analysis of GLUT-1 and HK-2. Scale bar 200 μm. (B) Western blot analysis of GLUT-1 and HK-2. (C) Quantification of immunohistochemical analysis using value of IOD/AOI. (D) Quantification of Western blot analysis. *P < 0.05. **P < 0.01.
DISCUSSION
In this study, we demonstrated that ADRB1/2 was abundantly expressed in several types of breast cancer cells and that ADRB activity was well correlated with both HK-2 expression and the T/NT value of the 18F-FDG PET imaging. We also discovered that ADRB2 played a more important role in the maintenance of HK-2 expression than ADRB1 through RNA interference. Furthermore, we compared protein and mRNA levels of HK-2 and found that PROP downregulated HK-2 expression predominantly through posttranscriptional mechanisms.
Previous reports show that treatment with an ADRB agonist stimulates cell proliferation, migration, and invasion and accelerates tumor angiogenesis in breast cancer (27,28). In contrast, ADRB blockers or knockdown of ADRB by RNA interference can inhibit tumor progression by inhibiting tumor growth, metastasis, and angiogenesis (29,30). Moreover, PROP inhibits the growth of breast cancer tumors through an antiangiogenic mechanism when combined with chemotherapy (31). These previous studies have also demonstrated that the activation of ADRB can stimulate the adenylyl cyclase–dependent synthesis of cyclic adenosine monophosphate, thereby activating both protein kinase A– and extracellular regulated kinase–dependent signaling pathways to upregulate the expression of many downstream molecules that participate in tumor growth, metastasis, and angiogenesis.
As described by the Warburg effect, most cancer cells predominantly produce energy by glycolysis, even under high oxygen conditions (32,33). Tumor cells exhibit dramatically increased glucose uptake and highly elevated rates of glycolysis, thus providing the basis for tumor imaging by PET using the glucose analog 18F-FDG. In the initiating step of glycolysis, HK catalyzes the phosphorylation of glucose to glucose-6-phosphate. In general, the expression of HK-2, which is the predominant HK isoform in many cell types, is increased in many cancers, including breast cancer (16,34). Besides being an important glycolytic protein, HK-2 can also prevent cancer cells from apoptosis through interacting with voltage-dependent anion-selective channel protein 1 at the mitochondria (35). In the current study, we found that HK-2 was highly expressed in mouse 4T1 breast cancer cells and that its expression could be posttranscriptionally downregulated by PROP, respectively. Because ADRB activity has been shown to positively correlate with the intensity of PI3K-Akt-mTOR-4EBP signaling (24,36), we hypothesized that PROP inhibits the expression of HK-2 through regulating the activity of the downstream eIF4F complex. Although several articles have reported that the expression of GLUT-1 is elevated after the activation of PI3K-Akt-mTOR-4EBP signaling (37), we found few changes in GLUT-1 levels after PROP or ISO intervention, both in vitro and in vivo.
Our study not only corroborates the molecular interaction between ADRB2 and HK-2 but also provides insights into the significance of 18F-FDG PET imaging in clinical practice. Some reports have suggested that the level of HK-2 expression correlates with the value of the maximum standardized uptake value in 18F-FDG PET imaging (38,39); therefore, we further investigated whether PROP or ISO intervention could affect 18F-FDG PET tumor imaging in a mouse 4T1 breast cancer model. We found that PROP and ISO were capable of inhibiting or enhancing the relative 18F-FDG uptake in 4T1 tumors, implying that ADRB intervention can modulate tumor glucose metabolism in vivo.
However, compared with BAT, breast cancer tumors exhibited much smaller variations in the amplitude of 18F-FDG uptake between the ISO group and the PROP-treated group. In BAT, the T/NT value of the ISO group was 10.66 ± 1.29, whereas that of the PROP-treated group was 4.49 ± 0.41, with a variation of 2.37-fold between their mean values. In breast cancer lesions, these figures were changed to 4.60 ± 0.37 and 2.62 ± 0.24, respectively, with a variation of 1.76-fold, revealing a distinct sensitivity to pharmacologic interventions among different type of tissues. Moreover, the limited variation amplitude of 18F-FDG uptake in 4T1 breast cancer tumors also failed to correspond with the potent changes in HK-2 expression demonstrated by immunohistochemistry and Western blot of tumor tissues. These 2 phenomena implied that the regulatory mechanism of glucose metabolism may not be the same in different types of tissues and the influence of ADRB may be not enough to completely control the glucose metabolism of breast cancer tumors. Some other pathways or factors that are independent of ADRB activity may also play important roles in the regulation of glucose metabolism in breast cancer. In fact, reports from other groups also demonstrated that ADRB has a limited role in the regulation of breast cancer. For example, Sloan et al. pointed out that the stress-induced neuroendocrine activation of ADRB had a negligible effect on the growth of primary tumors (28), and Pasquier et al. verified PROP alone could only induce transient antitumor effects, whereas profound and sustained antitumor effects could be achieved only when PROP was combined with chemotherapy (31). Moreover, besides GLUT-1 and HK-2, some other factors such as hypoxia-inducible factor-1α, vascular endothelial growth factor, mevalonate diphosphate decarboxylase, HK-3, proliferating cell nuclear antigen, and p53 are also reported to be of significance in the regulation of 18F-FDG avidity in human cancer (16,40,41). More investigations are still needed to expound the whole glucose metabolism network of malignant tumors.
In clinical studies, the repression of ADRB by 20–80 mg of PROP per kilogram was considered to be a practical method to reduce undesirable 18F-FDG uptake in BAT, thus reducing the false-positive rate of cancer diagnosis (21–23). The imaging results of our research confirmed the feasibility of this method. However, if the relatively modest repressive effect of PROP to the 18F-FDG uptake of breast cancer in mice could also result in a similar outcome in humans, a reduction in the true-positive rate of clinical 18F-FDG PET tumor imaging might potentially occur at the same time, especially in the detection of low-uptake tumors or small metastatic lesions. Although, according to our result, the 18F-FDG uptake in BAT is much more sensitive to PROP than that in breast tumor, an appropriate dosage is still worthy of investigation. Further studies may be still needed to precisely assess the appropriate dosage of PROP for this method to balance the reduction of the false-positive rate, the detection efficiency of cancer lesions, and the side effects of PROP to some other organs, so as to avoid bringing unnecessary but possible loss to the huge population of β-blocker users.
CONCLUSION
The expression of HK-2 can be influenced by the activation of ADRB2 through posttranscriptional regulation in 4T1 breast cancer cells. Moreover, glucose metabolism and 18F-FDG uptake of 4T1 breast cancer tumors can be inhibited by PROP.
DISCLOSURE
The costs of publication of this article were defrayed in part by the payment of page charges. Therefore, and solely to indicate this fact, this article is hereby marked “advertisement” in accordance with 18 USC section 1734. This work was supported by the National Natural Science Foundation of China under grant nos. 81230033 and 81227901 and the National Basic Research Program of China (973 Program) under grant no. 2011CB707704. No other potential conflict of interest relevant to this article was reported.
Acknowledgments
We thank Kaichun Wu and Yongzhan Nie from the State Key Laboratory of Cancer Biology (Xi’an, China) for their generous support and Wansheng Liang, Hong Jia, Guiyu Li, Jianhua Dou, Changhao Liu, and Bingyi Cao for their technical assistance in conducting this research.
Footnotes
Published online Feb. 6, 2014.
- © 2014 by the Society of Nuclear Medicine and Molecular Imaging, Inc.
REFERENCES
- Received for publication February 5, 2013.
- Accepted for publication November 11, 2013.


Jump to section
Related Articles
Cited By...
- No citing articles found.