


Abstract
This study provides the first comprehensive quantification of translocator protein (TSPO) binding using SPECT and 6-chloro-2-(4′-123I-iodophenyl)-3-(N,N-diethyl)-imidazo[1,2-a]pyridine-3-acetamide (123I-CLINDE) in neurologic patients. 123I-CLINDE is structurally related to well-known PET ligands such as 18F-PBR111 and 18F-DPA-714. Methods: Six patients with cerebral stroke and 4 patients with glioblastoma multiforme (GBM) underwent 150-min dynamic SPECT scans with arterial blood sampling. Four of the patients were rescanned. All patients were genotyped for the rs6971 polymorphism. Volumes of interest were delineated on the individual SPECT scans and the coregistered MR images. Compartmental and graphical models using arterial input or the cerebellum as a reference region were used to quantify 123I-CLINDE binding. Results: Among the 6 models investigated, the 2-tissue-compartment model with arterial input described the time–activity data best. Time–stability analyses suggested that acquisition time should be at least 90 min. Intersubject variation in the cerebellar distribution volume (VT) was clearly related to the TSPO genotype. In the stroke patients the VT in the periinfarction zone, compared with VT in the ipsilateral cerebellum, ranged from 1.4 to 3.4, and in the GBM patients the VT in the tumor, compared with the VT in the cerebellum, ranged from 1.8 to 3.4. In areas of gadolinium extravasation, 123I-CLINDE binding parameters were not significantly changed. Thus, 123I-CLINDE binding does not appear to be importantly affected by blood–brain barrier disruption. Conclusion: As demonstrated within a group of stroke and GBM patients, 123I-CLINDE SPECT can be used for quantitative assessment of TSPO expression in vivo. Because of the absence of a region devoid of TSPO, reference tissue models should be used with caution. The 2-tissue-compartment kinetic analysis of a 90-min dynamic scan with arterial blood sampling is recommended for the quantification of 123I-CLINDE binding with SPECT.
Translocator protein (TSPO) has important functions in steroid synthesis, protein import, porphyrin transport, heme synthesis, oxidative processes, apoptosis, and immunomodulation (1). Under normal physiologic conditions, TSPO levels are low in the brain but markedly increase after brain injury and repair. The growing interest in neuroimaging of TSPO is related to several aspects of TSPO neurobiology including the use of TSPO ligands as markers of tumor growth and neuroinflammation and especially in relation to neurodegenerative diseases (2). Imaging of TSPO with PET started about 20 y ago with the 11C labeling of the isoquinoline carboxamide derivative PK11195 (3), but especially during the past 5–10 y several new PET tracer candidates have been developed to improve quantification and target-to-background ratio and to introduce 18F labeling. 6-chloro-2-(4′-123I-iodophenyl)-3-(N,N-diethyl)-imidazo[1,2-a]pyridine-3-acetamide, or CLINDE (4,5), is an 123I-labeled TSPO ligand for SPECT, and it is structurally related to the well-known PET tracers 18F-PBR111 (6) and 18F-DPA-714 (7). Radiolabeled CLINDE has previously been evaluated in experimental models of autoimmune encephalomyelitis (5), excitotoxicity (8), focal ischemia (9), toxic demyelination (10), status epilepticus (11), and Parkinson disease (12).
This study provides the first comprehensive quantification of TSPO using SPECT in humans. 123I-CLINDE quantification was done using 3 different tissue compartment models and 3 reference tissue models. Models are assessed in terms of their goodness of fit and parameter estimation stability over different scan durations aiming at describing a quantitative method feasible in a clinical setting.
MATERIALS AND METHODS
Fifteen studies were conducted in 10 patients and 1 healthy volunteer (6 cerebral stroke and 4 glioblastoma multiforme [GBM] patients; mean age ± SD, 56 ± 20 y; age range, 24–66 y). Four patients were rescanned after 4–7.5 mo. The study was performed in accordance with the ethical standards of the Declaration of Helsinki, and the ethical committee of the Copenhagen Capital Region (H-2-2010-086) approved the study protocol. All subjects signed a written informed consent form. Table 1 shows a summary of age, sex, clinical data, and TSPO genotype of the subjects.
Summary of Age, Sex, Clinical Data, and TSPO Genotype of Patients
SPECT Image Acquisition
Immediately after a bolus injection of 168.0 ± 34.0 MBq (mean ± SD; range, 108.6–198.2 MBq; n = 15) of 123I-CLINDE (MAP Medical Technologies), dynamic SPECT scanning was started and conducted over 2.5 h. The protocol consisted of ten 2-min frames, followed by thirteen 10-min frames. A headband fixing each subject’s head minimized movements during scanning. To block thyroidal uptake of free radioiodine, we gave each subject 200 mg of potassium perchlorate intravenously 20 min before injection of 123I-CLINDE.
SPECT imaging was performed with a triple-head IRIX camera (Philips Medical) fitted with low-energy, general-all-purpose, parallel-hole collimators (spatial resolution, 8.5 mm in full width at half maximum at 10 cm) and a 9.5-mm sodium iodine scintillation crystal. The supplemental materials provide details on the reconstruction (available at http://jnm.snmjournals.org).
MR Image Acquisition
MR images were acquired on average 9 ± 15 d (median, 2 d) after the corresponding SPECT scan. The large SD was mainly the result of 2 patients undergoing MR imaging 34 and 36 d after SPECT. MR imaging was performed on a 1.5- or 3-T magnetic resonance unit (Siemens) using a T1-weighted sequence optimized for fusion with SPECT. Contrast agent was used in a dose of 0.1 mmol/kg of body weight (Multihance [Bracco] and Gadovist [Shering]).
Input Measurement
A cannula was inserted into the radial artery of the nondominant arm for arterial blood sampling. Blood samples were drawn manually at 25 different times, with increasing time intervals during SPECT scanning. Total radioactivity in plasma and whole blood were measured in a well counter (Cobra 5003; Packard Instruments), and data were decay-corrected to the time of injection. Twelve blood samples were drawn for metabolite analyses by radio–high-performance liquid chromatography (13). All the equipment was cross-calibrated to the SPECT scanner. The percentage of parent compound was fitted using a parametric function. The metabolite-corrected plasma input function was calculated as the product of this function and the measured total plasma radioactivity. The percentage of plasma protein binding was measured using equilibrium dialysis (14).
TSPO Genotyping
Genomic DNA was extracted from blood (buffy coat) or saliva by the use of a QIAamp DNA Blood Mini Kit (Qiagen) according to the guidelines obtained from the Blood and Body Fluid Spin Protocol (supplemental materials).
Data Analysis and Kinetic Modeling
The summed SPECT image was used for coregistration to the T1-weighted or the T1 Gd (T1-weighted with gadolinium enhancement) MR image of the same subject using manual interactive image overlay (15), which creates a rigid homogene transformation between different images allowing registration across different imaging modalities. Magnetic resonance sequences from the same subject were coregistered by applying the automatic method included in SPM8 software package (16). The homogene transformations identified in the separate coregistration steps were combined to perform registration and reslicing between SPECT and different MR imaging sequences.
In cerebral stroke patients, 2 volumes of interest (VOIs) were defined. The ischemic core, assumed to represent not-viable tissue after stroke, was delineated in the T1-weighted/T1 Gd MR image, and the periinfact zone was defined as the high-binding region in the SPECT scans ipsilateral to the stroke minus the overlap with the ischemic core. In GBM patients, 2 VOIs were defined. The Gd lightup was delineated in the T1 Gd MR image, and ipsilateral high binding was delineated in the SPECT scans. VOIs defined in the first scan were mapped onto the rescan to study the changes in 123I-CLINDE binding.
The ipsilateral cerebellum was used as the reference region for the stroke patients, and the total cerebellum (ipsi- and contralateral) was used as the reference region for the GBM patients. To delineate the reference regions, an automatic method was performed using probability maps (17). Because of the low resolution of the SPECT images, no segmentation of gray matter, white matter, and cerebrospinal fluid was attempted. Thus, the time–activity curves represent the total radioactive concentration.
Models from 2 major categories were investigated: kinetic models using plasma as an input function and the reference tissue models. A 1-tissue-compartment (1TC), 2-tissue-compartment (2TC), and a 2TC model with constraint (2TCC) (K1/k2 is constrained to the same value across regions) were used to fit the data within the plasma input models. The blood volume in brain tissue was fixed to 5%. Within the reference tissue models, the simplified reference tissue model (SRTM) (18), Logan noninvasive (LoganNI) model (19), and Ichise multilinear reference tissue model (MRTM0) (20) were tested.
Image and data preprocessing were done in MATLAB (The MathWorks), and the kinetic modeling was done using PMOD software (version 3.0; PMOD Technologies Inc.). For statistical analysis, paired sample t tests and Pearson linear correlation were performed in GraphPad Prism (version 6.00; GraphPad Software).
RESULTS
Kinetic Models with Plasma Input Function
The metabolism of 123I-CLINDE was fast. At 10 min 37.4% ± 14.6% (n = 13) and at 90 min 21.2% ± 10.2% of parent compound remained in plasma. The coefficient of variation (SD/mean) was 0.39 at 10 min and 0.48 at 90 min. The Akaike information criterion suggested that the Hill model was a better descriptor of the parent fraction than the biexponential model. Plasma protein binding was 2.5% ± 0.6% (n = 12).
An example of model fitting is given in Supplemental Figure 1. Except for 1TC, both 2TC and 2TCC fit the data well, but 2TC gave the significantly lowest Akaike information criterion values (P = 0.0011, n = 57). The distribution volumes (VT) of some of the manually delineated regions and the reference regions are given in Table 2 and Table 3 for the stroke patients and GBM patients, respectively, and time–activity curves of some brain regions and the metabolite-corrected plasma input function are shown in Figure 1. Compared with 2TC, 1TC underestimated VT by 13.9% (P < 0.0001, n = 57), and 2TCC (P = 0.1213, n = 57; 0.2% underestimation, compared with 2TC) did not give significantly different VT values.
Model Parameters for Cerebral Stroke Patients
Model Parameters for GBM Patients

Mean and SD (1 direction) of time–activity curves are given for different brain regions and metabolite-corrected plasma input function: periinfarct zone (n = 5) in stroke patients, high-binding region (HB) in GBM patients (n = 5), reference region–cerebellum (n = 6), and plasma parent compound (n = 13). SUV = standardized uptake value.
Supplemental Table 1 shows the rate constants from plasma to tissue and the VT in the corresponding VOIs for GBM patients. The K1s of the Gd lightup region are not significantly different from the K1s of the reference region (P = 0.7874, n = 6).
Reference Tissue Models
SRTM, LoganNI, and MRTM0 were tested as reference models with the nondisplaceable binding potentials (BPND) as the outcome parameter. BPND of the compartmental models using plasma as input was calculated as VT/Vref −1 (Vref is the distribution volume of the reference region). When 2TC was taken as a gold standard, SRTM underestimated BPND by 8.1% (P = 0.0066, n = 41), LoganNI underestimated BPND by 26.5% (P < 0.0001, n = 44), and MRTM0 underestimated BPND by 27.1% (P < 0.0001, n = 44). SRTM gave not only the lowest bias, but also the lowest 95% limits of agreement to 2TC: [−0.6248 0.3926] (defined as average difference ± 1.96 SD of the difference), compared with LoganNI [−1.1699 0.4836] and MRTM0 [−1.1707 0.4304]. Furthermore, SRTM showed the highest correlation to 2TC (r = 0.939, P < 0.0001), compared with LoganNI (r = 0.850, P < 0.0001) and MRTM0 (r = 0.894, P < 0.0001), but failed to converge in 3 of 44 regions. The scatterplots and Bland–Altman plots are shown in Figure 2.
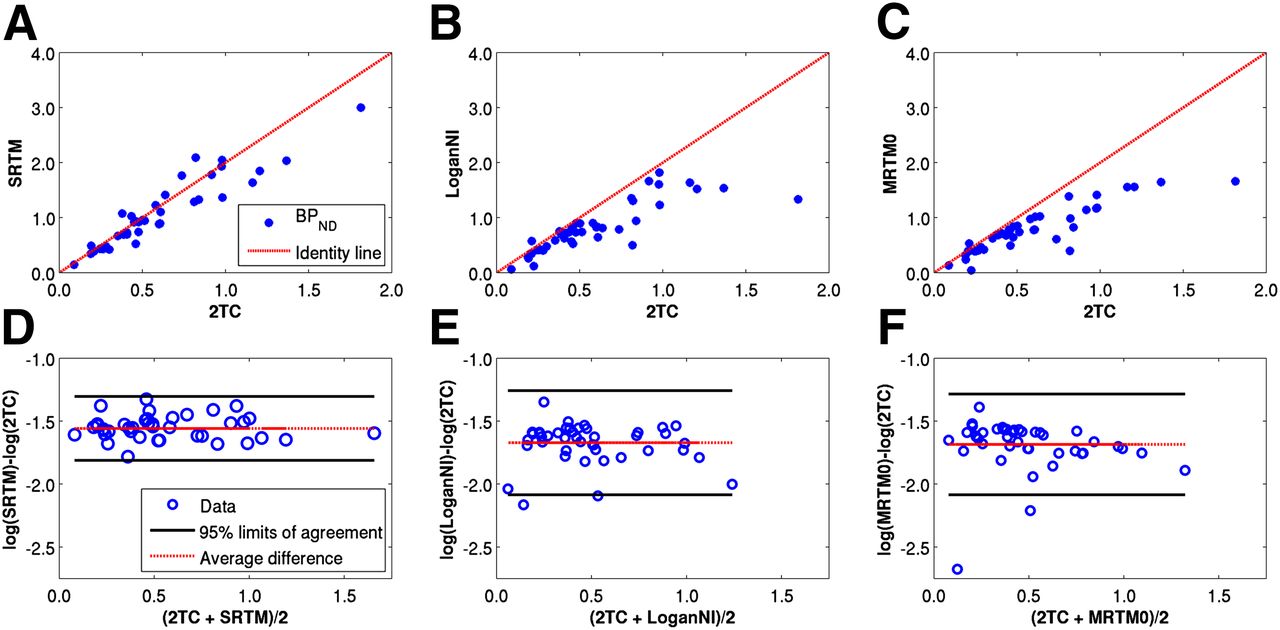
Scatterplots (A–C) and Bland–Altman plots (D–F) of BPND of SRTM vs. 2TC, LoganNI vs. 2TC, and MRTM0 vs. 2TC. Identity dashed lines are plotted for reference. Bland–Altman plots give difference of BPND between 2 models in logarithmic scale vs. average BPND. 95% limits of agreement are given in solid line and average difference in dotted line.
Time–Stability Analyses
Time–stability analyses were performed to determine the minimal scan duration required to obtain stable estimates. Truncated datasets, corresponding to scan durations of 150, 130, 110, 90, and 70 min, were analyzed (Fig. 3). In the high-binding region, for almost all scans VTs calculated using 130 min of scan data were within ±5% of those using the full scan duration, VTs using 110 min of data were within ±10%, and VTs using 90 min of data were within ±15%. In the reference region, more variation was observed when truncating the data, due to the low count statistics and noise in this region. BPNDs from both the 2TC and the SRTM modeling converged more slowly than VTs. Furthermore, because of the noise in the reference region, SRTM failed in several noisy regions, especially when shorter scan data were used.
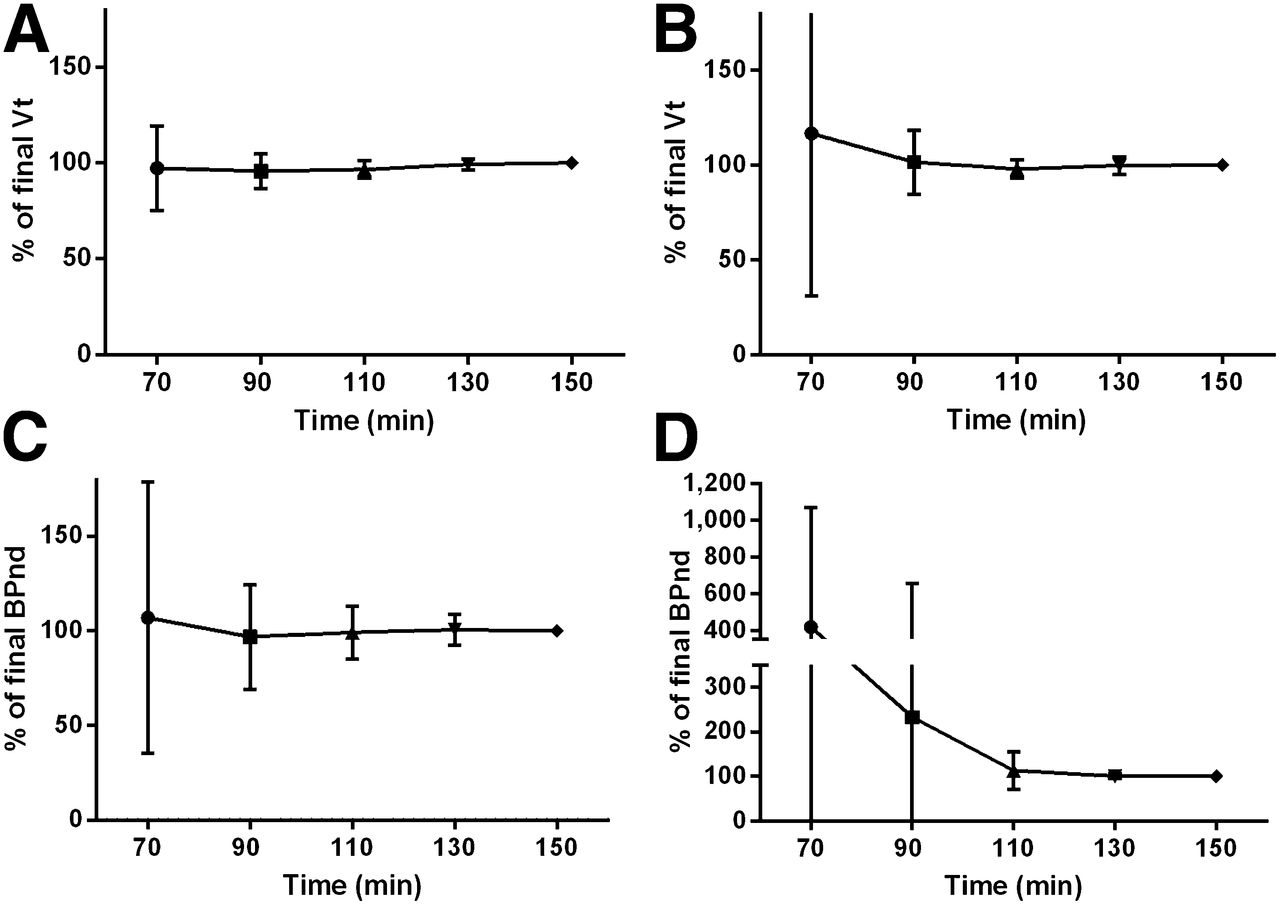
Time–stability of binding parameters was evaluated using VT of high-binding region (A) and reference region (B) both from 2TC modeling, BPND from 2TC calculated as VT/Vref −1 (C), and BPND from SRTM (D). Mean percentage difference and the SD are given. SRTM failed in 3 regions at 70 min, 2 regions at 90 min, and 1 region at 110 min.
DISCUSSION
The aim of this study was to identify the best quantification approach for 123I-CLINDE SPECT for future human clinical studies. Six different kinetic models were investigated, among which 3 models used metabolite-corrected arterial data as input. We studied stroke patients and glioblastoma patients in whom a strong TSPO binding had previously been demonstrated. In addition, examination of glioblastoma patients allowed us to test the effect of a disrupted blood–brain barrier (BBB) on 123I-CLINDE binding to TSPO. Genotyping also allowed us to investigate the effect of genotype on 123I-CLINDE binding in areas of the brain not expected to be involved in pathology.
Among the kinetic models, 1TC did not have the flexibility to represent 123I-CLINDE, and 2TC with the full data was used as a gold standard to evaluate other arterial input models. Reducing the number of parameters from 4 in a 2TC model to 3 in a 2TCC did not result in lower Akaike information criterion values. Therefore, 2TC with 4 parameters is recommended. The time–stability analyses (Fig. 3) suggest that in high-binding regions a scan duration of 90 min is sufficient for quantitative assessment of TSPO binding using arterial input and 2TC kinetic modeling. The scan duration and modeling approach are comparable to other second-generation TSPO ligands: a 120-min scan with arterial sampling for quantification of 18F-PBR111 (21) and a 90-min scan with arterial sampling for 18F-DPA-714 (22).
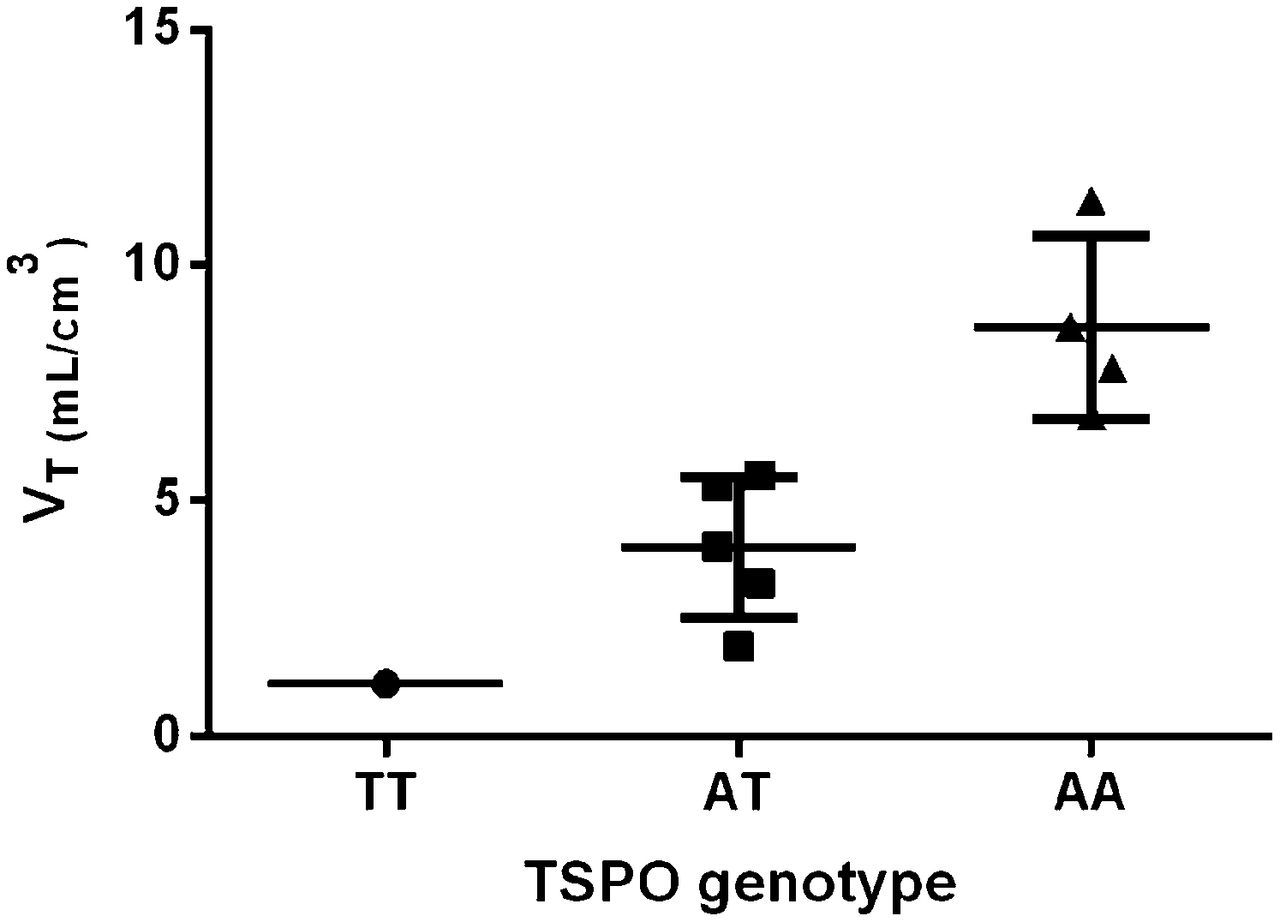
Of the investigated reference tissue models, SRTM gave the smallest underestimation of BPND and the highest correlation, compared with the BPND given by 2TC, possibly indicating that SRTM using a reference region as an input can be an alternative approach to 2TC to circumvent the invasive arterial blood sampling. However, the high correlation does not guarantee that the chosen reference region is appropriate. SRTM modeling presumes that the reference region is devoid of receptors and the nondisplaceable binding is the same in the reference region, compared with other regions of interest (18,23). However, TSPO is abundant in the rodent brain both in areas involved in pathology and in areas not involved in pathology (24). We used the cerebellum (ipsilesional in stroke patients and bilateral in GBM patients) as a representation of a reference region. However, in Figure 4 it is clearly shown that the VTs in the cerebellum fall into 3 categories explained by the TSPO genotype. This finding indicates that specific binding in the cerebellum is present, and it voids the assumption of reference tissue modeling. It is possible to model the size of the nondisplaceable distribution (VND), assuming no quantitatively important inter- and intrasubject variation in VND (21), but individual assessment of the size of VND awaits blocking data.

Mean and SD of distribution volumes in cerebellum for each patient categorized by TSPO genotypes. AA = high-affinity binder; AT = mixed-affinity binder; TT = low-affinity binder.
Previously, the rs6971 polymorphism has explained differences in the binding affinity to TSPO of the PET ligands 18F-N-2-(2-fluoroethoxy)benzyl)-N-(4-phenoxypyridin-3-yl)acetamide (25) and 11C-PBR28 (26,27). In our material, the mean distribution volume in the cerebellum was 1.1 mL cm−3 in low-affinity binders (n = 1), 4.0 mL cm−3 (2.1–5.9, 95% confidence interval of the mean) in mixed-affinity binders (n = 5), and 8.7 mL cm−3 (5.6–11.8, 95% confidence interval of the mean) in high-affinity binders (n = 4). Thus, our human data suggest an approximately 8-fold difference in the low-affinity binders, compared with high-affinity binders. This difference is comparable to the structurally related PET ligands PBR111 and DPA-713 (bycyclic linker derivatives) but clearly lower than the 50-fold difference of PBR28 (a phenoxyphenyl acetamide derivative) (28).
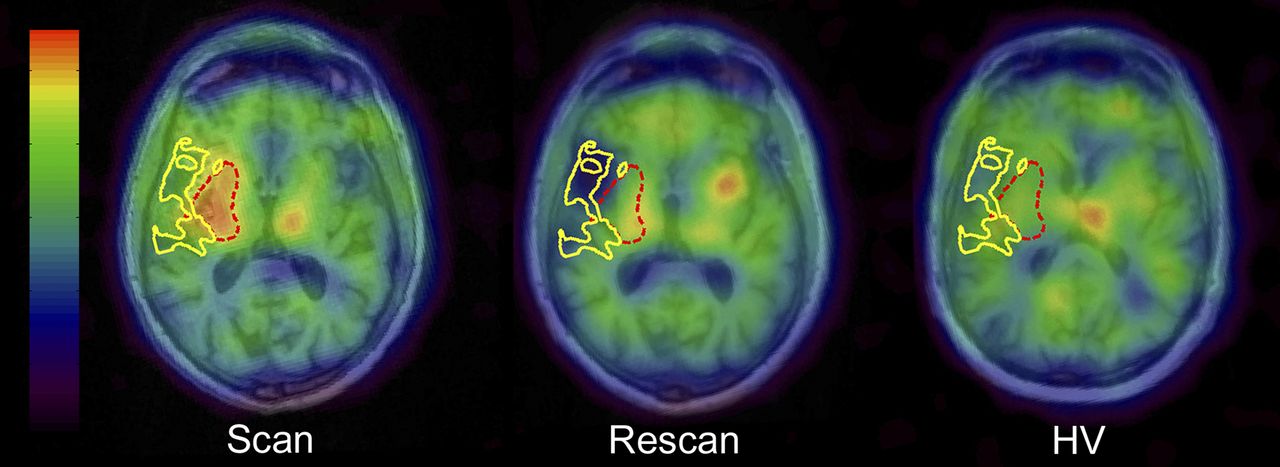
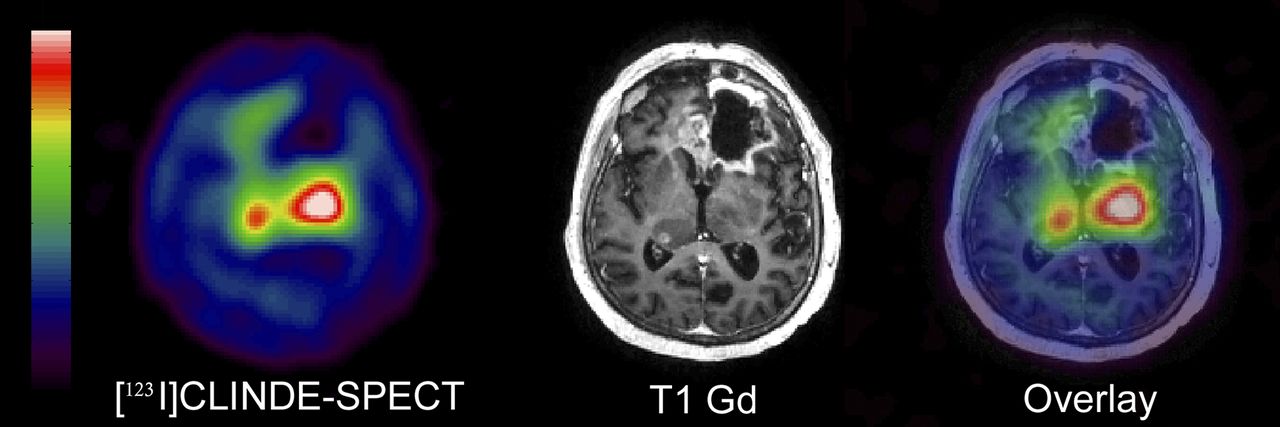
This study was not designed for testing clinical hypotheses. Stroke and GBM patients were chosen in expectation of a robust regional increase in TSPO well suited for testing different quantitative models. However, the 4- to 7-fold difference in VT demonstrated in Tables 2 and 3 and the spatial and temporal pattern of TSPO binding may have interesting clinical implications. Figure 5 shows the 123I-CLINDE SPECT and MR images in patient 1 28 d and 8 mo after stroke, compared with an age-, sex-, and genotype-matched healthy volunteer. Eight months after the stroke, VT in the periinfarct zone was reduced to near-normal values, compared with the healthy volunteer, but an increased binding of 123I-CLINDE was noticed in the insula of the contralesional hemisphere. The temporal dynamics and remote TSPO binding after stroke have been described in previous publications (29,30). Thiel et al. demonstrated a trend toward a negative partial correlation between initial TSPO binding potential in the infarct zone and clinical outcome, whereas remote TSPO binding in the brain stem was positively correlated with outcome. More studies are needed to describe the role of activated microglia in stroke recovery. Figure 6 shows the 123I-CLINDE SPECT image and the coregistered T1 Gd MR image in a 65-y-old male GBM patient diagnosed 1 y before scanning and operated on again in the left frontal lobe 2 mo before scanning. Gadolinium extravasation was present in the area of the operation cavity and in the right thalamus. MR imaging with and without gadolinium is regarded as the highest level recommendation in differentiating among tumor progression, pseudoprogression, and treatment-related changes in progressive GBM (31). A recent PET study in combination with ex vivo immunohistochemistry has demonstrated increased TSPO on glioma cells (32). In Figure 6, an increase in TSPO binding in the central areas is clearly demonstrated. The binding of 123I-CLINDE to TSPO does not appear to be affected by gadolinium extravasation, especially in the area of the operation cavity. In all GBM subjects, extravasation of gadolinium was apparent in T1 Gd MR imaging, signifying BBB disruption. K1 was not significantly different in the VOIs with gadolinium extravasation, compared with the cerebellum. Future studies are needed to address the sensitivity and specificity of molecular imaging using TSPO tracers to demonstrate tumor proliferation in GBM patients in comparison with MR imaging findings.

Spatial and temporal development of TSPO 28 d and 8 mo after middle cerebral artery stroke, compared with age-, sex-, and genotype-matched healthy volunteer (HV). Ischemic core is marked by solid area and periinfarct zone by dashed area. 123I-CLINDE binding in these regions mapped onto HV was comparable to cerebellum.

123I-CLINDE SPECT image and coregistered T1Gd MR image of patient 4 with GBM. Gadolinium extravasation indicates BBB disruption; however, there was no corresponding increase in 123I-CLINDE concentration. Strong increase of 123I-CLINDE binding was shown in central area of brain without any apparent extravasation of gadolinium and BBB disruption.
It is a limitation of the study that there was a time delay between SPECT and MR imaging of 34 and 36 d in the rescan of a stroke patient and the scan of a GBM patient, respectively. Excluding these 2 scans from the data analyses did not change the conclusions of the study. For future clinical studies, delineation of VOIs based on MR imaging techniques such as dynamic contrast-enhanced MR imaging, dynamic susceptibility contrast MR imaging, and diffusion MR imaging will be of interest but were not available in the present study.
CONCLUSION
123I-CLINDE SPECT imaging is a new tool for demonstrating TSPO in the human brain. A strong TSPO binding was clearly demonstrated in patients with stroke and GBM. As is the case for other second-generation TSPO ligands, intersubject variation in the SPECT signal could partly be attributed to the rs6971 polymorphism. Thus, though a high correlation between SRTM and 2TC was demonstrated SRTM must be used with caution. We demonstrated that there was no effect of BBB disruption on the binding of 123I-CLINDE. We recommend 2TC kinetic analysis of 123I-CLINDE SPECT bolus data with arterial input and an acquisition time of at least 90 min.
DISCLOSURE
The costs of publication of this article were defrayed in part by the payment of page charges. Therefore, and solely to indicate this fact, this article is hereby marked “advertisement” in accordance with 18 USC section 1734. This work was financially supported by the European Union's Seventh Framework Programme (FP7/2007-2013) under grant agreement HEALTH-F2-2011-278850 (INMiND), the Danish Research Agency, the Toyota Foundation, the Research Committee of Rigshospitalet, and the Desirée and Niels Yde’s Foundation. No other potential conflict of interest relevant to this article was reported.
Acknowledgments
Professor Denis Guilloteau, Université François Rabelais de Tours in France, is kindly acknowledged for the contribution to implement 123I-CLINDE as a radiotracer for human use. We acknowledge Svitlana Olsen and Glenna Skouboe for technical assistance and Klaus Holst for knowledge-sharing in biostatistical analysis.
Footnotes
Published online Nov. 11, 2014.
- © 2014 by the Society of Nuclear Medicine and Molecular Imaging, Inc.
REFERENCES
- Received for publication June 17, 2014.
- Accepted for publication October 9, 2014.


