


Abstract
Recently, PET response criteria in solid tumors (PERCIST) have been proposed as a new standardized method to assess chemotherapeutic response metabolically and quantitatively. The aim of this study was to evaluate therapeutic response to neoadjuvant chemotherapy for locally advanced esophageal cancer, comparing PERCIST with the currently widely used response evaluation criteria in solid tumors (RECIST). Methods: Fifty-one patients with locally advanced esophageal cancer who received neoadjuvant chemotherapy (5-fluorouracil, adriamycin, and cisplatin), followed by surgery were studied. Chemotherapeutic lesion responses were evaluated using 18F-FDG PET and CT according to the RECIST and PERCIST methods. The PET/CT scans were obtained before chemotherapy and about 2 wk after completion of chemotherapy. Associations were statistically analyzed between survival (overall and disease-free survival) and clinicopathologic results (histology [well-, moderately, and poorly differentiated squamous cell carcinoma], lymphatic invasion, venous invasion, clinical stage, pathologic stage, resection level, reduction rate of tumor diameter, reduction rate of tumor uptake, chemotherapeutic responses in RECIST and PERCIST, and pathologic response). Results: There was a significant difference in response classification between RECIST and PERCIST (Wilcoxon signed-rank test, P < 0.0001). Univariate analysis showed that lymphatic invasion, venous invasion, resection level, pathologic stage, and PERCIST were significant factors associated with disease-free or overall survival in this study. Although multivariate analysis demonstrated that venous invasion (disease-free survival: hazard ratio [HR] = 4.519, P = 0.002; overall survival: HR = 5.591, P = 0.003) and resection level (disease-free survival: HR = 11.078, P = 0.001) were the significant predictors, PERCIST was also significant in noninvasive therapy response assessment before surgery (disease-free survival: HR = 4.060, P = 0.025; overall survival: HR = 8.953, P = 0.034). Conclusion: RECIST based on the anatomic size reduction rate did not demonstrate the correlation between therapeutic responses and prognosis in patients with esophageal cancer receiving neoadjuvant chemotherapy. However, PERCIST was found to be the strongest independent predictor of outcomes. Given the significance of noninvasive radiologic imaging in formulating clinical treatment strategies, PERCIST might be considered more suitable for evaluation of chemotherapeutic response to esophageal cancer than RECIST.
In today’s medicine, various treatment options for cancer are available. The selection of an effective treatment and the appropriate evaluation of treatment response are important both for better management of cancer patients with prolonged survival and for preserving quality of life. Many approaches to objectively assess treatment response, which began with the original report by Moertel in 1976 and the subsequent World Health Organization criteria in 1979 and were followed by the Response Evaluation Criteria in Solid Tumors (RECIST) in 2000 and RECIST 1.1 in 2009 (1–4), have been developed. RECIST is widely used as an anatomic tumor response metric but is known to have limitations in the cases with tumors that have obscure margins or scar tissue after treatment. Especially in patients with esophageal cancer, the measurement of the longest diameter of lesions on CT and resultant evaluation of treatment response are difficult. Moreover, some caution is required when predicting outcomes with novel molecularly targeted cancer treatments with RECIST, which is based on the reduction rate of morphologic size (5–10). Such treatments, which tend to be more cytostatic than cytocidal, offer a substantial improvement in outcome, even without major shrinkage of tumors as evidenced by the partial response (PR) or complete response (CR) in RECIST (11,12).
PET with the glucose analog 18F-FDG has been widely used as a technique for evaluating metabolic activity in tumors. 18F-FDG PET is believed to be more informative for the evaluation of treatment response after chemotherapy (13). Recently, Wahl et al. proposed the PET Response Criteria in Solid Tumors (PERCIST) as a new standardized method for the quantitative assessment of metabolic tumor response. This method was proposed after review of approximately 3,000 potentially relevant references regarding qualitative and quantitative approaches to tumor response assessment with 18F-FDG PET (14). Although the concept behind the method is quite reasonable, PERCIST should be properly evaluated with regard to advantages over RECIST in clinical cases. The aim of this study was to compare the PERCIST and RECIST methods for evaluation of therapeutic response to neoadjuvant chemotherapy in patients with esophageal cancer.
MATERIALS AND METHODS
Study Design
Records of 64 patients with histologically confirmed squamous cell carcinoma of the thoracic esophagus, who underwent neoadjuvant chemotherapy at the Department of Gastroenterological Surgery, Osaka University Graduate School of Medicine, between June 2007 and March 2010, were reviewed. At baseline, all patients underwent esophageal fiberscopy, esophagography, and enhanced CT from the neck to the abdomen for tumor staging according to the TNM classification (15). CT image acquisition began 50 s after intravenous injection of contrast medium (iodine content, 300 mg of iodine/mL) at a rate of 2 mL/s. All patients were newly diagnosed and had no prior treatment. Our indication for neoadjuvant chemotherapy was as follows: patients with any tumor depth (clinical T1–4) and lymph node involvement, including regional lymph node (N1) and distant lymph node (M1 lym) without distant organ metastases. Clinical T1–3N1 was regarded as an absolute indication, and either cT3N0 with a larger primary tumor or any cT4N, except those with massive infiltration to the bronchus or aorta, was regarded as a relative indication. With regard to M1 lym, the cervical and celiac lymph nodes served as an indication for neoadjuvant chemotherapy, but M1 lym in other sites, such as paraabdominal aorta, axilla, and hematogenic or disseminated metastases, were not indicative. All patients were also younger than 80 y of age and had normal function of the heart, liver, kidney, and bone marrow. As a result, 64 consecutive patients received neoadjuvant chemotherapy. Among these, 8 did not undergo PET/CT before chemotherapy in our institution, and 5 showed no surgical indication after neoadjuvant chemotherapy: 3 of 5 needed additional chemotherapy or radiation therapy because of progression of primary tumor or metastases, and the remaining 2 were transferred to another hospital. Thus, 51 patients, who underwent both neoadjuvant chemotherapy and surgery, were enrolled in the final retrospective study. Approval from the internal Ethics Review Board was obtained before study initiation.
Treatment
Chemotherapy was performed at the Department of Gastroenterological Surgery. All patients received the same regimen of neoadjuvant chemotherapy (5-fluorouracil, adriamycin, and cisplatin) (16). The chemotherapy regimen consisted of 2 courses of 5-fluorouracil, cisplatin, and adriamycin, with cisplatin (70 mg/m2) and adriamycin (30 mg/m2) given intravenously over 2 h on day 1 and 5-fluorouracil (700 mg/m2) administered by continuous intravenous infusion on days 1–7. This course was repeated every 28 d unless patients showed progressive disease after the first course: 2 courses were performed. All patients underwent surgery 3–5 wk after the completion of neoadjuvant chemotherapy. Surgery consisted of en bloc esophagectomy, reconstruction with a gastric tube, and 2- or 3-field lymphadenectomy.
PET/CT Protocol
PET/CT was performed with an integrated scanner (Gemini GXL; Philips). Whole-body images, generally from the top of the skull to mid thigh, were acquired about 60 min after intravenous injection of 18F-FDG at the dose of 3.7 MBq (0.10 mCi)/kg of weight. PET was performed using the following parameters: 3-dimensional emission scan, 2-min scan per bed position × 11 positions, ordered-subset expectation maximization reconstruction, and 4.0-mm slice thickness per interval. Acquisition parameters for CT were as follows: breath-hold during normal expiration from the level of apex of lungs to the lower pole of kidneys; no intravenous or oral contrast medium; 120 kVp and 50 effective mAs; 16 slices; 1.5-mm detector collimation; and 5.0-mm slice thickness, with a 4.0-mm interval. Coronal and sagittal CT images were reconstructed using axial thin-section CT images with 1.5-mm slice thickness. The PET/CT scans were obtained before chemotherapy and about 2 wk after completion of neoadjuvant chemotherapy.
Image Analysis According to PERCIST
The software used for this study might have limitations in obtaining the peak SUV (SUVpeak) as exactly specified in PERCIST 1.0 (14). These limitations are due to a maximum standardized uptake value (SUV = tumor activity concentration/injected dose/body weight) that is not necessarily included in the volume of interest because of the noise effects from patients’ bodies. We used a modified method to obtain SUVpeak as follows. First, the entire tumor was enclosed using a manual volume of interest to determine the pixel with the maximum SUV in the tumor on PET. Second, the mean SUV of tumor on PET was measured using a maximal 1.2-cm-diameter volume of interest, which was placed on the hottest area within each tumor that included the pixel with the maximum SUV. This mean SUV of the tumor by the volumetric method corresponded to SUVpeak of tumor. The SUVpeak was normalized to the peak lean body mass SUV (SULpeak) (SUVpeak × [lean body mass]/[total body mass]). Lean body mass was calculated according to previously published formulas (17). Finally, it was determined whether the SULpeak of the tumor was higher than 1.5 times the liver SUL mean + 2 SDs (in a 3-cm-diameter spheric region of interest in the normal right lobe of the liver) (14). Objective therapeutic responses according to PERCIST 1.0 (14) were as follows: complete metabolic response (CMR) was complete resolution of 18F-FDG uptake within the measurable target lesion so that it was less than mean liver activity (1.5 × [mean SUL of the liver] + 2 SDs) and indistinguishable from surrounding background blood-pool levels with no new 18F-FDG–avid lesions in a pattern typical of cancer. Partial metabolic response (PMR) was reduction of a minimum of 30% in the target tumor 18F-FDG SULpeak, with measurement commonly done in the same lesion as the baseline measurement, but a different lesion was used if the second lesion was previously present and was observed to be the most active lesion after treatment. Stable metabolic disease (SMD) was disease other than CMR, PMR, or progressive metabolic disease (PMD); and PMD was a 30% increase in 18F-FDG SULpeak or advent of new 18F-FDG–avid lesions that were typical of cancer and not related to treatment effect or infection.
Image Analysis According to RECIST
We first evaluated the hottest lesion in patients with esophageal cancer in the present study according to PERCIST 1.0 (14). The hottest lesion in each patient was a primary site of esophageal cancer in this study. Then, to compare with the metabolic change in PERCIST 1.0, we also evaluated the anatomic size change of the single primary site assessed in PERCIST 1.0: the longest diameter was measured according to RECIST 1.1 (4).
Enhanced CT and PET/CT images were transferred to workstations (Advantage Workstation, Volume Viewer 2 AW, Suite 2.0 6.5.1z; GE Healthcare). Unidimensional measurements of the long axis of tumors on coronal CT images were performed using a caliper on the monitor, with reference to multiplanar reconstruction images (axial, coronal, and sagittal imaging) and enhanced CT images. Objective therapeutic responses according to RECIST 1.1 (4) were as follows: complete response (CR) was disappearance of tumor foci for at least 4 wk; partial response (PR) was a decline of at least 30% in tumor diameter for at least 4 wk; stable disease was neither PR nor progressive disease (PD); and PD was at least a 20% increase in tumor diameter for at least 4 wk.
Evaluation According to Pathologic Criteria
Histopathologic findings were classified according to the TNM classification (15): pathologic T staging (pT0–4), pathologic lymph node staging (pN0–1), pathologic distant lymph node (pM1 lym) without distant organ metastasis, and pathologic staging (pStage 0/I/II/III/IV). The degree of tumor differentiation (well-, moderately, and poorly differentiated squamous cell carcinoma), existence of lymphatic invasion and venous invasion, resection level (complete tumor resection [R0], microscopic residual tumors [R1], and macroscopic residual tumors [R2]), and pathologic responses to chemotherapy were also evaluated by a pathologist. Pathologic response to chemotherapy was assessed according to the percentage of viable residual tumor cells within the postoperative cancerous tissue (18): grade 3, no viable cancer cells; grade 2, viable cancer cells accounting for less than a third of tumor tissue (i.e., more than two thirds of cancer cells are severely degenerated or necrotic); grade 1b, viable cancer cells accounting for a third or more, but less than two thirds, of tumor tissue; and grade 1a, viable cancer cells accounting for more than two thirds of tumor tissue. Therapy-induced characteristics such as necrosis, fibrosis, foamy histiocytes, mucosal edema, vascular changes in the tumor periphery, and giant cell reactions were considered to be signs of neoplastic regression after neoadjuvant chemotherapy (19).
Statistical Analysis
Response classifications of RECIST and PERCIST were graded on a 5-point ordinal scale: in RECIST, not classifiable = 0, PD = 1, stable disease = 2, PR = 3, and CR = 4; and in PERCIST, not classifiable = 0, PMD = 1, SMD = 2, PMR = 3, and CMR = 4. We statistically compared the median values of RECIST and PERCIST using the Wilcoxon signed-rank test. Overall survival (OS) and disease-free survival (DFS) were calculated by the Kaplan–Meier test and statistically evaluated by the log-rank test. Associations between survival and clinicopathologic results (such as chemotherapeutic responses including changes of imaging parameters and pathologic factors) were evaluated using univariate Cox proportional hazards regression analysis for both DFS and OS. Significant parameters identified by univariate analysis were included in a multivariate Cox proportional hazards regression analysis (stepwise selection [Wald] method; P ≤ 0.05 was used for entry into the model, and P > 0.1 was selected for removal). Each cutoff value in the reduction rate of tumor diameter and SULpeak that yielded the largest difference in survival and recurrence was decided using the receiver-operating-characteristic method. All statistical analyses were performed using commercially available software (MedCalc, version 8.0.0.1; Frank Schoonjans). A P value of 0.05 or less was considered statistically significant.
RESULTS
Fundamental Data of Patients
Characteristics of all 51 patients included in this study are summarized in Tables 1 and 2. Blood glucose levels at each PET/CT study before and after 2 courses of chemotherapy were less than 150 mL/dL in 50 patients. In the remaining patient, blood glucose level at PET/CT after 2 courses of chemotherapy was 154 mg/dL, which was considered to have no harmful effects on accumulation of 18F-FDG. There was almost no difference in uptake time between PET/CT before and after 2 courses of chemotherapy. The interval between PET/CT scans obtained before and after 2 courses of chemotherapy was 85.7 d ± 2.5 (mean ± SD). The interval between completion of chemotherapy and the acquisition of the PET/CT scan was about 2 wk (mean ± SD, 15.1 d ± 1.3; range, 14–18 d). The interval between completion of chemotherapy and the implementation of surgery was about 3–5 wk (23.2 ± 2.2 d; range, 21–34 d). Lean body mass was calculated using body weight and height as shown in Table 2: before chemotherapy, 47.5 ± 8.9 kg (mean ± SD), and after 2 courses of chemotherapy, 47.2 ± 8.8 kg. With regard to pathologic response to chemotherapy, grade 1a was achieved in 29 patients, grade 1b in 13, grade 2 in 6, and grade 3 in 3. Three patients with grade 3 had pStage 0 without lymphatic or venous invasion.
Characteristics of 51 Patients Who Received Preoperative Chemotherapy for Esophageal Squamous Cell Carcinoma
Parameters Before and After Chemotherapy for Esophageal Cancer
Treatment Response Assessments in RECIST and PERCIST
Results from RECIST and PERCIST are summarized in Table 3. In RECIST, the longest diameter of the lesion was not available with CT from 5 patients because tumors were not visible on the CT images. In the remaining 46 patients, the reduction rate of the tumor diameter was 34.8% ± 21.8% (mean ± SD). Objective therapeutic responses according to RECIST 1.1 were as follows: 0 CR, 26 PR, 20 stable disease, 0 PD, and 5 not classifiable. On the other hand, according to PERCIST, the SULpeak on PET/CT was available for all 51 patients. The reduction rate of the SULpeak was 53.3% ± 23.4% (mean ± SD). Seventeen of the 51 tumors exhibited a low SULpeak (mean ± SD, 1.59 ± 0.33) after completion of chemotherapy, which was less than the liver background level (mean ± SD, 2.17 ± 0.31) and indistinguishable from surrounding background blood-pool levels. Thus, CMR was achieved in these 17 patients. Objective therapeutic responses according to PERCIST 1.0 were as follows: 17 CMR, 26 PMR, 8 SMD, 0 PMD, and 0 not classifiable. There was a significant difference in the results of response classification between RECIST and PERCIST (Table 4; P < 0.0001) (Fig. 1).
Therapy Response Assessments from RECIST and PERCIST
Comparison of Treatment Response Assessments in RECIST and PERCIST

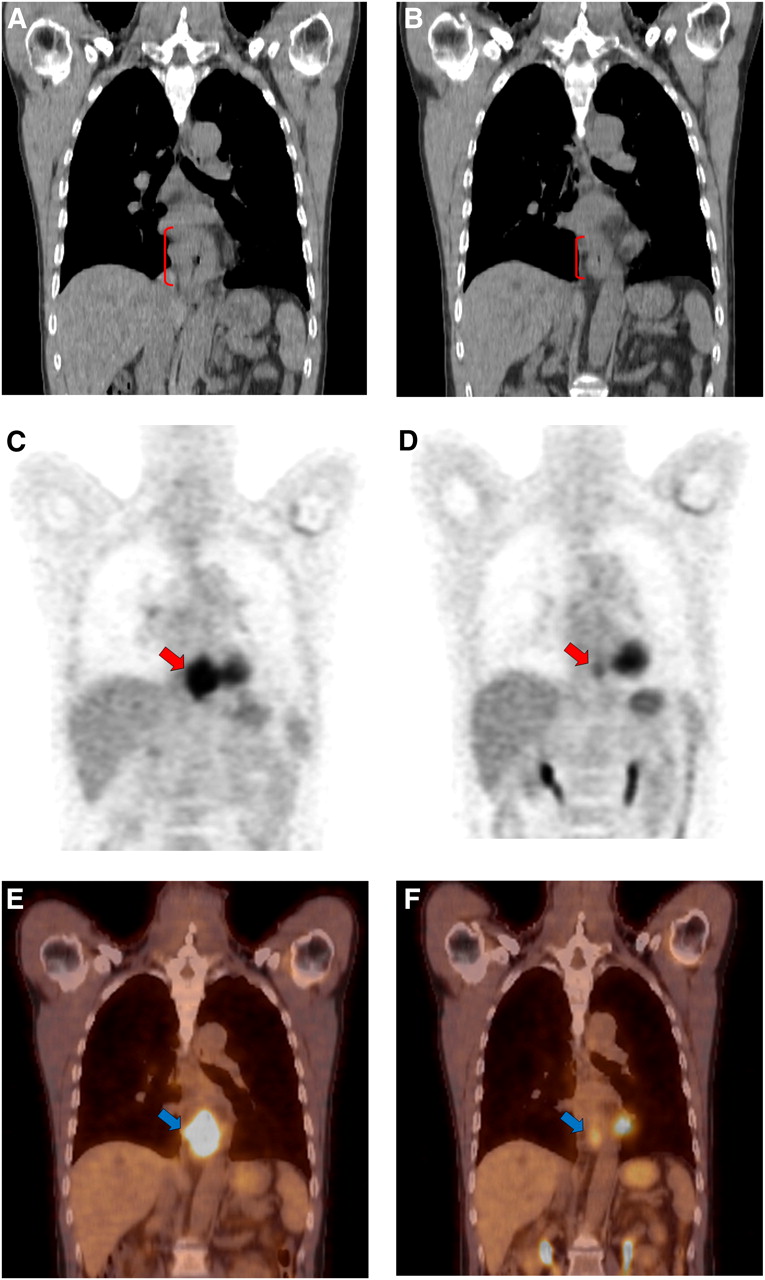
A 58-y-old man with cancer in lower thoracic esophagus. CT (coronal image) before chemotherapy (A) shows that long axis of tumor is 77 mm (red arcuate line). CT (coronal image) after chemotherapy (B) shows that the long axis of tumor is 58 mm (red arcuate line). Reduction rate is 25%. Objective therapeutic response on RERCIST is stable disease. Tumor SULpeak before chemotherapy is 10.52 on 18F-FDG PET (C) and 18F-FDG PET/CT (E) (red and blue arrows). Tumor SULpeak after chemotherapy is 2.58 on 18F-FDG PET (D) and 18F-FDG PET/CT (F) (red and blue arrows). Reduction rate is 75%. Tumor SUL is distinguishable from surrounding background blood-pool levels. Objective therapeutic response on PERCIST is PMR. This patient underwent 18F-FDG PET/CT scan 14 d after chemotherapy. Interval between 18F-FDG PET/CT scans obtained before and after chemotherapy was 82 d in this patient. There is a difference in results of response classification between RECIST and PERCIST. There is no recurrence and no death at 501 d after operation in this case. Therefore, PERCIST appears to be more appropriate as a therapeutic response.
Relationship Between Pathologic Response and Either RECIST or PERCIST
In the present study, the distribution of pathologic responses in CR and PR (RECIST 1.1) was 13 grade 1a, 7 grade 1b, 4 grade 2, and 2 grade 3, and in CMR and PMR (PERCIST 1.0) it was 23 grade 1a, 11 grade 1b, 6 grade 2, and 3 grade 3 (Table 5). Good chemotherapeutic responses (e.g., CR and PR in RECIST and CMR and PMR in PERCIST) according to either RECIST or PERCIST did not always correlate with good pathologic responses (e.g., grade 2 or 3).
Comparison of Treatment Response Assessments Between Pathologic Response and Either RECIST or PERCIST
Chemotherapeutic Responses and Clinicopathologic Factors Affecting Survival
Associations between survival and clinicopathologic results (such as chemotherapeutic responses including changes of imaging parameters and pathologic factors) were assessed using univariate and multivariate Cox proportional hazards regression analyses (Table 6). A cutoff value of 23% in the reduction rate of tumor diameter yielded the largest difference in both DFS and OS. A cutoff value of 54% in the SULpeak yielded the largest difference in OS, and a cutoff value of 69% in the SULpeak yielded the largest difference in DFS. However, these cutoff values were not considered to be significant prognostic factors in the univariate Cox proportional hazards regression analysis. Lymphatic invasion, venous invasion, pathologic stage, and PERCIST were significant factors associated with DFS and OS in this study. Resection level was a significant factor associated with DFS in this study. RECIST was not a significant prognostic factor (Fig. 2). Pathologic response was also not a significant prognostic factor.
Univariate and Multivariate Cox Proportional Hazards Regression Analysis for Prediction of DFS and OS

Kaplan–Meier analyses. OS and DFS in patients who underwent curative resection (R0 = 48, R1 = 3, and R2 = 0) after neoadjuvant chemotherapy according to RECIST and PERCIST: OS (A) and DFS (B) based on whether patients achieved a complete and partial response (CR·PR) or not (non-CR·PR) according to RECIST; and OS (C) and DFS (D) based on whether patients achieved CMR or non-CMR according to PERCIST. Patients achieving CMR had significantly improved OS (2 y, 48.9% [non-CMR] vs. 88.9% [CMR], P = 0.014) and DFS (2 y, 44.6% [non-CMR] vs. 81.9% [CMR], P = 0.018). However, patients achieving a CR·PR did not have significantly improved OS [2 y, 57.8% (non-CR·PR) vs. 58.0% (CR·PR), P = 0.545] and DFS (2 y, 48.4% [non-CR·PR] vs. 57.7% [CR·PR], P = 0.921). P values were obtained using log-rank statistics.
Multivariate Cox proportional hazards regression analysis, including statistically significant factors in univariate analysis, demonstrated that venous invasion was the significant prognostic factor for predicting DFS (hazard ratio [HR], 4.519; 95% confidence interval [CI], 1.748–11.680; P = 0.002) and OS (HR, 5.591; 95% CI, 1.821–17.162; P = 0.003; Table 6) and that resection level was the significant prognostic factor for predicting DFS (HR, 11.078; 95% CI, 2.749–44.651; P = 0.001; Table 6). However, if factors obtained from the process of treatment response assessment (reduction rate of diameter, reduction rate of SULpeak, RECIST 1.1, PERCIST 1.0, and pathologic response) were considered, PERCIST 1.0 (CMR vs. non-CMR) was the most significant prognostic factor for predicting DFS (HR, 4.060; 95% CI, 1.195–13.789; P = 0.025) and OS (HR, 8.953; 95% CI, 1.188–67.506; P = 0.034; Table 6) in the multivariate Cox proportional hazards regression analysis.
DISCUSSION
This study demonstrated that pathologic venous invasion and resection level were the significant prognostic factors for predicting survival or recurrence in esophageal cancer. However, accurate information about pathologic venous invasion and resection level was obviously difficult to obtain before operation. Considering that imaging is commonly and widely used to evaluate treatment response as a noninvasive procedure, PERCIST was considered to be the best for evaluation of treatment response, which was closely related to prognosis.
Multidisciplinary treatments such as neoadjuvant chemotherapy or radiotherapy followed by surgery are now frequently adopted in patients with locally advanced esophageal cancer. All patients in the present study received neoadjuvant chemotherapy before surgery. Patient selection for such multidisciplinary treatments and subsequent preoperative staging can influence improvement of survival in patients with advanced esophageal cancer. Recent studies have also suggested that patients with locally advanced esophageal cancer responding to chemoradiotherapy might not receive any additional benefit from surgery, as compared with chemoradiotherapy alone (20,21). Therefore, the appropriate selection of methods for evaluation of therapeutic efficiency is crucial for effective cancer treatment. As a prospective randomized trial demonstrated that imaging response was the most important independent prognostic factor in esophageal cancer (20), more accurate assessment methods of imaging for better prognosis should be pursued.
There have been previous reports (22–24) on the utility of response evaluation of neoadjuvant chemotherapy with 18F-FDG PET in locally advanced esophageal cancer. These reports have demonstrated that cutoff values of maximum SUV reduction rate, determined in each study, were useful for discrimination of PET responders from nonresponders (22–24). However, these values showed variations ranging from 35% to 70%. Regarding prediction of pathologic response (25) and outcomes (26), there have been reports that have exhibited the potentials of 18F-FDG PET in locally advanced esophageal cancer. However, some studies have supported these results for pathologic response (27–31) and survival (28,30–32), but other reports have not (33–35). The main reasons for the variation in the results may be due in part to the wide variety of 18F-FDG PET evaluation criteria, timing after the start of therapy, techniques, and endpoints used. As for timing after the start of therapy, some studies performed 18F-FDG PET before and after early cycles of chemotherapy and others before and after completion of therapy (22,24,29). This timing was closely related to the criteria used to define a response on PET. Thus, a standardized method should be established to evaluate therapeutic response. In the present study, neither reduction rates of SULpeak on PET nor reduction rates of tumor diameter on CT were demonstrated to be useful for prediction of survival and recurrence, although patient classification with PERCIST better predicted these prognostic parameters. One possible reason is that even if reduction rate in SUL is high, residual tumors after treatment often exhibit intense 18F-FDG uptake. Moreover, even if reduction rate in SUL is low, residual tumors show faint 18F-FDG uptake, which is less than mean liver activity and indistinguishable from surrounding background blood-pool levels. Therefore, reduction rate in SUL may not always correlate to prognosis. PERCIST might be more useful in predicting the prognosis because both the reduction rate in SUL and the value of SUL after chemotherapy are evaluated.
The RECIST (4) method, a widely applied tumor response metric, is known to have limitations, because it depends on morphologic changes (14). 18F-FDG PET is considered to overcome such limitations, because metabolic changes are closely related to malignant potential of tumors (36) and thus may be the most accurate noninvasive imaging modality for initial staging and response assessment in esophageal cancer (37). PERCIST—that is, RECIST using 18F-FDG PET—has recently been proposed as a standardized method for evaluation of metabolic tumor response (14). In the present study, no information regarding therapeutic response according to RECIST could be obtained for 5 patients because the primary lesions were not visible on CT. PERCIST provided therapeutic responses for all patients in the present report, including the 5 patients who could not be evaluated with RECIST. There was a significant difference in the results of response classification between RECIST and PERCIST. PERCIST was found to be the strongest independent predictor of outcomes in patients with esophageal cancer receiving neoadjuvant chemotherapy. To our knowledge, this is the first report demonstrating the correlation between therapeutic responses and prognosis in esophageal cancer using PERCIST.
Limitations in this study included the retrospective nature of patient data collection. However, protocols of chemotherapy and PET or timing of PET before and after treatment were almost uniform in all patients: the date between completion of chemotherapy and the acquisition of the PET/CT scan ranged from 14 to 18 d (15.1 ± 1.3 d). Second, according to RECIST, no patients were evaluated as CR. Also, patients showing PD were excluded from the analyses because this study dealt only with patients who underwent surgery after effective neoadjuvant chemotherapy. Thus, prognosis was compared between PR and stable disease groups with the RECIST method, whereas prognosis was compared between CMR and non-CMR groups with the PERCIST method. Further study will be needed to evaluate response to neoadjuvant chemotherapy for esophageal cancer patients who have progressive disease, comparing RECIST with PERCIST. Finally, in the present study, we evaluated the longest diameter of just 1 target lesion that was assessed in PERCIST. In a precise sense, it might have been ideal that 5 target lesions were evaluated in RECIST 1.1. However, because RECIST 1.1 suggests that just 3 lesions (not 5 lesions) may be used in randomized studies in which tumor progression is the major concern (4,14), the number of lesions to evaluate when assessing response to therapy may also be important in both RECIST and PERCIST. Further study from this viewpoint will be needed in the future.
CONCLUSION
This study demonstrates that PERCIST might be a more suitable method than RECIST for the evaluation of response of esophageal cancer to neoadjuvant chemotherapy. PERCIST, a new standardized evaluation method that uses metabolic information from PET (a noninvasive imaging procedure) is expected to provide improved information for therapeutic strategy selection in cancer patients.
DISCLOSURE STATEMENT
The costs of publication of this article were defrayed in part by the payment of page charges. Therefore, and solely to indicate this fact, this article is hereby marked “advertisement” in accordance with 18 USC section 1734.
Acknowledgments
No potential conflict of interest relevant to this article was reported.
Footnotes
↵* Contributed equally to this work.
Published online May 11, 2012.
- © 2012 by the Society of Nuclear Medicine, Inc.
REFERENCES
- Received for publication September 27, 2011.
- Accepted for publication January 20, 2012.


Jump to section
Related Articles
Cited By...
- Phase I Study of Epigenetic Priming with Azacitidine Prior to Standard Neoadjuvant Chemotherapy for Patients with Resectable Gastric and Esophageal Adenocarcinoma: Evidence of Tumor Hypomethylation as an Indicator of Major Histopathologic Response
- Early Response of Esophageal Cancer to Neoadjuvant Chemotherapy with Docetaxel-Cisplatin-5-Fluorouracil Represents Sensitivity: A Phase II Study
- Reply to A. Indini et al
- Correlating Surrogate Endpoints with Overall Survival at the Individual Patient Level in BRAFV600E-Mutated Metastatic Melanoma Patients Treated with Vemurafenib
- 18F-Fluorodeoxyglucose Positron Emission Tomography for Evaluating the Response to Neoadjuvant Chemotherapy in Advanced Esophageal Cancer
- Induction Chemotherapy Using FAP for Patients with Stage II/III Squamous Cell Carcinoma of the Esophagus
- Early PET/CT Scan Is More Effective Than RECIST in Predicting Outcome of Patients with Liver Metastases from Colorectal Cancer Treated with Preoperative Chemotherapy Plus Bevacizumab