


Abstract
The aims of this cohort study were to evaluate initial tumor hypoxia in metastatic renal cell carcinoma (mRCC) and its changes after sunitinib treatment, using 18F-fluoromisonidazole PET/CT, and investigate the possible prognostic value of initial tumor hypoxia or its changes under sunitinib therapy. Methods: Antiangiogenic-naive patients with mRCC were prospectively enrolled in this cohort study. Before initiation of sunitinib, CT defined up to 10 targets that were assessed at 1 and 6 mo according to the response evaluation criteria in solid tumors (RECIST). Pretreatment target uptake of 18F-fluoromisonidazole was compared with uptake at 1 mo. Targets were considered hypoxic when their maximal standard uptake value was above mean blood value + 2 SDs. Hypoxic volumes were also computed. Relationships between initial hypoxia status, initial degree of hypoxia, its change at 1 mo, and overall or progression-free survival (OS and PFS, respectively) were assessed by survival analysis. Results: Fifty-three patients were included. Median follow-up was 16.8 mo. 18F-fluoromisonidazole uptake significantly decreased in initially hypoxic target metastases but did not change in others (−22%, P < 10−4, vs. +1.5%, P = 0.77; P = 10−3 between groups). Seventy-five percent of patients with hypoxic metastases were free of progressive disease at 4.8 mo (95% confidence interval, 2.99–11.83), compared with 11.3 mo (95% confidence interval, 3.08–36.9) for other patients (P = 0.02), whereas OS was not significantly different. Changes in tumor hypoxia were not related to PFS or OS. Conclusion: Sunitinib reduced hypoxia in initially hypoxic RECIST target metastases but did not induce significant hypoxia in nonhypoxic RECIST target metastases. Patients with initially hypoxic targets have shorter PFS than others.
A key step in the tumorigenesis of most renal clear cell carcinomas is the loss of function of the von Hippel Lindau protein, resulting in the overexpression of hypoxia-inducible factor and then increased secretion of vascular endothelial growth factor. The latter leads to a progression in tumor vasculature (angiogenesis and neoangiogenesis), tumor proliferation, and metastatic spread (1). This newly formed vasculature is poorly functional, with tortuous immature vessels, anarchic interconnections, increased capillary permeability, and leakage of fluid into the interstitial space resulting in increased interstitial pressure, impairing oxygen diffusion and thus inducing tumor hypoxia.
Tumor hypoxia is a factor of poor prognosis, radioresistance, and chemoresistance (2,3).
Tumor hypoxia can be noninvasively assessed in vivo by 18F-fluoromisonidazole PET/CT. 18F-fluoromisonidazole diffuses through cell membranes. When tissular O2 partial pressure is less than 10 mm Hg, 18F-fluoromisonidazole is reduced in viable cells by nitroreductase. Once reduced, 18F-fluoromisonidazole accumulates intracellularly. One hour after injection, the retention observed is considered specific to cellular hypoxia.
The recent introduction of antiangiogenic agents for the treatment of metastatic renal cell carcinoma (mRCC) is a breakthrough for a condition in which the previously used treatments gave disappointing results. Sunitinib is an antiangiogenic molecule that blocks intracellular signaling and kinase-dependent functions of vascular endothelial growth factor receptor and of platelet-derived growth factor receptor. In a phase III trial, overall survival (OS), progression-free survival (PFS), and response rates were higher in patients receiving sunitinib than in those receiving the former reference drug, α-interferon (4).
The mechanism of action of this molecule on tissue, however, remains unclear. Its positive effects (tumor stabilization) may be outweighed by induction of tumor hypoxia and tumor ischemia. Furthermore, no data are available on the relationship, in patients treated with sunitinib, between initial tumor hypoxia and therapeutic response or on the undesirable potential of antiangiogenic agents to increase tumor hypoxia.
The present cohort study, in patients harboring an mRCC with a clear cell histologic component, sought to assess baseline tumor hypoxia and change after 4 wk of treatment with sunitinib and to assess the prognostic value of both baseline tumor hypoxia and change in tumor hypoxia on disease progression and survival.
MATERIALS AND METHODS
Patients
Inclusion criteria were age between 18 and 80 y; mRCC, with or without previous nephrectomy; not previously treated by antiangiogenic agents; presence of response evaluation criteria in solid tumors (RECIST) target metastasis; Eastern Cooperative Oncology Group performance status of 0–2; adequate hematologic, coagulation, hepatic, renal, and cardiac function; life expectancy of more than 6 mo; and negative pregnancy test for women of childbearing age. Exclusion criteria were uncontrolled hypertension or clinical cardiovascular events, contraindication for sunitinib, another histologic type of renal cancer, renal insufficiency, or allergy to intravenous contrast injection.
The study protocol was approved by the Comité de Protection des Personnes, Île de France II ethics committee. All patients provided written informed consent.
Study Protocol and Patient Follow-up
Initial imaging staging included whole-body 18F-fluoromisonidazole PET/CT and CT with contrast enhancement over head and neck, thorax, abdomen, and pelvis, performed 1–8 d before initiation of treatment and repeated 4 wk after initiation of sunitinib. CT was also repeated at 6 mo. Patients were given oral sunitinib, 50 mg per day during the first cycle (except 1 patient who received 37.5 mg per day), in repeated 6-wk cycles, each comprising a 4-wk treatment period followed by a 2-wk off-treatment period. Reduction in sunitinib dose (to 37.5 mg and then 25 mg daily) was allowed for the management of adverse events, according to the guidelines given in the phase III sunitinib study (5).
Patients were followed up and treated as required by their disease until the last patient had reached 6 mo of follow-up (38 mo after the beginning of the study).
Clinical and imaging data were collected at 6 and 12 mo and at the end of sunitinib treatment. The follow-up period ended on December 15, 2009.
The following major events were recorded to determine time to progression and OS: death, disease progression based on RECIST during follow-up (6), disease progression based on emergence of a new nontarget lesion (RECIST or non-RECIST, such as bone), or treatment change due to disease progression.
Patients were classified as having complete or partial response or stable disease according to RECIST and progressive disease either according to RECIST or if one of the above major events occurred.
CT
A maximum of 10 target lesions were delineated on baseline CT by an experienced radiologist, according to RECIST (6).
Target lesions were assessed at 1 and 6 mo. Complete response was defined as disappearance of target and non target lesions, partial response as a decrease of at least 30% in the sum of the longest diameters of target lesions with respect to the baseline sum, progressive disease as an increase of at least 20% in the sum of the longest diameters of target lesions or the emergence of one or more new lesions, and stable disease as neither sufficient shrinkage to qualify as partial response nor sufficient increase to qualify as progressive disease. Data processing was performed using the definition of progressive data reported on RECIST. Measurements were performed by an experienced radiologist from the patient's own center and reviewed by an experienced radiologist from the core laboratory.
18F-Fluoromisonidazole PET/CT Study
18F-fluoromisonidazole was provided by IASON GmbH. 18F-fluoromisonidazole scanning was conducted after 2 h of fasting, with the patient at rest, and 2–4 h after administration of 5 MBq/kg of 18F-fluoromisonidazole. A dedicated PET/CT system (Gemini GXL; Philips) was used in all the centers participating in the study. Emission scanning was performed from the top of the skull to above-knee level. CT acquisition parameters were as follows: 4-mm-thick transaxial images; pitch of 1.5, 120 kV, and 120 mAs; slice thickness of 5 mm, with reconstruction in 2-mm slices every 2 mm; pitch of 1; collimation, 16 × 1.5; standard resolution; and field of view, 600 mm. PET data were acquired in 3-dimensional mode, at 3 min per step. Slices corrected and noncorrected for attenuation by an iterative method (row-action maximum likelihood algorithm, 3-dimensional high-resolution algorithm) and a CT attenuation map were reconstructed. Native PET slice thickness was 4 mm. Data from the participating centers were transmitted to the core laboratory on anonymous compact disks.
PET/CT scans were read independently by 2 experienced observers from the core laboratory, who were unaware of the clinical data. Maximal standard uptake values (SUVmax) of all RECIST target metastases were measured on baseline PET/CT and on the PET/CT performed after 4 wk of antiangiogenic treatment.
At baseline, a circular region of interest of 50-pixel area was drawn in the middle part of the left ventricle to estimate circulating blood activity. For each region of interest, the mean standardized uptake value (SUV) was recorded. A second measure of this SUV was made at the same location on the 18F-fluoromisonidazole PET/CT scan obtained after 4 wk of treatment.
SUVmax was considered for target activity (T) and mean SUV for blood activity (B). A target lesion was considered hypoxic if T was above or equaled the mean B of all patients + 2 SDs (95% confidence interval [CI]). Accordingly, patients were defined as hypoxic if they had at least 1 hypoxic metastasis and as nonhypoxic if they had none. For each target, hypoxic volume was computed using a same threshold value of T/B = 1.2 according to previous studies (7). For patients’ prognosis, the following qualitative criteria were used: patients hypoxic at baseline, patients hypoxic at 4 wk, patients decreasing their higher T/B ratio value between the 2 PET scans, and patients decreasing their hypoxic volume by more than 10% and by more than 10 mL.
Statistical Analysis
The size of the cohort was derived from the results of a previous study by Eschmann et al. (8) in patients treated for head and neck cancers or non–small cell lung cancers, for whom normalized uptake in the pretreatment 18F-fluoromisonidazole PET/CT studies differed by 0.8 points between responders and nonresponders and an expected response rate of 20%. A sample size of 53 patients was determined to estimate a difference of 0.8 between the T in hypoxic and nonhypoxic patients, assuming an SD of the difference of 0.6, statistical power of 90%, an α-risk of 5%, and an unbalanced sample size between groups, with 1 hypoxic patient for 4 nonhypoxic patients (ratio, 1:4).
A linear mixed model was used to assess change in PET/CT parameters, and especially T, during the first 4 wk. This model included time (weeks 0 and 4), initial hypoxia status, and interaction between the two. The model took into account the correlation between the measurements obtained at the 2 time points for a given lesion and the correlation between the measurements obtained for several lesions in the same patient. PET/CT parameters were log-transformed, and results were expressed as geometric means or ratios of geometric means with their associated 95% confidence intervals. Survival curves were constructed with the Kaplan–Meier method. The predictive value of initial hypoxia status was tested on OS and PFS (2-tailed log-rank test) and 6-mo RECIST progression (χ2 test, logistic models). Results were expressed as hazard ratios (HRs) or odds ratios with their associated 95% confidence intervals or expressed as mean ± SD. All statistical analyses were performed with SAS (version 9.1; SAS Institute Inc.), and results were considered significant for a P value less than 5%.
RESULTS
Population
From September 2006 to April 2009, 53 patients (42 men and 11 women; mean age ± SD, 62.2 ± 9.4 y), from 6 different teaching hospitals, were enrolled in the study. Participants’ data are summarized in Table 1.
T, Diameter of Metastases, Hypoxic Volume, and Hemoglobin Levels at Baseline
One patient was never treated by sunitinib because of poor blood pressure control. Five patients did not undergo the 2 PET/CT scans required by the protocol (baseline and after 4 wk of treatment): 1 because of poor general health status, making the supine position impossible to sustain for 20 min for PET/CT (the second PET/CT scan was therefore cancelled), 1 because of a lack of radiotracer for the first PET/CT scan (there again, the second PET/CT scan was cancelled), and 3 because of rapid disease progression leading to discontinuation of sunitinib and cancellation of the second PET/CT scan. Therefore, hypoxia both at baseline and after 4 wk of sunitinib was assessed in 47 patients. Patients were given oral sunitinib, 50 mg per day during the first cycle (except 1 patient who received 37.5 mg per day). Results are summarized in Figure 1.

Study flow diagram.
CT Data
At inclusion, the number of RECIST target metastasis sites per patient was 3.9 ± 2.4, for a total number of 183 targets. The sites of RECIST target metastases are listed in Table 2.
Sites of Metastases
At 1 mo, RECIST assessment was available for 47 patients: 3 patients achieved partial response, 41 stable disease, and 3 progressive disease. At 6 mo, RECIST assessment was available for 43 patients: 14 patients achieved partial response, 18 stable disease, and 11 progressive disease (4 patients died before 6 mo). Results are summarized in Figures 1 and 2.

Relationship between tumor response to sunitinib and hypoxic status at baseline. PD = progressive disease; PR = partial response; SD = stable disease.
PET/CT Data
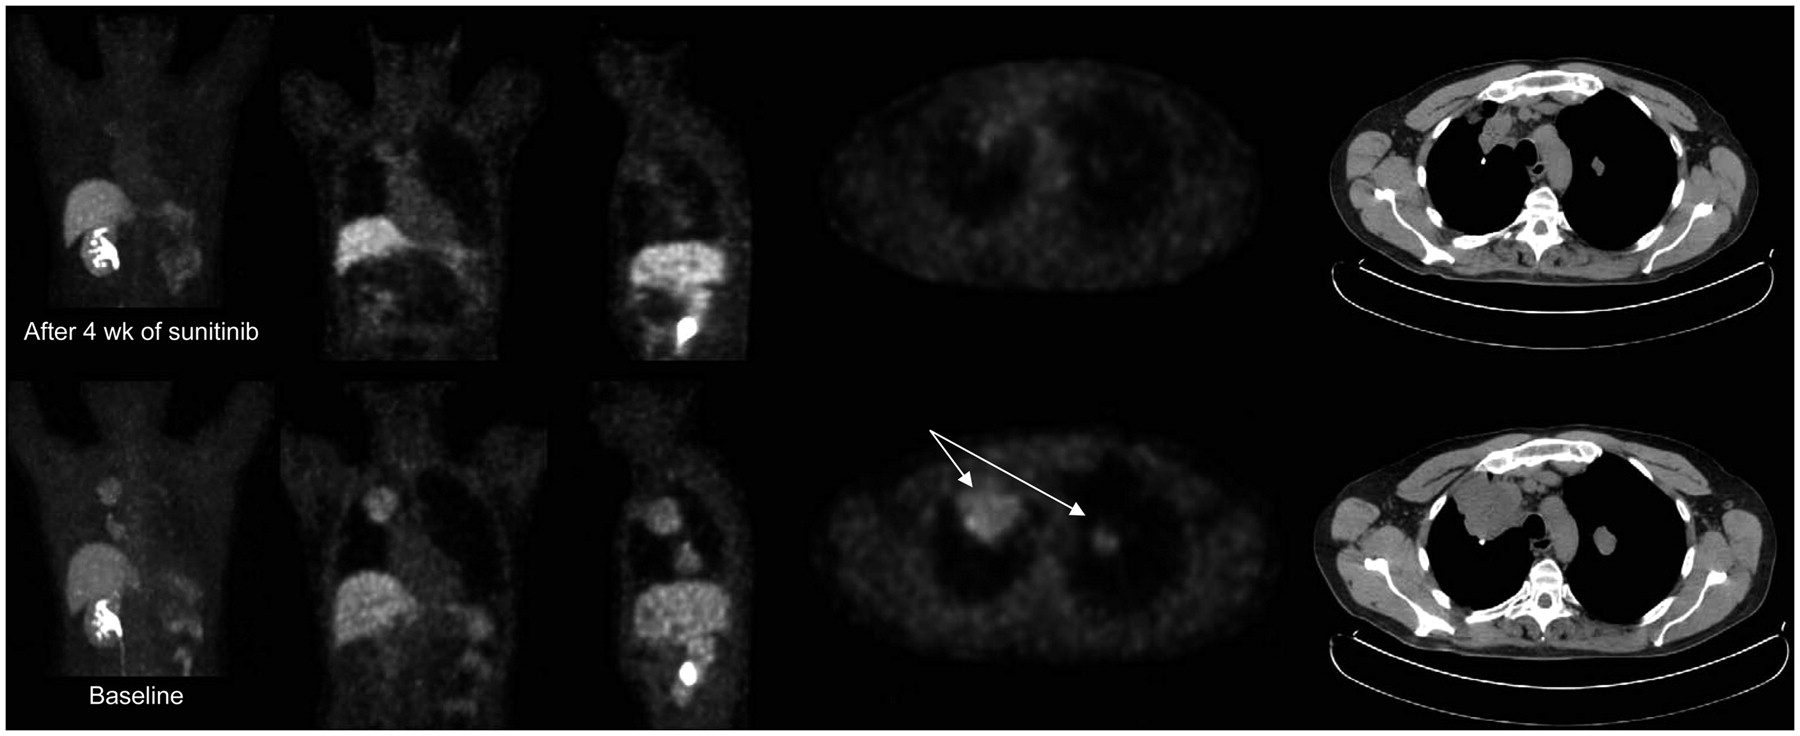
Imaging was performed 3 h 12 min ± 22 min after administration of a 4.92 ± 0.46 MBq/kg dose of 18F-fluoromisonidazole. As at baseline and at 4 wk, mean B values were not significantly different (P = 0.83); both datasets were pooled, and the mean value for B was 0.70 with an SD of 0.26. Therefore a T value above 1.2 (mean + 2 SDs) was used to define target lesions as hypoxic. Interobserver reproducibility for T and B measurement was good (both κ > 0.81). Seventy-two targets were defined as hypoxic (39%). Presence of tumor hypoxia and change in metastasis status are summarized in Figure 1. Changes in T values, hypoxic volumes, evolution of metastasis diameter, and initial hemoglobin concentrations are summarized in Table 1. Nonhypoxic targets significantly decreased their size at 1 mo, whereas there was only a downward trend for hypoxic targets (P = 0.08). Nevertheless, the degree of target hypoxia, as evaluated by 18F-fluoromisonidazole uptake (T), was reduced in initially hypoxic targets and not significantly altered in nonhypoxic targets. Figure 3 is an example of this decrease in lung metastases. Hypoxic volumes were not significantly altered between baseline and 1 mo.

Baseline 18F-fluoromisonidazole PET/CT (bottom row) showing hypoxic level of radiotracer uptake in target lung metastases (arrows on axial views). After 4 wk of sunitinib (top row), tumor shrinkage was observed and 18F-fluoromisonidazole uptake noticeably fell, suggesting decrease in tumor hypoxia.
Relationship Between Imaging Data and Disease Progression or Death
Eighteen patients died during follow-up. PFS and OS were analyzed for the 47 patients who received at least 1 d of sunitinib therapy and underwent the 2 PET/CT scans.
OS was comparable between hypoxic and nonhypoxic patients: 75% of hypoxic patients were still alive at 11.6 mo, compared with 12.3 for others (hazard ratio [HR], 1.01 [95% CI, 0.37–2.74], P = 0.99 on log-rank test) (Fig. 4). Median PFS was 17.4 mo (95% CI, 11.8–25.8) in the whole population. Seventy-five percent of patients without hypoxic metastases were free of progressive disease at 11.3 mo (95% CI, 3.08–36.9), compared with 4.8 mo (95% CI, 2.99–11.83) for other patients with hypoxic metastases (HR, 0.35 [95% CI, 0.14–0.89], P = 0.02 on log-rank test) (Fig. 5).
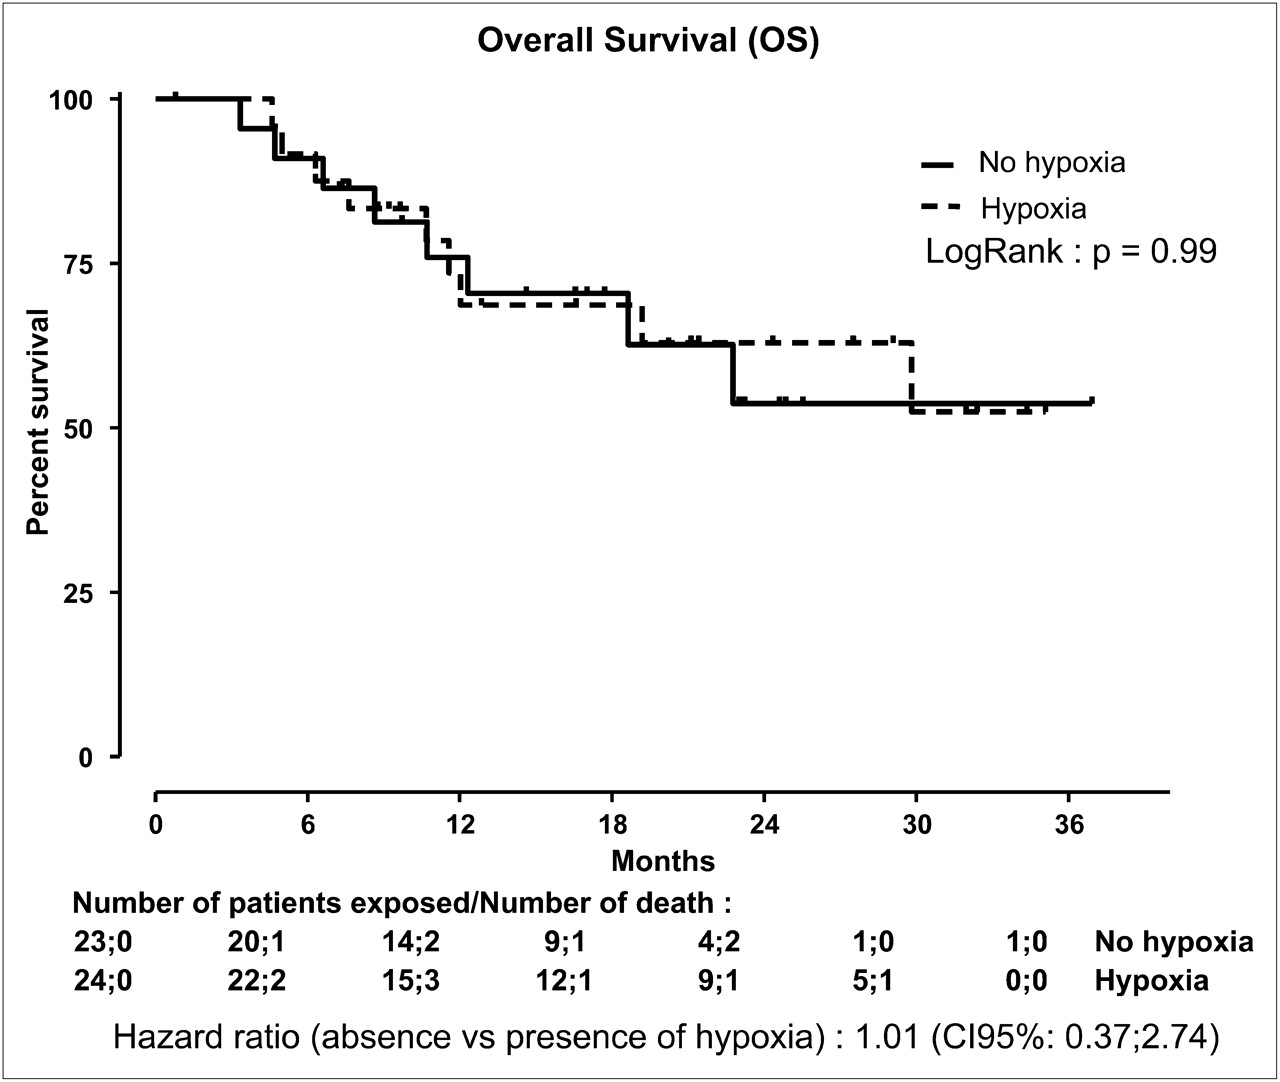
OS in patients with initially hypoxic target metastases (dotted line), compared with others (solid line).
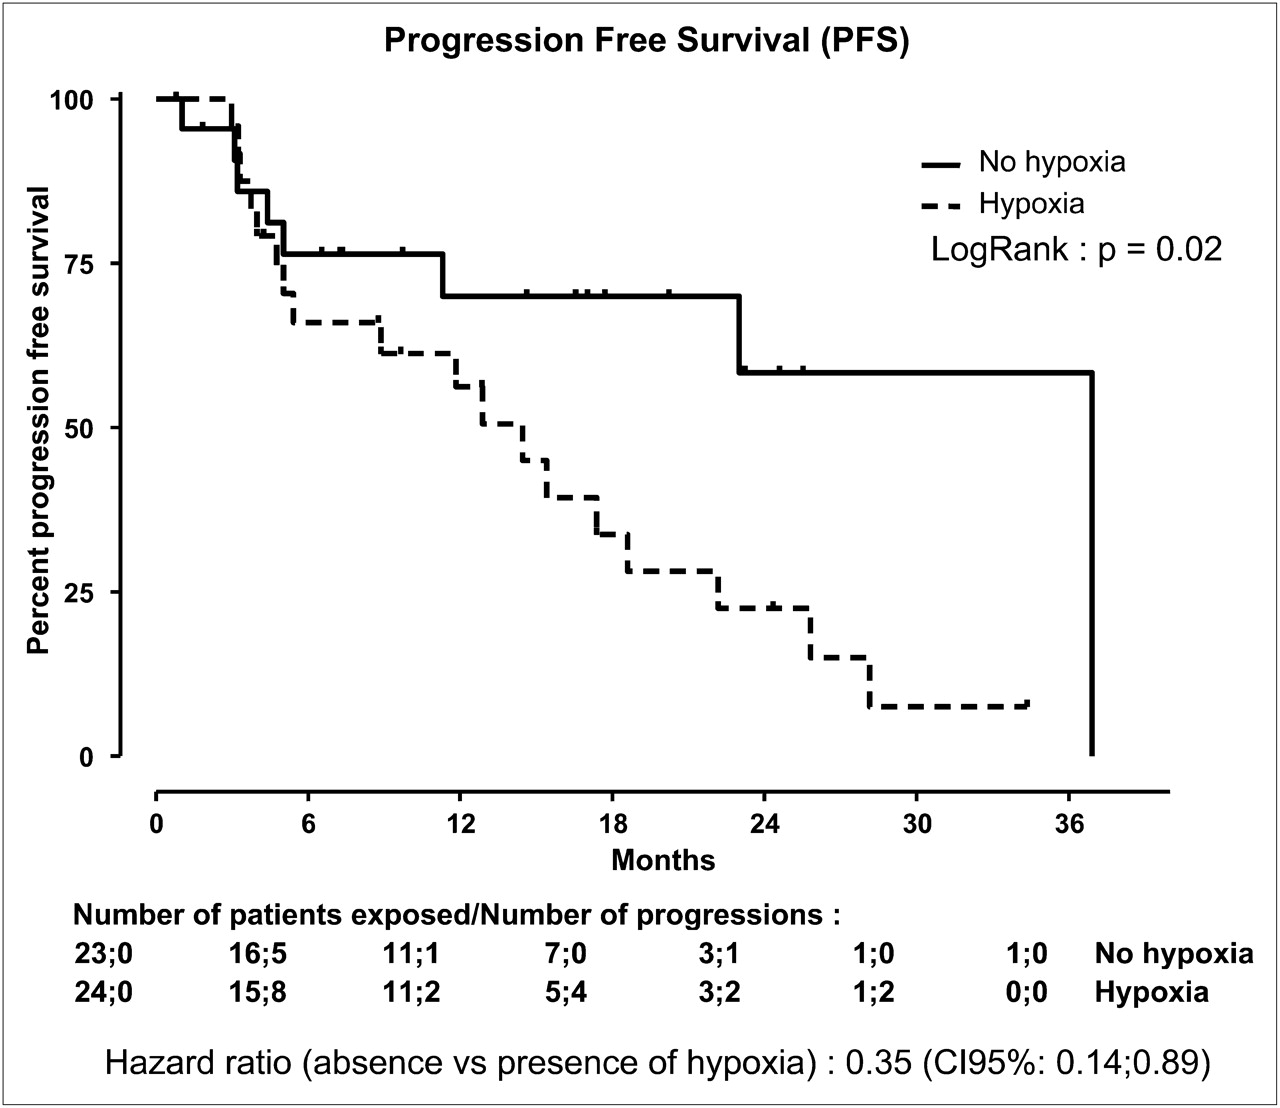
PFS in patients with initially hypoxic target metastases (dotted line), compared with others (solid line).
Persistence of hypoxia after 4 wk of treatment did not predict disease progression. The decrease in tumor hypoxia (T) after 4 wk of treatment did not correlate with PFS (HR, 0.66 [95% CI, 0.37–1.17], P = 0.16) or with OS (HR, 0.92 [95% CI, 0.45–1.88]; P = 0.82). Decrease in T/B ratio and decrease in hypoxic volumes were not related to OS or PFS.
DISCUSSION
Our main result was that 1 mo after initiation of antiangiogenic therapy with sunitinib, target lesions showed decreased 18F-fluoromisonidazole uptake, suggesting that sunitinib decreased the intensity of tumor hypoxia. This result could not be explained by a decrease in tumor size because this decrease was not significant in hypoxic targets. Surprisingly, there is only a trend toward a decrease in hypoxic volume, but this latter parameter depends both on the degree of tumor hypoxia (i.e., T) and on the size of the tumor (i.e., target diameter). Moreover, accuracy of determination of changes in hypoxic volumes may be impaired by partial-volume effects in cases of small variations. Patients with hypoxic metastases had a lower progression-free time interval than others. To our knowledge, this is the first prospective double-blind study on this topic, and the results raise several points of discussion.
18F-fluoromisonidazole is a marker of hypoxia validated in numerous clinical studies. After accumulation in all tissue and slow clearance in normal tissue, cell retention of 18F-fluoromisonidazole has been reported when tissue oxygen pressure decreases below 10 mm Hg (9), and this tracer has been used in several cancers, in which its uptake correlated with poor prognosis (10). In France, 18F-fluoromisonidazole is the only commercially available tracer of hypoxia, raising a problem of logistics (delivery by airplane from the production site, at a distance of more than 750 km from our hospital) and economics (price limiting the number of examinations allowed per patient). Furthermore, interpretation of images using 18F-fluoromisonidazole can be difficult as, unlike with 18F-FDG or 18F-FDOPA, contrast between normal and pathologic tissue can be low, leading to poorly reproducible visual interpretation. Although almost all authors agree with the need for uptake quantification, there is no consensual method for this purpose.
The simplest method is to compute the maximal value of SUV into the target at a time when the tracer is already washed out from nonhypoxic cells and contrast remains high enough: that is, 2–4 h after injection (8). Nevertheless, even under these conditions, there is a large individual variation in 18F-fluoromisonidazole uptake, either in lesions or in nonhypoxic tissue. Apparently, enhanced uptake in a lesion might be due to enhanced circulating blood activity, as tracer clearance through nonhypoxic cells is rather slow. Furthermore, even inside hypoxic target lesions, hypoxia status and 18F-fluoromisonidazole uptake can be heterogeneous (11), and in the case of mixed hypoxic or nonhypoxic cells, given the spatial resolution of PET, the true sensitivity of the detection of tumor hypoxia is generally unknown.
Therefore, several authors suggested normalizing 18F-fluoromisonidazole uptake to a nonspecific signal using blood samples (7). Others suggested using a tumor-to-muscle ratio (12), but most of these studies sought to correlate 18F-fluoromisonidazole uptake to patient outcome after radiotherapy. In the present study, the goal was to evaluate outcome after antiangiogenic treatment; because specific action of the treatment on muscle mass and vasculature could not be ruled out, we chose to define the target SUV threshold for hypoxia with respect to the circulating blood SUVs (7). Nevertheless, contrast in image was rather low, compared with fluoromisonidazole uptake reported, for instance, in brain or in head and neck cancer, leading us to use a low threshold for hypoxic targets (T = 1.2).
The timing for control PET after therapy may also be questionable. To improve the predictive value of 18F-fluoromisonidazole PET/CT for patient outcome after radiotherapy, early postinjection dynamic acquisition was suggested in addition to late T and B measurements, individualizing 3 different patterns: rapid washout, in which the peak circulating blood 18F-fluoromisonidazole signal is followed by rapid washout; an accumulative pattern, in which the peak is followed by tissue tracer retention, indicating tissue accumulation of tracer and then tissue hypoxia; and an intermediate pattern (8). These data are probably dependent on the circulating entry function indicating tissue perfusion and tumor vascularization, which are probably impaired by antiangiogenic agents. In fact, the relationships between global tumor vascularization, perfusion, tissue hypoxia, individual cell hypoxia, and ischemia (mismatch between metabolic needs and oxygen supply balance) are complex and intricate (13–15), and the appropriate methodology may be different according to the clinical issue and the physiopathology of hypoxia. Vaupel et al. (15) described 3 different kinds of hypoxia: perfusion-related acute hypoxia, probably the first step of antiangiogenic action as shown by MRI (16), which is a rather acute phenomenon leading to cell ischemia and increasing the necrotic core of the lesion; anemic hypoxia due to inadequate oxygen blood transport, which could also lead to tumor ischemia; and diffusion-related chronic hypoxia due to impaired oxygen diffusion. This third phenomenon affects the cell layers surrounding the necrotic core and is dependent on its thickness and on several other parameters such as interstitial tissue pressure, capillary permeability, and others. This phenomenon, which was specifically targeted in the present study, may be improved by antiangiogenic agents, as suggested by Jain (13) and preclinical studies. Hillman et al. (16) studied papillary renal cell carcinoma xenografts in mice treated with sunitinib for 7–18 d, using dynamic contrast-enhanced MRI. They also studied the pathologic effects of sunitinib at less than 20 mg/kg per day: at this regimen, after treatment, tumor perfusion increased, whereas vascular permeability decreased. Histologic study showed thinning and regularization of tumor vessels. To our knowledge, the present study provides the first clinical confirmation of these preliminary preclinical results, confirming that the long-term efficacy of sunitinib is not a consequence of chronic tissue hypoxia or ischemia due to tumor starving. Conversely, as sunitinib decreases tumor hypoxia, it may be assumed that it improves tumor vasculature efficacy 1 mo after initiation of treatment.
One limitation of the present study is that, for economic reasons, we could not perform control PET/CT early after treatment initiation. This addition could have investigated perfusion-related acute hypoxia, for which dynamic acquisition could be more reliable. The aim of the study, however, was to assess medium-term antiangiogenic effects, and further studies will be required to evaluate specifically early effects.
The number of hypoxic target lesions and the level of 18F-fluoromisonidazole uptake in renal cancer metastases was rather disappointing, as compared with the data for head and neck cancer published by Jansen et al. (17), for example, for which the mean SUVmax in nodes was around 8, compared with below 2 in the present study. Our findings, on the other hand, are consistent with those of the few reports of the use of 18F-fluoromisonidazole in renal cancer. Lawrentschuk et al. (18) studied hypoxia in 17 renal tumor patients, all explored noninvasively with 18F-fluoromisonidazole, with 3 also explored invasively by polarography. In the 7 of 17 patients with clear cell renal cell carcinoma, the difference between tumor uptake and normal uptake in the contralateral kidney was not statistically significant (mean tumor SUVmax, 1.2 vs. mean contralateral SUVmax, 1.0, P > 0.14). Therefore, median tissue oxygen pressure is probably more elevated in clear cell renal cell carcinoma than in other cancers, and lesions may be less hypoxic than previously suspected.
In the present study, if hypoxic patients had shorter PFS than others, OS was not significantly different and the reduction in tumor hypoxia, surprisingly, did not correlate with either OS or PFS. The OS of our patients was better than that of older series published before the use of antiangiogenic agents (19) but was comparable to that of more recent studies (4). Nevertheless, the first clinical trails reporting efficacy of antiangiogenic agents also demonstrated a benefit on PFS only (5), until follow-up was increased and the benefit on OS could be evidenced (4). Further studies with prolonged follow-up will be required to evaluate the prognostic significance of tumor hypoxia on OS.
Moreover, the relationship between hypoxia and OS is complex. In some studies, such as in head and neck cancer, hypoxia shown by 18F-fluoromisonidazole PET/CT correlated with poor prognosis (3,7,20). On the other hand, it has also been argued, again in head and neck cancer, that the predictive value of 18F-fluoromisonidazole uptake over OS disappears when there is an efficient therapeutic regimen (3).
Nevertheless, disease progression assessment in mRCC patients treated with antiangiogenic agents may be problematic. First, RECIST has been shown to be poorly reproducible (21) and only mildly sensitive, as diameter measurement does not accurately reflect tumor volume (22). Moreover, in patients treated with antiangiogenic agents, the external residual volume found on anatomic imaging may not reflect the true residual tumor cell volume, and conventional imaging may underestimate therapeutic response in cases of stable disease (23,24).
CONCLUSION
Tumor hypoxia as assessed by 18F-fluoromisonidazole PET/CT uptake in mRCC was less frequent and less pronounced than initially suspected. Sunitinib reduced hypoxia in initially hypoxic RECIST target metastases but did not induce significant hypoxia in nonhypoxic RECIST target metastases. This result is consistent with a sunitinib action mechanism based on rationalization of the tumor vascular network and on a persistent decrease in tumor hypoxia.
Tumor hypoxia at baseline is linked to a higher risk of progression in patients treated by sunitinib for mRCC. The prognostic value of 18F-fluoromisonidazole PET/CT performed earlier after initiation of treatment, with dynamic acquisition, has also to be assessed in further studies.
DISCLOSURE STATEMENT
The costs of publication of this article were defrayed in part by the payment of page charges. Therefore, and solely to indicate this fact, this article is hereby marked “advertisement” in accordance with 18 USC section 1734.
Acknowledgments
This study was supported by a grant from the Programme Hospitalier de Recherche Clinique of the French Ministry of Health (AOM no. 05179), Assistance Publique–Hôpitaux de Paris. No other potential conflict of interest relevant to this article was reported.
- © 2011 by Society of Nuclear Medicine
REFERENCES
- Received for publication October 27, 2010.
- Accepted for publication March 24, 2011.


Jump to section
Related Articles
Cited By...
- Sunitinib Prior to Planned Nephrectomy in Metastatic Renal Cell Carcinoma: Angiogenesis Biomarkers Predict Clinical Outcome in the Prospective Phase II PREINSUT Trial
- 18F-Fluoromisonidazole Kinetic Modeling for Characterization of Tumor Perfusion and Hypoxia in Response to Antiangiogenic Therapy
- The Association Between PD-L1 Expression and the Clinical Outcomes to Vascular Endothelial Growth Factor-Targeted Therapy in Patients With Metastatic Clear Cell Renal Cell Carcinoma
- Molecular Subtypes of Clear Cell Renal Cell Carcinoma Are Associated with Sunitinib Response in the Metastatic Setting
- Evaluating digestive neuroendocrine tumor progression and therapeutic responses in the era of targeted therapies: state of the art
- 18F-FDG-PET/CT in Potentially Advanced Renal Cell Carcinoma: A Role in Treatment Decisions and Prognosis Estimation