


Abstract
Multiparametric imaging of tumor perfusion and hypoxia with dynamic 18F-fluoromisonidazole (18F-FMISO) PET may allow for an improved response assessment to antiangiogenic therapies. Cediranib (AZD2171) is a potent inhibitor of tyrosine kinase activity associated with vascular endothelial growth factor receptors 1, 2, and 3, currently in phase II/III clinical trials. Serial dynamic 18F-FMISO PET was performed to investigate changes in tumor biomarkers of perfusion and hypoxia after cediranib treatment. Methods: Twenty-one rats bearing HT29 colorectal xenograft tumors were randomized into a vehicle-treated control group (0.5% methylcellulose daily for 2 d [5 rats] or 7 d [4 rats]) and a cediranib-treated test group (3 mg/kg daily for 2 or 7 d; 6 rats in both groups). All rats were imaged before and after treatment, using a 90-min dynamic PET acquisition after administration of 42.1 ± 3.9 MBq of 18F-FMISO by tail vein injection. Tumor volumes were delineated manually, and the input function was image-derived (abdominal aorta). Kinetic modeling was performed using an irreversible 1-plasma 2-tissue compartmental model to estimate the kinetic rate constants K1, K1/k2, and k3—surrogates for perfusion, 18F-FMISO distribution volume, and hypoxia-mediated entrapment, respectively. Tumor-to-blood ratios (TBRs) were calculated on the last dynamic frame (80–90 min). Tumors were assessed ex vivo by digital autoradiography and immunofluorescence for microscopic visualization of perfusion (pimonidazole) and hypoxia (Hoechst 33342). Results: Cediranib treatment resulted in significant reduction of mean voxelwise 18F-FMISO TBR, K1, and K1/k2 in both the 2-d and the 7-d groups (P < 0.05). The k3 parameter was increased in both groups but reached significance only in the 2-d group. In the vehicle-treated groups, no significant change in TBR, K1, K1/k2, or k3 was observed (P > 0.2). Ex vivo tumor analysis confirmed the presence of hypoxic tumor regions that nevertheless exhibited relatively lower 18F-FMISO uptake. Conclusion: 18F-FMISO kinetic modeling reveals a more detailed response to antiangiogenic treatment than a single static image is able to reveal. The reduced mean K1 reflects a reduction in tumor vascular perfusion, whereas the increased k3 reflects a rise in hypoxia-mediated entrapment of the radiotracer. However, if only late static images are analyzed, the observed reduction in 18F-FMISO uptake after treatment with cediranib may be mistakenly interpreted as a global decrease, rather than an increase, in tumor hypoxia. These findings support the use of 18F-FMISO kinetic modeling to more accurately characterize the response to treatments that have a direct effect on tumor vascularization and perfusion.
Targeting of tumor neovasculature has a potential to limit cancer progression and has led to the development of antiangiogenic drugs approved for treatment of various human malignancies (1). Treatments that normalize or even promote blood vessel growth may enhance drug delivery to tumors (2) and sensitize them to chemotherapy (3). Such agents may also exacerbate hypoxia, which in turn facilitates treatment resistance by promoting neovascularization and regrowth of a more belligerent tumor phenotype (1,2) and is associated with poor overall survival (4). Recent studies that were aimed at alleviating tumor hypoxia while improving tumor perfusion suggested an enhanced outcome in radio-, chemo- and immunotherapies (1).
Cediranib (AZD2171) is a novel, orally administered multi–vascular endothelial growth factor receptor inhibitor (5) that is currently being tested as a maintenance treatment for patients with platinum-sensitive relapsed ovarian cancer. Cediranib affects tumor growth by acutely impeding blood flow to the tumor and results in a dose-dependent growth inhibition (5). However, to reach the full potential of antiangiogenic therapies, clinically relevant patient stratification is crucial. Successful implementation of window-of-opportunity trials (6) that may help select effective drug combinations for specific patients at earlier stages during treatment requires accurate monitoring of treatment response and nuanced understanding of the tumor biology.
18F-fluoromisonidazole (18F-FMISO) is the most widely used PET radiotracer for noninvasive, quantitative, reproducible, and clinically feasible imaging of tumor hypoxia (7–11). However, 18F-FMISO PET scans are usually performed in static mode (9), which does not allow for the simultaneous assessment of blood flow and 18F-FMISO distribution volume and may result in either underestimation or overestimation of the degree of tumor hypoxia (12). Multiparametric imaging presents an attractive opportunity for evaluating treatment response (13). Several studies have reported the added benefit of assessing both tumor perfusion and hypoxia in predicting response to therapy, suggesting that such metrics may have independent value for tumor characterization and treatment adaptation (14,15).
Simultaneous assessment of tumor perfusion and hypoxia can be achieved through kinetic modeling of dynamic 18F-FMISO PET scans and carries several benefits. First, uncoupling the contribution of hypoxia-mediated entrapment to the total 18F-FMISO signal results in a more accurate estimation of tumor hypoxia, since the variations in the 18F-FMISO distribution volume combined with structurally and functionally abnormal vasculature may lead to low uptake in hypoxic regions or high uptake in normoxic regions even at later times after injection (12,16). Second, assessment of tumor perfusion is clinically relevant, as it is an indirect measure of angiogenesis and the delivery of nutrients and systemic agents to the tumor and may help in elucidating response mechanisms to both systemic and targeted treatments (17). Since 18F-FMISO passively diffuses out of the vasculature and through cell membranes because of its lipophilicity, early 18F-FMISO uptake correlates with tumor perfusion as measured with the reference standard, 15O-H2O PET (18). We hypothesized that kinetic modeling of dynamic 18F-FMISO PET clarifies the ambiguity in interpreting static 18F-FMISO uptake after angiogenic therapy by decoupling the contributions of hypoxia-mediated entrapment and 18F-FMISO distribution volume to total signal.
MATERIALS AND METHODS
Animal Preparation, Imaging, and Treatment
All animal experiments and procedures were approved by our Institutional Animal Care and Use Committee and complied with the National Institutes of Health regulations on the research use of rodents.
Tumor inoculation (19), 18F-FMISO production (20), and the dynamic PET imaging protocol (21) have been described previously. In brief, approximately 5.0 × 10⁶ HT29 human colorectal carcinoma cells (catalog no. HTB-38; American Type Culture Collection) were subcutaneously injected into the right hind limb of 6- to 8-wk-old female athymic nu/nu rats. Twenty-one animals bearing tumors between 200 and 1,500 mm3 were used in the study. The animals were anesthetized with 2% isoflurane in air, and a 90-min baseline dynamic PET acquisition (4 × 5-, 4 × 10-, 4 × 30-, 7 × 60-, 10 × 300-, and 3 × 600-s frames) was initiated simultaneously with the administration of 42.1 ± 3.9 MBq of 18F-FMISO via tail vein injection. Imaging studies were performed with either a microPET R4 or a microPET Focus-120 small-animal scanner (Siemens Medical Solutions Inc.).
Subsequently, the animals were randomly distributed into a vehicle-treated control group (0.5% methylcellulose daily for 2 d [5 rats] or 7 d [4 rats]) and a cediranib-treated group (3 mg/kg daily for 2 or 7 d; n = 6 in both groups) (Fig. 1). Cediranib and vehicle were administered by oral gavage (19). The bioactivity of the selected cediranib dosage was confirmed in our previous studies using the same tumor model (19). After the treatment period, 90-min follow-up dynamic PET scans were performed for all groups. All animals were administered pimonidazole hydrochloride (60 mg/kg; Natural Pharmacia International, Inc.) and Hoechst 33342 (2 mg in 100 μL of phosphate-buffered saline; Sigma Aldrich) via the tail vein at 90 and 5 min before sacrifice, respectively.
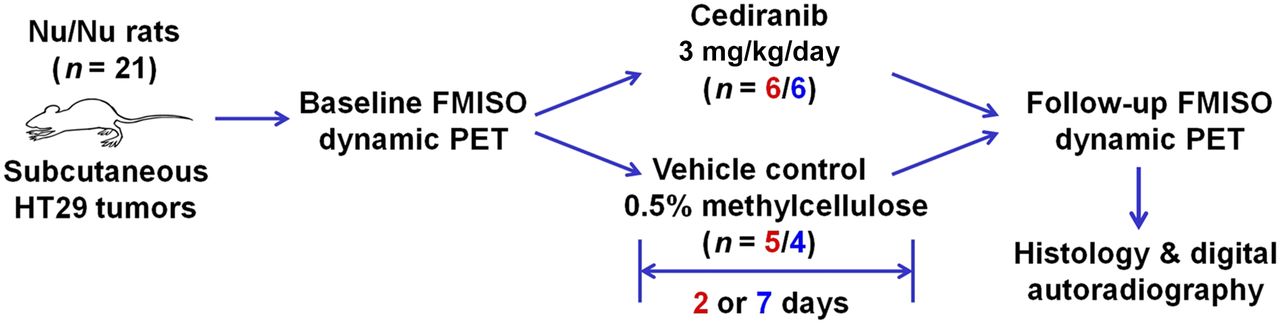
Experimental schematic. Animals bearing colorectal carcinoma xenografts were imaged with dynamic 18F-FMISO PET at baseline and subsequently randomized into cediranib and vehicle groups. After completion of treatment, second dynamic 18F-FMISO PET scan was obtained, followed by ex vivo analysis of tumor specimens.
Histology and Autoradiography
After posttreatment imaging, the animals were sacrificed and an angiocatheter placed in the tumor perpendicular to the coronal plane to preserve tumor orientation during sectioning. The tumors were excised and embedded in optimal-cutting-temperature mounting medium (Sakura Finetek) frozen on dry ice, and series of 10-μm frozen sections were immediately cut. To determine radiotracer distribution, digital autoradiography was performed by placing tissue sections in a film cassette against a phosphor imaging plate (Fujifilm BAS-MS2325; Fuji Photo Film) for 6 h at −20°C. Phosphor imaging plates were read at a pixel resolution of 50 μm with a BAS-1800II bioimaging analyzer (Fujifilm Medical Systems). After autoradiographic exposure, the same frozen sections were then used for fluorescence staining and microscopy.
Immunofluorescence staining for pimonidazole was performed as previously described (22) using a rabbit polyclonal antipimonidazole primary antibody (1:40 dilution, catalog no. 2627; Natural Pharmacia International, Inc.). Secondary detection was performed using goat antirabbit Alexa-488 (20 μg/mL; Invitrogen) in blocking buffer. Images were acquired at ×40 magnification using a BX60 fluorescence microscope (Olympus America, Inc.) equipped with a motorized stage (Prior Scientific Instruments Ltd.) and a CC12 camera (Olympus). Whole-tumor montage images were obtained by acquiring multiple fields at ×40 magnification, followed by alignment using MicroSuite Biological Suite (version 2.7; Olympus). Sequential tumor sections were stained with hematoxylin and eosin, and bright-field images were acquired in the same manner as above.
Kinetic Modeling
Voxelwise kinetic modeling of dynamic 18F-FMISO PET images was performed in PMOD (version 3.604; PMOD Technologies GmbH) using an irreversible 1-plasma 2-tissue compartmental model (21). The analysis was focused on the kinetic rate constants k3, a surrogate for hypoxia-mediated entrapment (12,16); K1, a surrogate for perfusion (18); and K1/k2, a surrogate for 18F-FMISO distribution volume. k4 was set to 0, reflecting irreversible trapping of 18F-FMISO (7). Assuming unit density tissue, k3 and K1 are expressed in min−1, whereas K1/k2 is unitless. The image-derived input function was obtained by segmenting the descending aorta in the initial 3 frames of the study (0–15 s). Image-derived input function time–activity curves were corrected for partial-volume effects and fitted with a 3-term exponential function, as described previously (21). Tumors were delineated manually on a slice-by-slice basis on the final frame (80–90 min), with tumor dimensions as measured with a caliper serving as a guideline. Tumor-to-blood ratio (TBR) was derived from the last time frame, using the measured activity concentration in the image-derived input function volume of interest as the reference for blood activity concentration. Since 18F-FMISO exhibits irreversible trapping, the standard Patlak formulation (23) can be used to express the TBR as Eq. 1where Cp(t) describes the 18F-FMISO activity concentration in plasma, and DV is the 18F-FMISO distribution volume, approximated by K1/k2. 18F-FMISO equilibration time, T*, after which unbound 18F-FMISO has reached more than 99% of its final ratio relative to blood, was calculated as
 Eq. 2Calculation of kinetic rate constants on a voxel level was performed using the 2-tissue compartmental model with ridge-regression fitting as implemented in the PXMOD tool of PMOD.
Statistical Analysis
Comparisons of investigated metrics between the vehicle- and cediranib-treated groups was performed with the unpaired 2-tailed Student t test, assuming a significance level of P < 0.05. The Pearson correlation coefficient, r, was used to calculate the correlation between the parameters of interest.
RESULTS
Mean animal weight and tumor volume (±SD) at baseline was 216 ± 20 g and 529 ± 345 mm3, respectively (n = 21). Tumor volume did not significantly change in any of the 4 groups (Table 1). Analysis of static PET images (a single frame acquired between 80 and 90 min after 18F-FMISO injection) revealed a significant reduction in SUVmean and SUVmax in both the 2-d and the 7-d cediranib groups relative to baseline measurements (Table 1). No significant difference was observed in either of the vehicle groups.
Tumor Volume, SUVmean, and SUVmax Before and After Treatment with Cediranib or Vehicle for 2 or 7 Days
Kinetic modeling of dynamic PET data revealed a more detailed picture of 18F-FMISO behavior. In the cediranib groups, significant reductions were observed in both K1 (from 0.13 to 0.07 min−1 for 2-d and from 0.24 to 0.08 min−1 for 7-d) and K1/k2 (from 1.12 to 0.71 for 2-d and from 1.21 to 0.91 for 7-d), whereas in the vehicle groups no significant differences in these parameters could be observed (Table 2). For k3, a significant increase was observed in the 2-d cediranib group (from 0.0009 to 0.0069 min−1). An increase in the k3 parameter in the 7-d cediranib group (from 0.0039 to 0.0050 min−1) was not significant, partially due to the wide spread of mean tumor k3 values on the baseline scan. The latter is exemplified on the box-and-whisker plots, shown in Figure 2 for all groups and for all investigated kinetic rate constants. Changes in TBR mirrored the SUV data, with significant reductions observed in the cediranib groups (17% and 24% for 2- and 7-d, respectively) but not in the vehicle groups. 18F-FMISO equilibration time was found to be less than 90 min in all groups, confirming the sufficiency of the acquisition duration.
18F-FMISO Kinetic Modeling Before and After Treatment with Cediranib or Vehicle for 2 or 7 Days
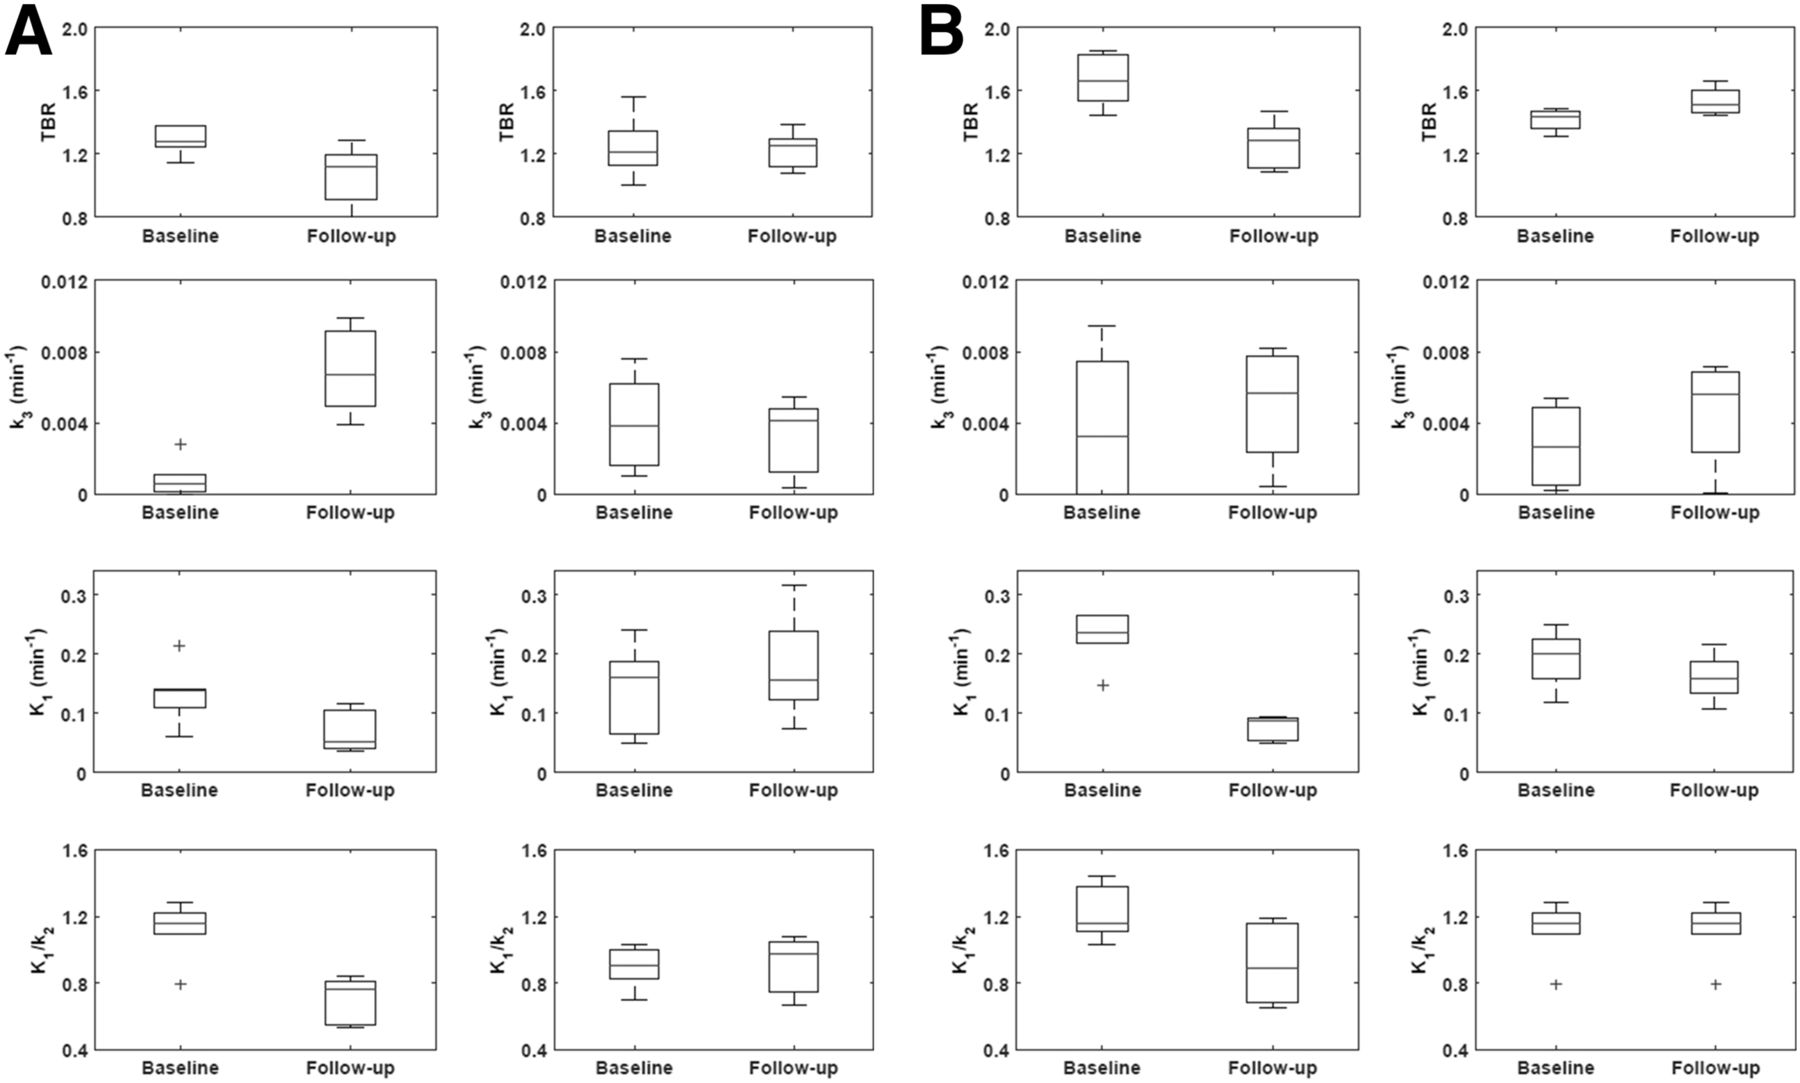
(A) Box-and-whisker plots summarizing mean intratumor values of TBR, k3, K1, and K1/k2 for animals treated 2 d with cediranib (left panels) or 2 d with vehicle (right panels). (B) Corresponding plots for animals treated for 7 d with cediranib (left panels) or 7 d with vehicle (right panels).
Representative parametric maps of TBR, k3, K1, and K1/k2 at baseline and follow-up for a cediranib-treated animal are shown in Figure 3. Although mean intratumor TBR dropped from 1.44 at baseline to 1.29 after treatment, mean intratumor k3 (calculated by averaging the voxelwise k3 values) increased from 0.0022 to 0.0069 min−1, indicating an actual increase in hypoxia-mediated entrapment of 18F-FMISO. The decrease in TBR can be explained by both decreased perfusion due to pruning of intratumor vessels (mean intratumor K1 dropped from 0.15 to 0.08 min−1) and decreased 18F-FMISO distribution volume (mean intratumor K1/k2 dropped from 1.16 to 0.86).
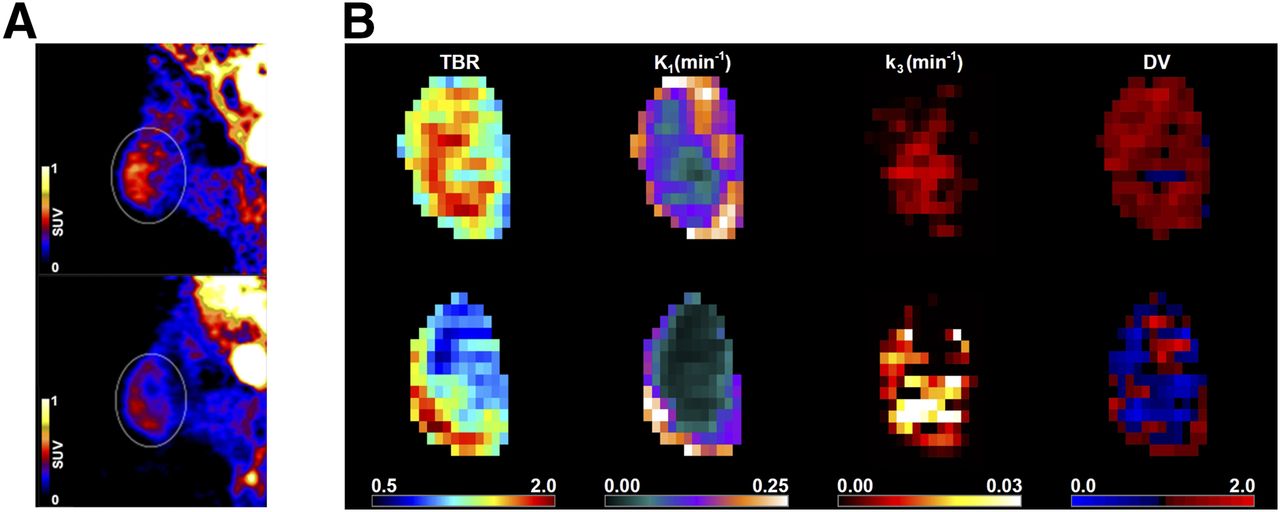
(A) Single-slice, midtumor PET images obtained 90 min after injection from representative animal in 7-d cediranib group at baseline (left) and after treatment (right). (B) Intratumor voxelwise maps (coronal view) derived from dynamic PET images of same animal at baseline (top row) and after treatment (bottom row). DV = distribution volume.
The discordance between k3 and TBR as surrogate markers for tumor hypoxia is further highlighted in k3–TBR scatterplots for two animals, one from a cediranib group (7-d; Fig. 4A) and the other from a vehicle group (2-d; Fig. 4B). Although, in the vehicle animal, Pearson r between voxelwise values of k3 and TBR was high and remained relatively unchanged (decreasing from 0.85 to 0.73), the corresponding r in the cediranib animal decreased substantially from 0.65 at baseline to −0.45 after treatment. The decrease in TBR in the latter case was not due to a decrease in k3 or a long 18F-FMISO equilibration time but to a decrease in 18F-FMISO distribution volume. Results confirming the foregoing observations were observed when the k3–TBR correlation was calculated on a whole-tumor level (i.e., by taking mean voxelwise k3 and TBR for each animal). Pearson r changed from 0.63 to 0.51 in vehicle animals (to achieve higher statistics, the two vehicle groups were pooled into a single group), whereas for cediranib animals (pooled data including both the 2-d and the 7-d groups), it changed substantially, from 0.66 to −0.39.

(A) Correlation between k3 and TBR, two surrogate markers of tumor hypoxia, for representative animal in 7-d cediranib group. Pearson r between k3 and TBR changed substantially, from 0.65 on baseline scan (blue) to −0.45 at follow-up (red), whereas T* increased from 22 to 60 min, respectively. (B) Corresponding scatterplot for representative animal in 2-d vehicle group. Pearson r between k3 and TBR changed only slightly, from 0.85 on baseline scan (blue) to 0.73 at follow-up (red), whereas T* remained relatively unchanged (27 and 29 min, respectively).
Ex vivo analysis of tumor sections provided further detail on the distribution of 18F-FMISO in the cediranib and vehicle groups. Representative examples of coregistered images showing 18F-FMISO digital autoradiographs, immunofluorescence staining, and hematoxylin and eosin staining are shown for HT29 xenograft tumors excised from cediranib and vehicle animals (Fig. 5 and Supplemental Fig. 1; supplemental materials are available at http://jnm.snmjournals.org). The tumors were generally characterized by largely necrotic centers containing islands of viable cells (seen with hematoxylin and eosin staining), well-perfused rims (evidenced by Hoechst 33342 staining [blue]), and an extensive perinecrotic hypoxic region staining positively for the exogenous hypoxia tracer pimonidazole (green). In the tumors of the vehicle group, 18F-FMISO distribution closely corresponded to the spatial pattern of pimonidazole uptake. Islands of viable tumor extending to the boundary of the necrotic region were clearly visualized by pimonidazole immunofluorescence staining and by 18F-FMISO digital autoradiographs. Analysis of tumors from the cediranib groups revealed some notable differences from the vehicle-group tumors. There was a loss of correspondence between pimonidazole staining in some, generally centrally located, tumor regions, with these regions being characterized by strong pimonidazole staining but weak, or absence of, staining for Hoechst 33342. Also of note was an absence of 18F-FMISO uptake in these regions. In contrast, the peripheral regions of these tumors generally showed a strong correspondence between 18F-FMISO uptake and pimonidazole staining. The noncorrespondence of pimonidazole and 18F-FMISO in the cediranib groups is explained by the large difference in the concentrations administered (approximately 220 μM and 4.8 pM for pimonidazole and 18F-FMISO, respectively), greatly reducing the sensitivity of pimonidazole to changes in tracer delivery relative to 18F-FMISO.

Hematoxylin and eosin (H&E), digital autoradiography (DAR), and immunofluorescence (IF) (green = pimonidazole, blue = Hoechst 33342) analysis of ex vivo tumor sections. Upper and lower zoom regions are indicated on whole-mount hematoxylin and eosin images. (A) Tumors in the cediranib group showed viable central regions positive for pimonidazole but lacking 18F-FMISO uptake (black arrows). (B) Tumors in the vehicle group showed strong correspondence between pimonidazole staining and 18F-FMISO uptake in both central and peripheral regions.
DISCUSSION
This study was performed to explore the use of 18F-FMISO as an imaging biomarker for the acute effects of antiangiogenic therapies and to investigate which imaging metrics most accurately reflect the underlying changes in tumor physiology caused by these treatments. Sustained angiogenesis is one of the hallmarks of cancer, and the targeting and exploitation of tumor neovasculature provide an additional pharmaceutical option for disease management. However, many antiangiogenic drugs have a complex effect on tumor blood supply and oxygen delivery, with an acute reduction in tumor perfusion being followed by a longer process of vascular normalization (24). This initial effect may facilitate an acute hypoxic response, in turn fueling tumor progression (1), and may have important implications for the optimal scheduling of concurrent radiation therapy. Accurate characterization of tumor perfusion and hypoxia may therefore prove to be an important consideration for patient stratification before therapy and for modification of therapy after its onset.
18F-FMISO PET is the most extensively evaluated technique for noninvasive, quantitative imaging of tumor hypoxia (9). Bartlett et al., working with a prostate-tumor model, concluded that kinetic modeling of dynamic 18F-FMISO PET data provides additional information otherwise unavailable from static images and that the k3 parameter is better at identifying low tissue oxygen than are other measures of 18F-FMISO uptake (16). Recently, we demonstrated that kinetic modeling of dynamic 18F-FMISO PET data can clarify the ambiguity in interpreting static 18F-FMISO uptake in patients with head and neck cancer (12).
The presented findings support the conclusion of the foregoing study, indicating that kinetic modeling of dynamic 18F-FMISO PET data allows for a more detailed assessment of response to an antiangiogenic agent than can be achieved through a single static image. The observation of decreased total 18F-FMISO SUV relative to baseline (Table 1) implies a cediranib-mediated reduction in tumor hypoxia. However, kinetic analysis revealed that in at least a fraction of tumor voxels, the rate of hypoxia-specific entrapment of 18F-FMISO (k3) actually increases (Table 2; Fig. 2). We observed a large drug-dependent reduction in vascular delivery of 18F-FMISO (K1) that reflects similar reductions we and others have observed in delivery of gadolinium contrast agent as measured using dynamic MRI (25,26). We also observed reductions in 18F-FMISO distribution volume as shown by K1/k2, which may reflect the higher fraction of necrotic cells after treatment. Parametric mapping revealed heterogeneous responses to cediranib, with peripheral voxels showing a reduction in K1 and K1/k2, whereas voxels with a higher k3 tended to be seen in more centrally located tumor regions (Fig. 3).
Although, for the vehicle group, k3 and TBR were relatively well correlated, both on a voxel-by-voxel level and on a whole-tumor level, treatment with cediranib decreased the k3–TBR correlation substantially (Fig. 4). These results indicate that when antiangiogenic drugs are administered, static 18F-FMISO uptake metrics may not accurately reflect the underlying hypoxia status. TBR depends not only on k3 but also on K1/k2 (18F-FMISO distribution volume) and T* (18F-FMISO equilibration time). By pruning the tumor vessels and increasing the fraction of nonviable tumor cells (causing reduced K1/k2), 18F-FMISO may appear to decrease after antiangiogenic therapy despite constant or even increasing levels of tumor hypoxia, leading to an incorrect assessment of tumor response. Under normoxic conditions (k3 = 0), TBR will reflect the 18F-FMISO distribution volume (Eq. 1). Consequently, K1/k2 has a potential to bias the assessment of 18F-FMISO uptake if only static scans are used (12). For treated animals, K1/k2 was consistently lower than 1, resulting in lower TBRs that underestimate the degree of intratumor hypoxia. 18F-FMISO equilibration time was found to be less than 90 min in all groups; therefore, lower total 18F-FMISO uptake was not caused by tumor hypoperfusion.
The foregoing observations are supported by ex vivo digital autoradiography and immunofluorescence staining of tumor sections. In vehicle-treated animals, an inverse relationship with the vascular perfusion marker Hoechst 33342 was found for areas staining positively for pimonidazole. 18F-FMISO autoradiography exhibited a strong positive correspondence with pimonidazole uptake, as expected. In the cediranib-treated animals, many of the centrally located regions of viable tissue did not show a significant accumulation of 18F-FMISO, despite showing uptake of pimonidazole. 18F-FMISO signal was observed mainly in the tumor periphery, localized adjacent to regions of high Hoechst 33342 staining, without the clear correspondence with pimonidazole seen in tumors of the vehicle groups. These distributions imply that uptake of 18F-FMISO in the central tumor region is reduced—even though these regions remain hypoxic—and reflects the reduced K1 and elevated k3 parameters observed from kinetic modeling.
Although pimonidazole and 18F-FMISO were coadministered approximately 90 min before sacrifice, these similarly structured hypoxia tracers provided divergent information in the cediranib-treated groups. This divergence can be explained by the high molar concentration of pimonidazole administered (approximately 220 μM) and by the binary nature of the immunofluorescence-based detection of pimonidazole adducts. These factors render identification of hypoxic tumor regions based on pimonidazole much less sensitive to fluctuations in vascular tracer delivery than that based on 18F-FMISO, for which a much lower concentration is given (∼4.8 pM) and for which absolute uptake is measured. Although differences in the respective Po2 sensitivity of the hypoxia tracers, and the potential that a partial-volume effect will reduce apparent 18F-FMISO activity, are also possible explanations for this observation, neither of these effects was observed in the tumors of the vehicle groups, suggesting that the influence of these phenomena is likely small.
The results of this study go some way to explaining the divergent and occasionally confounding data on the effect that antiangiogenic agents have on tumor hypoxia and 18F-FMISO imaging response. There are multiple reports of observations that antiangiogenic agents can increase tumor hypoxia by promoting vessel pruning and inhibiting neoangiogenesis (27–29), often determined using immunohistochemistry markers of tumor hypoxia. In contrast, there are also several reports of a reduction in 18F-FMISO uptake after antiangiogenic treatment (30–34). Differences in antiangiogenic compounds, tumor types, and experimental methodologies make it difficult to draw a definitive conclusion. However, our data suggest that although metrics derived from static scans are attractive because of the simple acquisition protocols, 18F-FMISO uptake may not directly reflect changes in intratumor hypoxia unless radiotracer delivery and distribution are also accounted for. For this reason, we believe that the use of dynamic acquisition protocols should be considered when tumor perfusion and tracer distribution are directly affected by the treatment under evaluation. Clarifying the relative contributions of tracer distribution, tumor perfusion, and tumor hypoxia to total 18F-FMISO signal yields multiparametric imaging data that can better elucidate the acute response and mechanisms of resistance to antiangiogenic therapy and may better inform optimal drug dosing and treatment scheduling.
CONCLUSION
18F-FMISO kinetic modeling reveals a more detailed response to cediranib treatment than a single static image is able to reveal. Reduced mean K1 reflects a reduction in vascular perfusion, whereas increased k3 reflects a rise in hypoxia-mediated tracer entrapment. However, if only late static images from the same dataset are analyzed, the reduction in 18F-FMISO uptake after cediranib treatment may be mistakenly interpreted as a global decrease, rather than an increase, in tumor hypoxia. These findings support the use of 18F-FMISO kinetic modeling to more accurately characterize the response to treatments that have a direct effect on tumor vascularization and perfusion.
DISCLOSURE
Services provided by the Radiochemistry and Molecular Imaging Probes Core Facility of Memorial Sloan Kettering Cancer Center were supported in part by grant P30 CA008748 from the National Institutes of Health (principal investigator, Craig Thompson). Sean Carlin is also partially funded by a generous grant from the Mesothelioma Applied Research Foundation. Sally-Ann Emmas is an employee of AstraZeneca. No other potential conflict of interest relevant to this article was reported.
Footnotes
Published online Mar. 30, 2017.
- © 2017 by the Society of Nuclear Medicine and Molecular Imaging.
REFERENCES
- Received for publication January 30, 2017.
- Accepted for publication March 16, 2017.


