


Abstract
Delayed perfusion and enhanced hepatobiliary uptake are recognized findings on 99mTc-mercaptoacetyltriglycine (99mTc-MAG3) scintigraphy in patients with renal insufficiency. Less well appreciated is the finding of bone marrow visualization. This study was performed to determine the frequency of this sign and to try to determine its association with laboratory parameters. Methods: We retrospectively studied medical records and the results of renal scans performed on 170 patients from June to December 2009 at the Montefiore Medical Center. Among them we identified 167 patients who fulfilled our inclusion criteria for participation in this study. Prominent individual vertebrae and sacroiliac joints were categorized as bone marrow visualization. A lack of radiotracer activity in individual vertebrae or in the sacroiliac joints was categorized as bone marrow nonvisualization. The studies were interpreted by 2 nuclear medicine physicians who were unaware of the laboratory and clinical data. Results: The 167 patients fulfilling our inclusion criteria were divided into 2 groups: group 1 (n = 20), with visualization, and group 2 (n = 147), without visualization. The mean creatinine level in group 1 was higher than that in group 2 (3.2 vs. 1.1, P = 0.001). There was no difference in mean hematocrit and hemoglobin between the 2 groups. None of the patients with a creatinine level less than 1.5 mg/dL had bone marrow visualization, whereas bone marrow was visualized in 44% of patients with a creatinine level greater than 1.5 mg/dL. There was no definite correlation between the intensity of marrow activity and the level of creatinine. Conclusion: Bone marrow often may be visualized on early images of 99mTc-MAG3 renal scans of azotemic patients. The etiology needs further clarification. Enhanced marrow perfusion, an increased blood concentration of 99mTc-MAG3, and marrow hyperplasia secondary to associated anemia or hemolysis are possible causes.
Renal scintigraphy using 99mTc-mercaptoacetyltriglycine (99mTc-MAG3) is one established diagnostic modality for the evaluation of renal function. Under certain conditions, several extrarenal abnormalities may be within the camera field of view and appear on the images. Such serendipitous findings may constitute useful diagnostic information (1). Poor perfusion and enhanced hepatobiliary uptake are well-known findings on 99mTc-MAG3 scintigraphy of patients with renal insufficiency (2). However, there are few reports concerning bone marrow visualization (3,4). Over our many years of performing 99mTc-MAG3 studies, we have observed bone marrow visualization in patients with renal insufficiency. To study this observation further and determine its frequency in patients who underwent 99mTc-MAG3 renal scintigraphy, we undertook this retrospective study. Correlation with laboratory parameters was obtained.
MATERIALS AND METHODS
We retrospectively studied medical records and the results of renal scanning performed on 170 patients from June to December 2009 at the Montefiore Medical Center. Among them, we identified 167 patients who fulfilled our inclusion criteria for participation in this study: the availability of hematocrit, hemoglobin, and creatinine results within 6 mo of the renal scan (36 ± 52 d for hemoglobin and hematocrit and 35 ± 49 d for creatinine) and the listing of current and previous medications in the medical charts. Patients excluded from our study were those with a kidney transplant and those taking captopril or undergoing captopril renal scintigraphy. The study design was approved by the Montefiore Medical Center Ethics Committee and the Montefiore Institutional Review Board.
All patients had undergone our standard renal scintigraphy protocol, which obtains 2- to 3-min serial images after a 740-MBq (2-mCi) intravenous injection of 99mTc-MAG3. The identification of individual vertebrae or the sacroiliac joints was categorized as bone marrow visualization. A lack of radiotracer activity in individual vertebrae or in the sacroiliac joints was categorized as bone marrow nonvisualization. We recorded the patients’ characteristics, such as whether marrow activity was present and, if so, its intensity, as well as the levels of creatinine, hematocrit, and hemoglobin. We used regression analysis and the t test, with a probability value of less than 0.05 considered statistically significant. Two nuclear physicians without knowledge of the blood test results independently interpreted the studies as showing visualization or nonvisualization of bone marrow. There were no disagreements about the presence or absence of bone marrow visualization. The visual degree of bone marrow uptake was subjectively graded by both physicians jointly as mild, moderate, or severe without using any specific criteria. They concurred on all occasions.
RESULTS
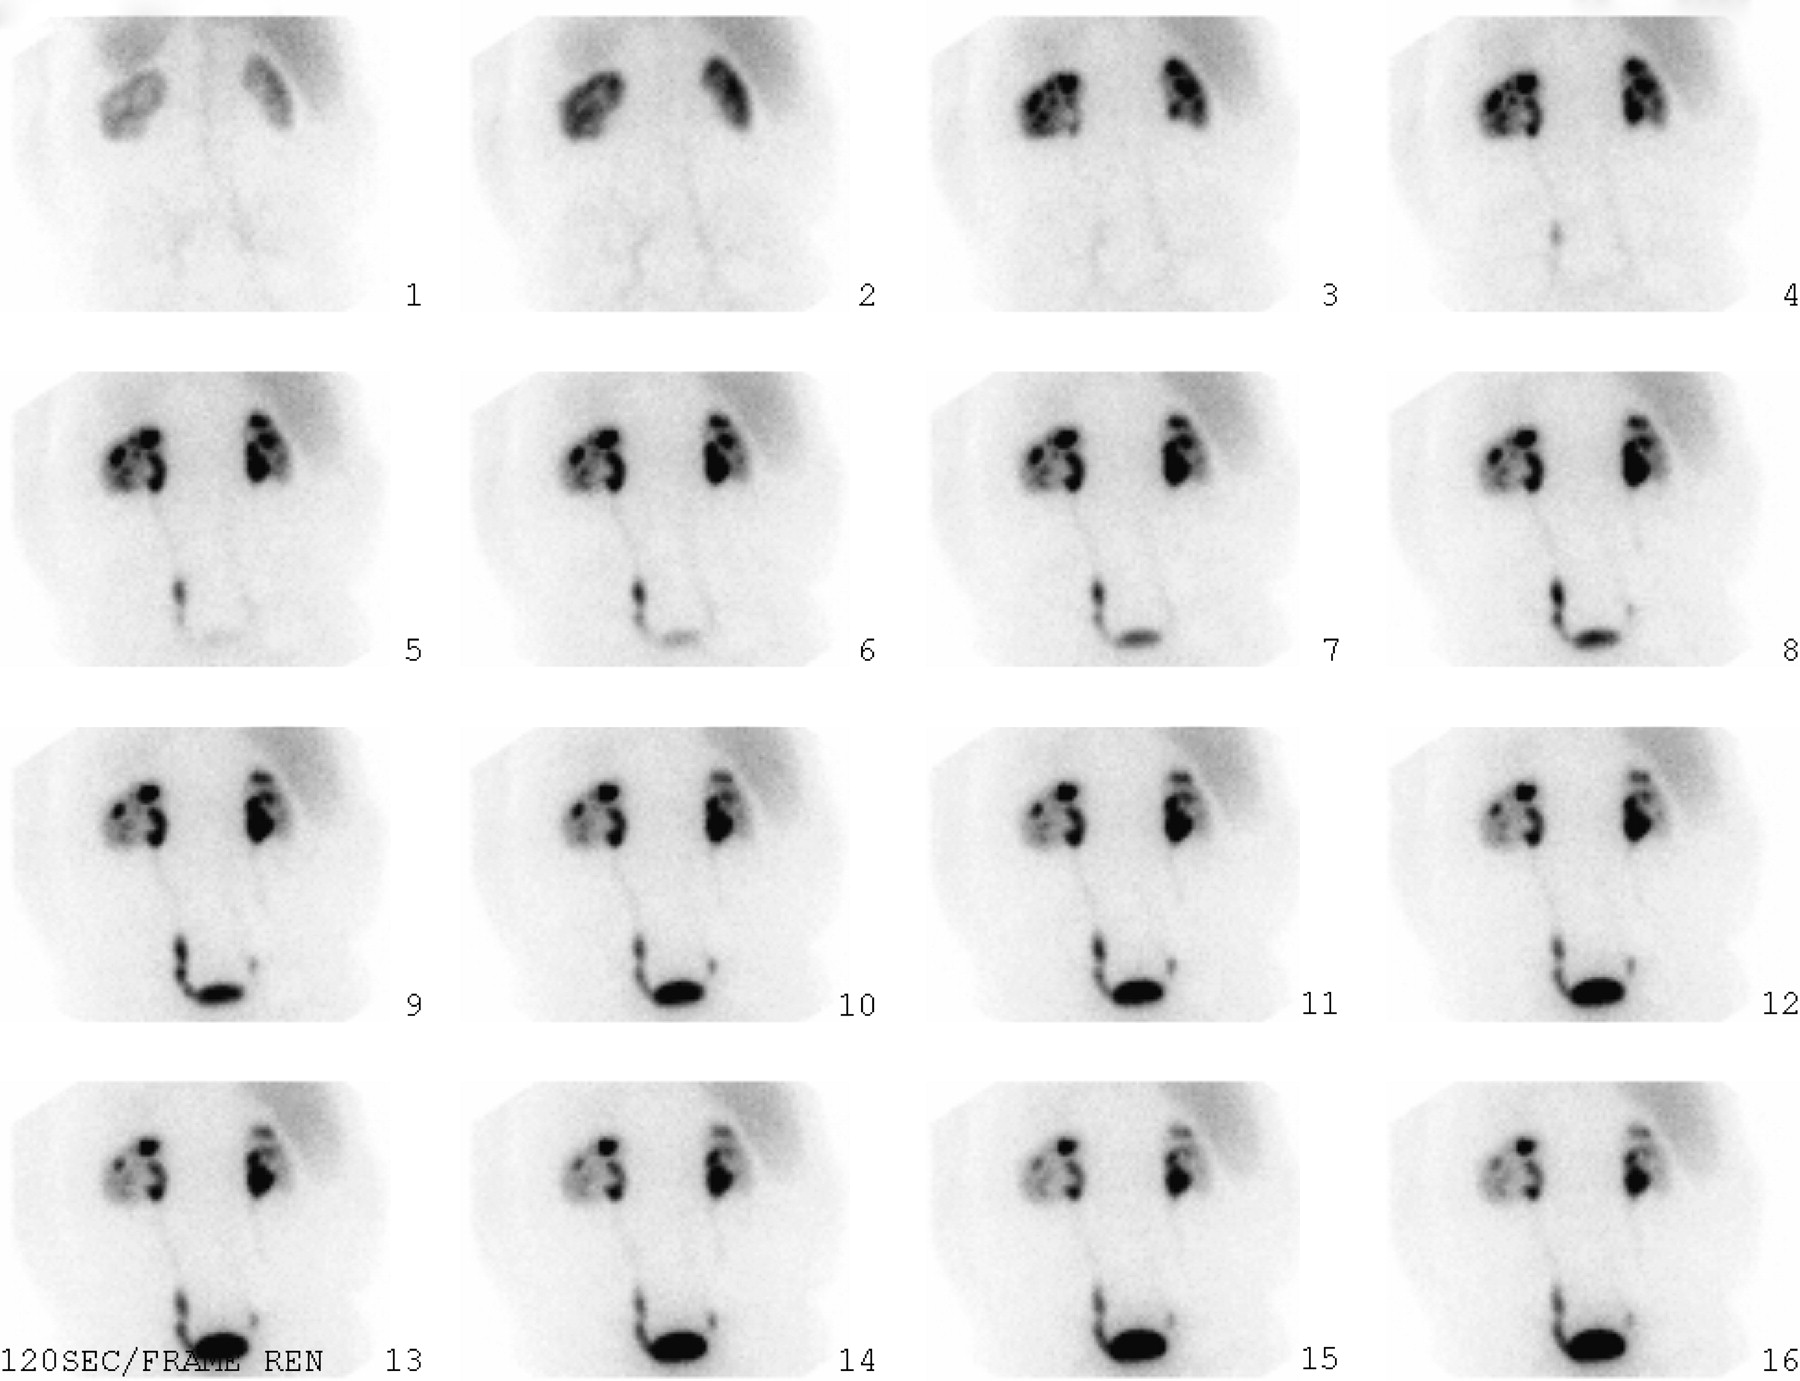
Marrow activity was usually identified on the initial 0- to 2-min or 0- to 3-min images and receded thereafter. According to the presence or absence of bone marrow visualization, the 167 patients were divided into 2 groups: group 1 (n = 20), with visualization (Fig. 1), and group 2 (n = 147), without visualization (Fig. 2).

A 69-y-old man with increasing creatinine after heart transplantation (hemoglobin, 7.9 g/dL; hematocrit, 24.2%; creatinine, 2.2 mg/dL). Bone marrow is visualized on renal scan.
A 73 y-old-man with renal cell carcinoma after left partial nephrectomy (hemoglobin,10.9 g/dL; hematocrit, 32.9%; creatinine, 1.7 mg/dL). Bone marrow is not visualized on renal scan.
In group 1, mean creatinine was 3.2 ± 1.5 mg/dL, mean hematocrit was 34% ± 6.7%, and mean hemoglobin was 11.1 ± 2.3 g/dL. In group 2, mean creatinine was 1.1 ± 0.3 mg/dL, mean hematocrit was 36.5% ± 4.7%, and mean hemoglobin was 12 ± 2.0 g/dL. The biochemical parameters of group 1 were compared with those of group 2. There was no significant difference in mean hematocrit (34% vs. 36.5%) or mean hemoglobin (11.1 g/dL vs. 12 g/dL) (P = 0.9). On the other hand, mean creatinine was higher in group 1 than in group 2 (3.2 mg/dL vs. 1.1 mg/dL, P = 0.001). The biochemical parameters of the 2 groups are depicted in Table 1.
Comparison of Biochemical Parameters of the 2 Groups of Patients
Among the study participants, 45 had a creatinine level higher than 1.5 mg/dL, with 26 being higher than 2 mg/dL, whereas the rest had a creatinine level less than 1.5 mg/dL. None of the patients with a creatinine level less than 1.5 mg/dL had bone marrow visualization, whereas bone marrow was visualized in 20 (44%) of 45 patients with a creatinine level higher than 1.5 mg/dL.
Even though marrow activity was seen on renal scans only for patients with elevated creatinine, there was no definite correlation between the intensity of marrow activity and the level of creatinine. Among azotemic patients with bone marrow visualization (n = 20), 8 had intense uptake whereas 12 had mild or moderate uptake (mean creatinine, 2.99 ± 1.8 mg/dL vs. 3.29 ± 1.7 mg/dL, P = 0.5). Only 1 patient with marrow uptake was receiving erythropoietin, and 2 were on dialysis at the time of the study.
DISCUSSION
99mTc-MAG3 was introduced more then a decade ago as a new radiopharmaceutical for renal function studies. Renal insufficiency is scintigraphically associated with delayed visualization of perfusion on early flow images, as well as enhanced hepatic activity on sequential images obtained during the first 30 min and, generally, on delayed studies. During the past several years, we have additionally observed, on early images obtained during the first 3 min, enhanced bone marrow activity that subsequently disappears. This retrospective study was undertaken to evaluate this observation.
The etiology of bone marrow visualization in azotemic patients needs further clarification. Enhanced perfusion to the marrow, skeleton, or both; an increased blood concentration of 99mTc-MAG3; and bone marrow hyperplasia secondary to associated anemia with hemolysis and peripheral red bone marrow expansion are possible causes. Because we found no difference in hematocrit or hemoglobin in the present study, the direct marrow-related causes appear less likely. However, erythropoietin levels were not available. This measurement might show a difference that would implicate the stimulated marrow.
Increased blood flow to either bone marrow, skeleton, or both compartments, which could lead to the visualization of vertebral and pelvic blood-pool activity on renal flow studies, has been described in a paper that included 3 patients with underlying neoplasms involving bone (5). Because most patients described in that paper and other reports have had abnormalities in both cortical bone and marrow, uncertainty existed as to whether the enhanced skeletal visualization was secondary to increased blood flow to the bony skeleton or to the marrow compartment. In a similar group of patients with severe underlying neoplasms, Klein et al. postulated that the increased osseous visualization could be secondary to a reactive hyperemic response of marrow after chemotherapy (6).
Peripheral bone marrow expansion often is associated with myelofibrosis, which in turn can occur as a secondary process induced by several neoplasms, toxic exposure, and systemic disease, including renal osteodystrophy. The pathogenesis of bone marrow fibrosis in renal osteodystrophy is unknown. Fibroblasts may be stimulated by some factors, such as elevated parathyroid hormone or chemoattractants originating from osteoclasts or osteoblasts. The results of some studies suggest that marrow fibrosis in renal osteodystrophy is associated with increased osteoblastic activity (7). The resulting peripheral extension and central fibrosis of bone marrow can be one of the possible causes of radiopharmaceutical trapping and, therefore, bone marrow visualization on renal scans of azotemic patients.
Another possible explanation of bone marrow visualization is stimulation of bone marrow due to hemolysis of red blood cells, as occurs in uremia and azotemia. In chronic renal insufficiency, red blood cell survival is decreased because of some degree of hemolysis, which is present because of the accumulation of metabolic end products. Despite a decrease in erythropoietin level, bone marrow is usually normocellular. In occasional cases, there is red blood cell hypoplasia. Reticulocyte counts usually are normal or occasionally may be slightly elevated.
A final possible explanation for these findings is an increase in the blood concentration of 99mTc-MAG3 due to a decrease in its renal excretion by the poorly functioning kidney. It is possible that marrow visualization with 99mTc-MAG3 is not seen because the amount of activity under normal circumstances is below the threshold for visualization. As the blood level of the radiotracer rises, its absolute count in the bone marrow may reach the level at which it can be identified in these studies. Recognition of this marrow activity as a finding associated with azotemia should further enhance interpretation of renal scintigraphic studies.
CONCLUSION
Bone marrow often may be visualized on early images of 99mTc-MAG3 renal scans of azotemic patients. The etiology needs further clarification. Enhanced marrow perfusion, an increased blood concentration of 99mTc-MAG3, and marrow hyperplasia secondary to associated anemia or hemolysis are possible causes.
DISCLOSURE STATEMENT
The costs of publication of this article were defrayed in part by the payment of page charges. Therefore, and solely to indicate this fact, this article is hereby marked “advertisement” in accordance with 18 USC section 1734.
- © 2011 by Society of Nuclear Medicine
REFERENCES
- Received for publication November 24, 2010.
- Accepted for publication March 16, 2011.


Jump to section
Related Articles
Cited By...
- No citing articles found.