


Article Figures & Data
Figures
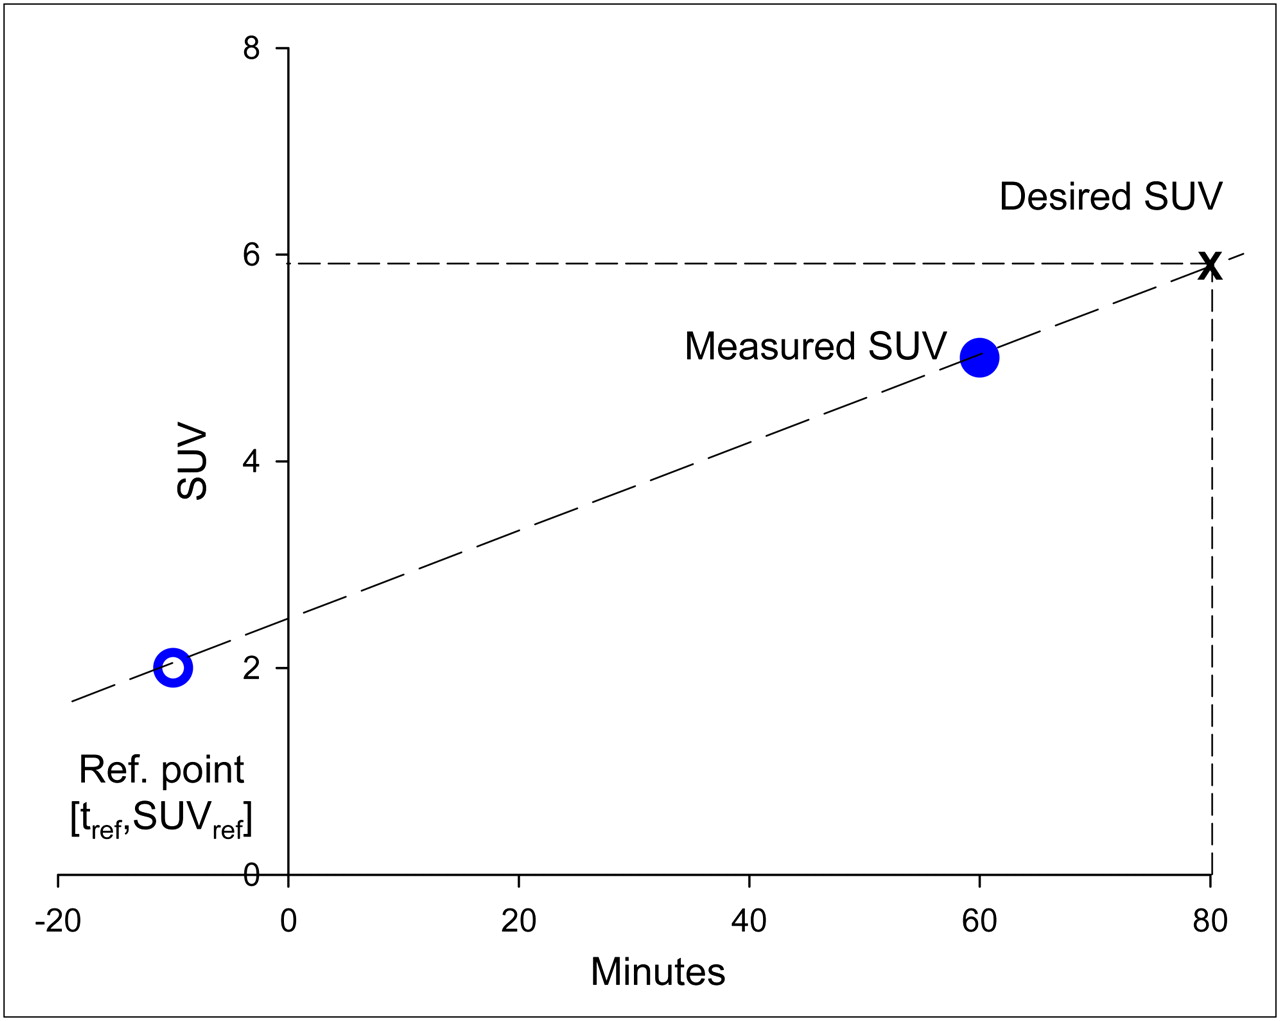
- FIGURE 1.
Illustration of reference point method for time corrections of tumor SUVs. Connect reference point (open circle with coordinates tref and SUVref) and measured SUV (filled circle) with a line. The line represents any desired SUV at a certain time point (e.g., at the cross hair).
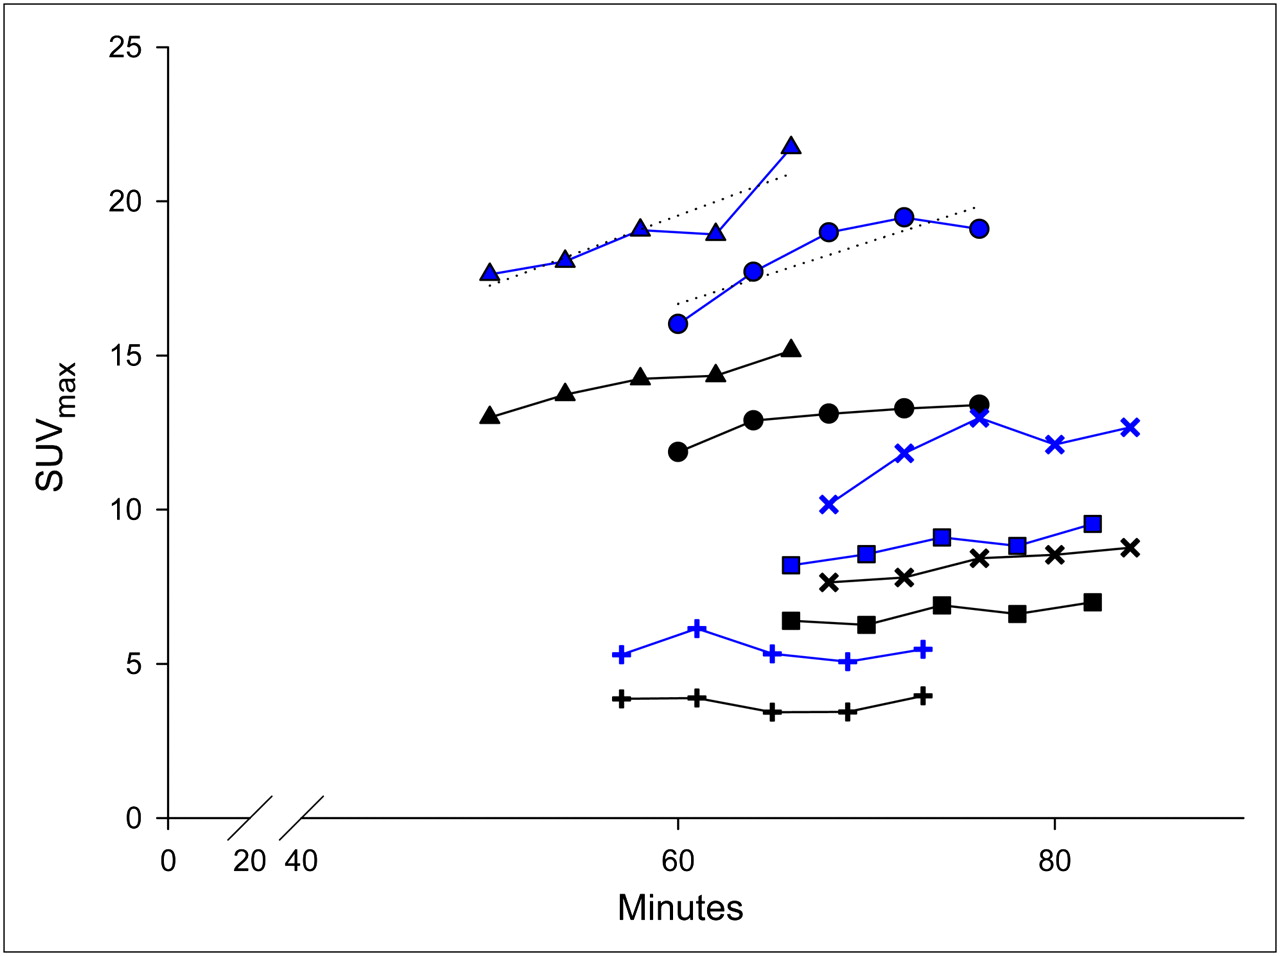
- FIGURE 2.
Maximum SUVs obtained from individual breast carcinomas over time. Two curves (same symbols) are denoted for each carcinoma, with upper curve representing high-definition reconstruction and lower curve representing attenuation-weighted OSEM. To allow for further calculation, regression lines were determined for each curve; examples are shown for the top 2 curves in the figure.
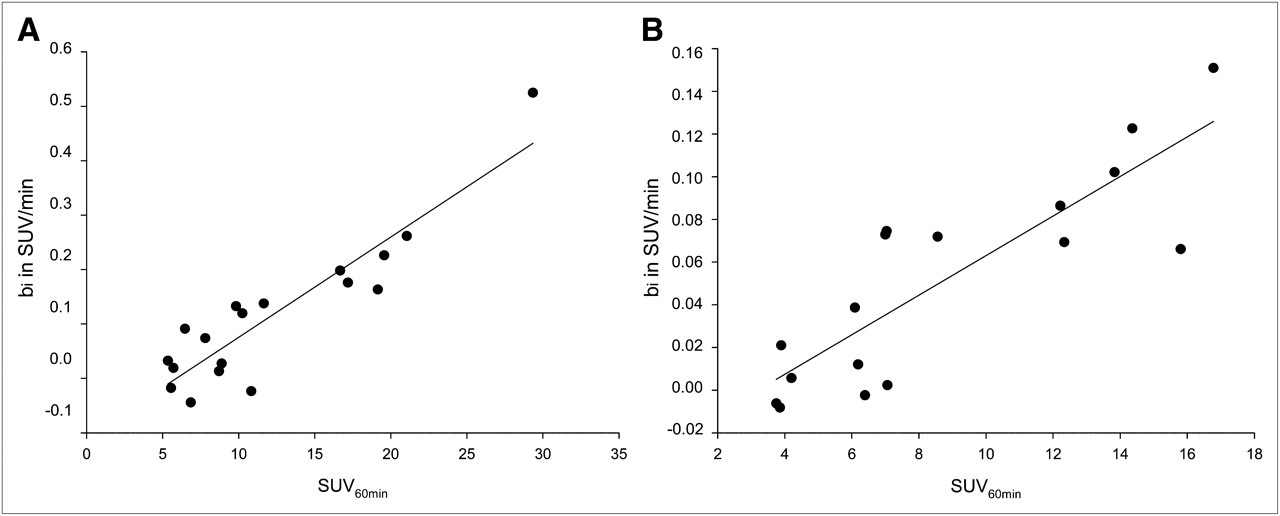
- FIGURE 3.
High-definition reconstruction (A) and attenuation-weighted OSEM (B). Shown are secondary linear relationship between SUVs at fixed time points (SUV at 60 min) and corresponding rates of change in SUV (slope bi). Resulting correlation had regression coefficients of R2 = 0.83 and R2 = 0.72, respectively.
- FIGURE 4.
High-definition reconstruction (A) and attenuation-weighted OSEM (B). Percentage error (absolute values) is plotted against maximum SUV when no correction for time differences in maximum SUV was applied (•; latest vs. earliest time point and vice versa) and when time corrections according to reference point method were applied (○). Percentage errors for both methods were fitted with linear function and peak function type Weibull, respectively. Above maximum SUV of approximately 8 and 6 for high-definition reconstruction and attenuation-weighted OSEM, respectively, reference point method had clear advantage over no correction.

Tables
Reference point High-definition Attenuation-weighted OSEM High-definition − background Attenuation-weighted OSEM − background Beaulieu (8) tref (min) ± SEM 5.8 ± 6.4 −48 ± 17 11 ± 5 −42 ± 22 −14 SUVref ± SEM 5.9 ± 1.7 3.2 ± 1.6 2.9 ± 1.2 0.67 ± 1.2 3.5 Reference points as necessary for reference point method. Time coordinate and SUV coordinate vary with different parameters for image reconstruction and methods of SUV calculation.
High-definition Attenuation-weighted OSEM Time Reference point method No correction Reference point method No correction ∼60 to 80 min 1.2% −9.2 1.8% −6.0% ∼80 to 60 min −0.3% 11.2% −0.9% 7.7% Overall |%error| 7.7% (10.8%*) 12.7% 4.5% (7.7%*) 7.3% Percentage errors when using reference point method vs. no time correction. All differences were statistically significant at P ≤ 0.01 (Wilcoxon signed rank test).
↵* Outer borders of 90% confidence interval for |%error| regarding uncertainty of coordinates of reference point. This border and associated |%errors| were determined using tref ± 2 SEMs and SUVref ± 2 SEMs instead of tref and SUVref for time corrections (Table 1 presents the SEMs).
Supplemental Data
Files in this Data Supplement:


Jump to section
Related Articles
Cited By...
- No citing articles found.