


Abstract
Gene therapy trials have traditionally used tumor and tissue biopsies for assessing the efficacy of gene transfer. Noninvasive imaging techniques offer a distinct advantage over tissue biopsies in that the magnitude and duration of gene transfer can be monitored repeatedly. Human somatostatin receptor subtype 2 (SSTR2) has been used for the nuclear imaging of gene transfer. To extend this concept, we have developed a somatostatin receptor–enhanced green fluorescent protein fusion construct (SSTR2-EGFP) for nuclear and fluorescent multimodality imaging. Methods: An adenovirus containing SSTR2-EGFP (AdSSTR2-EGFP) was constructed and evaluated in vitro and in vivo. SCC-9 human squamous cell carcinoma cells were infected with AdEGFP, AdSSTR2, or AdSSTR2-EGFP for in vitro evaluation by saturation binding, internalization, and fluorescence spectroscopy assays. In vivo biodistribution and nano-SPECT imaging studies were conducted with mice bearing SCC-9 tumor xenografts directly injected with AdSSTR2-EGFP or AdSSTR2 to determine the tumor localization of 111In-diethylenetriaminepentaacetic acid (DTPA)-Tyr3-octreotate. Fluorescence imaging was conducted in vivo with mice receiving intratumoral injections of AdSSTR2, AdSSTR2-EGFP, or AdEGFP as well as ex vivo with tissues extracted from mice. Results: The similarity between AdSSTR2-EGFP and wild-type AdSSTR2 was demonstrated in vitro by the saturation binding and internalization assays, and the fluorescence emission spectra of cells infected with AdSSTR2-EGFP was almost identical to the spectra of cells infected with wild-type AdEGFP. Biodistribution studies demonstrated that the tumor uptake of 111In-DTPA-Tyr3-octreotate was not significantly different (P > 0.05) when tumors (n = 5) were injected with AdSSTR2 or AdSSTR2-EGFP but was significantly greater than the uptake in control tumors. Fluorescence was observed in tumors injected with AdSSTR2-EGFP and AdEGFP in vivo and ex vivo but not in tumors injected with AdSSTR2. Although fluorescence was observed, there were discrepancies between in vivo imaging and ex vivo imaging as well as between nuclear imaging and fluorescent imaging. Conclusion: These studies showed that the SSTR2-EGFP fusion construct can be used for in vivo nuclear and optical imaging of gene transfer.
In the past 2 decades, gene therapy has been developed as a promising approach to combat a variety of diseases; more than 1,200 clinical gene therapy trials have been initiated (see The Journal of Gene Medicine clinical trial Web site [www.wiley.co.uk/genetherapy/clinical]). However, the successful implementation of current therapies in clinics and the development of novel therapeutics have been hindered by the inability to determine the efficiency of gene transfer. Tissue biopsies, which have been traditionally used to evaluate gene transfer, involve tissue destruction and yield information pertaining to only a small sample of tissue at a given time point. Molecular imaging has emerged as a powerful way to address these deficiencies through its ability to repeatedly and noninvasively determine the location, magnitude, and duration of transgene expression in a living subject (1,2).
Many groups have studied various reporter platforms to establish molecular imaging as a viable diagnostic technique for use with nuclear imaging, optical imaging, and MRI (1,2). Of note, nuclear imaging has received much attention because it introduces tracer amounts of radioactivity, is highly quantitative and sensitive, and is directly applicable to clinical trials. Herpes simplex virus 1 thymidine kinase (HSV1-TK) and its mutants have been studied extensively and used for PET and SPECT with various radiolabeled substrates (3,4). The sodium iodide symporter and the type 2 dopamine receptor have also been developed for nuclear imaging with radioiodide and radiolabeled dopamine analogs, respectively (5–7). Our group and others have focused on using human somatostatin receptor subtype 2 (SSTR2) for SPECT and PET of gene transfer (8–10).
In recent years, some groups have begun to examine the coupling of nuclear reporter genes to optical reporters, enabling multiple-modality imaging (5,11–13). Optical reporters include those with intrinsic fluorescence, such as green fluorescent protein (GFP) and other color variants, as well as bioluminescent reporters, such as luciferase, which require an enzymatic reaction to produce a signal. The aforementioned HSV1-TK has been coupled to a fluorescent protein and to luciferase in separate studies, and these constructs have been shown to retain the activities of their individual components (12,13). An adenovirus vector encoding both SSTR2 and GFP under the control of separate promoters has been evaluated in the context of mice bearing intraperitoneal ovarian tumor xenografts (14,15). A rationale for combining reporter genes of different modalities is to highlight the inherent advantages of one modality to compensate for the limitations of another. Despite the fact that nuclear imaging has the advantages of being highly sensitive and quantitative, it is expensive and does not have the resolution for single-cell imaging. On the other hand, although the sensitivity of optical probes decreases with the depth of tissue, optical imaging is cost-effective, is sensitive for surface detection, and can be used for single-cell imaging (16). Therefore, these optical and nuclear imaging reporters can complement each other in the imaging of preclinical tumor models, immune cell trafficking, or gene therapy (13).
In this study, we constructed and evaluated an adenovirus containing an SSTR2–enhanced GFP (EGFP) fusion gene (SSTR2-EGFP). This construct, AdSSTR2-EGFP, was compared with AdEGFP in vitro in a fluorescence spectroscopy assay and with AdSSTR2 in vitro in binding and internalization assays with 111In-diethylenetriaminepentaacetic acid (DTPA)-Tyr3-octreotate (111In-DTPA-Y3-octreotate). The viruses were subsequently compared in vivo in biodistribution, optical imaging, and nano-SPECT imaging studies.
MATERIALS AND METHODS
Cell Lines
Human oral squamous cell carcinoma cell line SCC-9 and human transformed primary embryonal kidney cell line AD-293 were obtained from the American Type Culture Collection and cultured at 37°C in a humidified atmosphere with 5% CO2. SCC-9 cells were maintained in 45% Ham F12 medium, 45% Dulbecco minimal essential medium, 10% heat-inactivated fetal bovine serum, and hydrocortisone (0.4 μg/mL). AD-293 cells were maintained in Eagle minimal essential medium containing 10% fetal bovine serum and 1% l-glutamine.
Construction of AdSSTR2-EGFP
The previously described (17) hemagglutinin A–tagged SSTR2 gene was obtained via a polymerase chain reaction (PCR) that included a 5′ BglII site and a 3′ linker sequence (ATCAGCGGAGCTAATGGCGTC). The EGFP gene was obtained from the mNLS-TK-EGFP plasmid (kindly provided by Dr. David Piwnica-Worms) (18) via a separate PCR that included a 5′ complementary linker sequence and a 3′ NotI site. The PCR products were purified and used as templates for a third PCR that produced the SSTR2-EGFP fusion fragment. SSTR2-EGFP was cloned by use of BglII and NotI into the pShuttle-CMV plasmid to produce pShuttle-CMV-SSTR2-EGFP. A recombinant adenovirus plasmid for the SSTR2-EGFP construct was generated by use of the AdEasy system (Stratagene). Purified recombinant pAdSSTR2-EGFP was transfected into AD-293 cells for the production of crude adenovirus, which was then used for the production of purified AdSSTR2-EGFP by Qbiogene. AdSSTR2 and AdGRPR (encoding the gastrin-releasing peptide receptor [GRPR]) were constructed as previously described (17,19) and served as controls. AdEGFP was purchased from Eton Bioscience. The viral titers for AdSSTR2-EGFP, AdSSTR2, AdGRPR, and AdEGFP were 3.6 × 10¹¹, 3.3 × 10¹¹, 4.2 × 10¹⁰, and 4.0 × 10¹⁰ plaque-forming units (PFU)/mL, respectively.
Radiolabeling and Saturation Binding Assay
DTPA-Y3-octreotate (1 μg) was labeled with 111InCl3 (25.9 MBq, 100 mM ammonium acetate, pH 5.5, 20 min, ambient temperature). Labeling efficiency was confirmed by radio–reversed-phase high-performance liquid chromatography (Vydac C18; 4.6 × 150 mm; mobile phase A, water and 0.1% trifluoroacetic acid; mobile phase B, acetonitrile and 0.1% trifluoroacetic acid; linear gradient of 5%–75% B; 8 min). SCC-9 cells were infected for 2 h with either AdSSTR2 or AdSSTR2-EGFP at 100 PFU per cell. Forty-eight hours later, the cells were harvested for membrane preparations, and a saturation binding assay was performed as previously described (9). Specific binding (fmol/mg of protein) was plotted against 111In-DTPA-Y3-octreotate (nM), and the data were fit by nonlinear regression to determine the dissociation constant (Kd) and the maximum number of binding sites (Bmax) (Prism 4.0 software; GraphPad). The Kd and Bmax values were expressed as the mean ± SEM of 3 separate experiments each performed in triplicate.
Fluorescence Spectroscopy Assay
Cells were infected with AdSSTR2, AdSSTR2-EGFP, or AdEGFP as described earlier, harvested 48 h later, resuspended in phosphate-buffered saline, and placed in a plastic cuvette. Fluorescence lifetime was measured by use of a Fluorolog III (Horiba) fluorimeter and a time-correlated single-photon counting technique with excitation at 460 nm and an impulse repetition rate of 1 MHz at 90° to an R928P detector (Hamamatsu). The detector was set to 550 nm, and the first detected photon represented the start signal of the time-to-amplitude converter; the excitation pulse triggered the stop signal. The lifetime was recorded on a 50-ns scale, and 5,000 photons were collected. DAS6 v6.1 decay analysis software (Horiba) was used for lifetime calculations. The goodness of fit was judged with χ2 values.
Internalization Assay
The internalization assay was performed as previously described with SCC-9 cells infected for 2 h with either AdSSTR2 or AdSSTR2-EGFP at 100 PFU per cell (9). 111In-DTPA-Y3-octreotate was added to each well such that the final concentration was approximately 1.5 nM in the presence or absence of an excess of Y3-octreotate (1 μM). At each time point, the cells were rinsed, acid washed, and harvested with the acid washes, and counts were obtained with a γ-counter. The data are presented as femtomoles of internalized radioactivity normalized to the amount of protein for 3 separate experiments each performed in triplicate. Maximum internalization was determined from nonlinear curve fitting for the specific internalized 111In-DTPA-Y3-octreotate versus time by use of GraphPad Prism 4.0 software and the one-site binding hyperbola equation provided. The initial velocities at this concentration of the radioligand were determined by linear regression of the data from 0 to 60 min.
Biodistribution
All animal studies were performed in accordance with the guidelines for the care and use of research animals of the Washington University Animal Studies Committee. Female 4-wk-old CB17-SCID mice (Charles River) were implanted subcutaneously in the rear flank with 107 SCC-9 cells, which were mixed 1:1 with Matrigel Basement Membrane Matrix (Becton Dickinson), in a volume of 200 μL. The tumors were allowed to grow for 25 d (size, 345 ± 16 mg). Next, the mice were anesthetized, and the tumors were injected with AdGRPR (2 × 10⁹ PFU per tumor in a volume of 50 μL) or with AdSSTR2 or AdSSTR2-EGFP (each at 3 × 10⁹ PFU per tumor in a volume of 30 μL). Two days after virus administration, the animals (n = 5 per group) were injected intravenously with 74–111 kBq of 111In-DTPA-Y3-octreotate in a volume of 100 μL. The animals were sacrificed 4, 24, or 48 h after injection; blood, liver, spleen, kidney, muscle, bone (cortex and marrow), pancreas, and tumor were extracted; and counts were obtained with a γ-counter. The percentage injected dose per gram (%ID/g) was calculated on the basis of normalization to a standard dose.
Nuclear Imaging
SPECT/CT nuclear imaging studies were performed by dual-detector nano-SPECT (Bioscan). SCC-9 cells were implanted in the axillary thorax and injected with Opti-MEM (Invitrogen), AdSSTR2, or AdSSTR2-EGFP as described earlier. The mice (n = 3 per group) were injected intravenously with approximately 37 MBq of 111In-DTPA-Y3-octreotate in a volume of 150 μL and imaged 4, 24, and 48 h later. The mice were placed in a multimouse bed insert fitted with tubing to deliver anesthesia (2% isoflurane) by use of a Minerve Rat Imaging Cell (Bioscan). A 9-pinhole collimator was placed in front of each head for a resolution of about 1.5 mm. CT was performed first, and SPECT energy peaks were set at 171 and 245 keV, with a window width of ±10%. A 45-keV helical CT scan was performed at 16 projections and 60 s per projection, and then the SPECT acquisition was performed at 24 projections and 60 s per projection, for a total scan time of about 1 h. Tomographic data were reconstructed iteratively with the manufacturer-supplied INTERVIEW and HiSPECT software for CT and SPECT, respectively.
Optical Imaging
Mice were implanted in the rear flank with SCC-9 cells and injected with AdSSTR2 (n = 6), AdSSTR2-EGFP (n = 8), or AdEGFP (n = 5) as described earlier. In vivo imaging of the mice was performed with a multimodal imaging system (IS4000MM; Eastman Kodak Co.) 48 h after adenovirus injection. Mice were anesthetized, and fur surrounding the tumor was removed with a topical hair removal cream. For EGFP signal detection, broadband light was filtered with a 465-nm optical band-pass filter (Eastman Kodak), and emission was captured with a cooled charge-coupled device camera after a 535-nm band-pass filter (e535WA; Eastman Kodak). The acquisition time was 10 s. After imaging, the mice were sacrificed; tumor, liver, and spleen were removed, cut, and placed on a clear plate for ex vivo imaging. Mean fluorescence intensities (arbitrary units) were measured for each tissue section and averaged.
Statistical Analysis
All data are presented as the mean ± SEM. A 2-tailed Student t test was used to determine statistical significance for all of the in vitro data. For the biodistribution and ex vivo imaging studies, we conducted a 1-way ANOVA to compare the mean differences between the groups. In addition, we performed a Tukey post hoc multiple comparisons test to determine differences between the groups. A P value of less than or equal to 0.05 was considered significant. Statistical analyses were done with SPSS, version 17 (SPSS Inc.).
RESULTS
Radiolabeling and Saturation Binding
High-performance liquid chromatography demonstrated that the radiolabeling efficiency was greater than 99% immediately after the 20-min incubation of 111InCl3 with DTPA-Y3-octreotate and that the radiochemical purity remained greater than 99% after 14 h of storage. The final specific activity was 25.9 MBq/μg (36.9 MBq/nmol). Figure 1 shows representative saturation binding curves for 111In-DTPA-Y3-octreotate binding to SCC-9 cells infected with either AdSSTR2 or AdSSTR2-EGFP at 100 PFU per cell. The Kd of 111In-DTPA-Y3-octreotate for cells infected with AdSSTR2 was 0.10 ± 0.02 nM, and that for cells infected with AdSSTR2-EGFP was 0.11 ± 0.01 nM. The Bmax after infection with AdSSTR2 (3,471 ± 201 fmol/mg) was not significantly different from that after infection with AdSSTR2-EGFP (2,976 ± 64 fmol/mg).

In vitro evaluation of AdSSTR2, AdSSTR2-EGFP, and AdEGFP. (A) Representative saturation binding curves for 111In-DTPA-Y3-octreotate on membrane preparations from SCC-9 cells infected with AdSSTR2 or AdSSTR2-EGFP at 100 PFU per cell. Each data point represents mean ± SEM of triplicate measurements. (B) Fluorescence spectra of SCC-9 cells infected with AdEGFP or AdSSTR2-EGFP at 100 PFU per cell. norm = normalized.
Fluorescence
Cells infected with AdSSTR2 did not show any fluorescence peaks, and the spectrum was dominated by a quickly descending signal due to scattering from the medium (data not shown). The emission spectrum of cells infected with AdSSTR2-EGFP revealed a strong signal at 506 nm and was almost identical to the emission spectrum of cells infected with AdEGFP (Fig. 1B). The fluorescence lifetime for cells infected with AdSSTR2-EGFP was 2.59 ns (χ2, 1.10), and the lifetime for cells infected with AdEGFP was 2.46 ns (χ2, 1.11).
Internalization
The internalization of 111In-DTPA-Y3-octreotate was significantly greater in cells infected with AdSSTR2 than in cells infected with AdSSTR2-EGFP at all time points, except for 15 min (Fig. 2). Curve fitting showed that maximum internalization was not significantly different between cells infected with AdSSTR2 (2,990 ± 156 fmol/mg) and cells infected with AdSSTR2-EGFP (2,551 ± 131 fmol/mg). The initial velocities of internalization were 25.1 and 17.3 fmol/mg/min (P < 0.001) for cells infected with AdSSTR2 and AdSSTR2-EGFP, respectively, as determined by linear regression from 0 to 60 min. The amounts of surface-bound radioactivity were measured for cells infected with AdSSTR2 and AdSSTR2-EGFP and ranged from 65 to 160 fmol/mg at all time points.

Specific internalization of 111In-DTPA-Y3-octreotate at 37°C into SCC-9 cells infected with AdSSTR2 or AdSSTR2-EGFP at 100 PFU per cell. 111In-DTPA-Y3-octreotate (∼1.5 nM) was incubated with cells for various times in presence or absence of inhibitor. Cells were acid washed to remove surface-bound radioactivity and then harvested to determine internalized radioactivity. Data for each time point are presented as mean ± SEM of 3 experiments each performed in triplicate.
Biodistribution
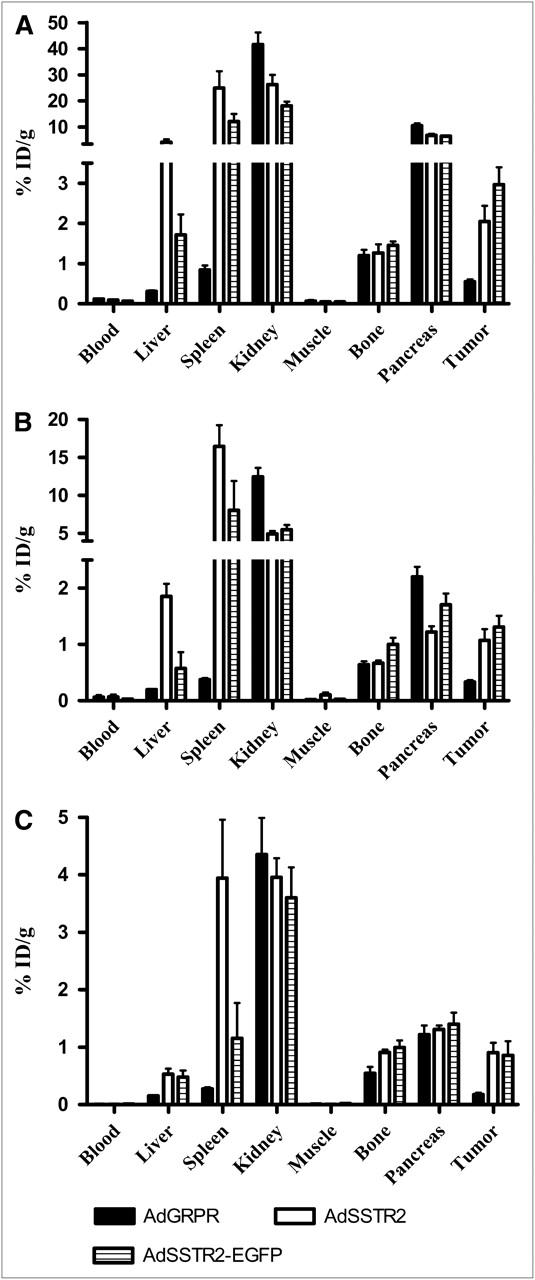
The biodistribution of 111In-DTPA-Y3-octreotate in mice bearing SCC-9 tumor xenografts directly injected with AdGRPR, AdSSTR2, or AdSSTR2-EGFP is shown in Figure 3. The tumor uptake of 111In-DTPA-Y3-octreotate was not significantly different between tumors injected with AdSSTR2 and those injected with AdSSTR2-EGFP at all time points. In fact, there were no differences in the normal tissue uptake of 111In-DTPA-Y3-octreotate between tumors injected with AdSSTR2 and those injected with AdSSTR2-EGFP at all time points, except for the liver at 24 h (P = 0.001), the spleen at 48 h (P = 0.02), and bone at 24 h (P = 0.04). The uptake of 111In-DTPA-Y3-octreotate was significantly greater (P < 0.03) for tumors injected with AdSSTR2 or AdSSTR2-EGFP than for AdGRPR-injected tumors at all time points (Fig. 3). The uptake of 111In-DTPA-Y3-octreotate in the liver and spleen was significantly greater (P < 0.02) for tumors injected with AdSSTR2 than for those injected with AdGRPR at all time points. Although the same trend was observed for mice that received an intratumoral injection of AdSSTR2-EGFP, the difference between the liver and spleen in AdGRPR-injected mice and the liver and spleen in AdSSTR2-EGFP–injected mice did not reach significance, except for the liver at 48 h (P = 0.04) and the spleen at 48 h (P = 0.02).

Biodistribution of 111In-DTPA-Y3-octreotate in mice bearing SCC-9 tumor xenografts. Tumors were injected directly with adenovirus vectors, and 111In-DTPA-Y3-octreotate was injected via tail vein 2 d later. Mice were sacrificed 4 h (A), 24 h (B), and 48 h (C) later (n = 5 for each group). Data are presented as % ID/g ± SEM.
Nuclear Imaging
Nano-SPECT/CT revealed good accumulation of 111In-DTPA-Y3-octreotate in SCC-9 tumors directly injected with AdSSTR2 or AdSSTR2-EGFP (Fig. 4). The tumors were clearly visualized 4, 24, and 48 h after the injection of 111In-DTPA-Y3-octreotate. In contrast, there was little accumulation of 111In-DTPA-Y3-octreotate in SCC-9 control tumors at all time points. Clearance of the radioactive peptide through the kidneys was observed on all images regardless of whether they were for control mice or mice injected with AdSSTR2 or AdSSTR2-EGFP. As in the biodistribution findings, there appeared to be more radioactivity in the liver of mice that received AdSSTR2 or AdSSTR2-EGFP than in the liver of control mice.

Representative coronal nano-SPECT/CT images of SCC-9 tumor–bearing mice at 4, 24, and 48 h after injection of 111In-DTPA-Y3-octreotate. Axillary tumors were injected directly with Opti-MEM (control), AdSSTR2, or AdSSTR2-EGFP 2 d before administration of 111In-DTPA-Y3-octreotate. Coronal images show uptake of 111In-DTPA-Y3-octreotate in AdSSTR2- and AdSSTR2-EGFP-injected tumors but not control tumors (white arrows) and clearance through kidneys (yellow arrows).
Optical Imaging
Representative in vivo and ex vivo fluorescent images of mice bearing SCC-9 tumor xenografts directly injected with AdSSTR2, AdSSTR2-EGFP, or AdEGFP are shown in Figure 5. As expected, the tumor could not be visualized relative to surrounding tissues by in vivo imaging 2 d after the injection of AdSSTR2 (Fig. 5A). In contrast, the tumor injected with AdSSTR2-EGFP (Fig. 5B) or AdEGFP (Fig. 5C) was visible, demonstrating the in vivo expression of SSTR2-EGFP or EGFP after adenovirus injection. Ex vivo images of tissues from the AdSSTR2-injected tumor (Fig. 5D, Table 1) showed that the SCC-9 tumor had high autofluorescence relative to the liver and spleen. Ex vivo visualization of the SCC-9 tumor injected with AdSSTR2-EGFP (Fig. 5E) or AdEGFP (Fig. 5F) revealed fluorescence that was focal in nature and higher than the autofluorescence observed in the AdSSTR2-injected tumor. As in the biodistribution experiments, high fluorescence was observed in the liver of mice that received AdSSTR2-EGFP. However, mice that received AdEGFP did not exhibit liver expression (Fig. 5F, Table 1), as would be predicted. Fluorescence was not observed in the spleen, as would be expected on the basis of the biodistribution experiments. The fluorescence intensities (arbitrary units) in the tumor, liver, and spleen of mice injected with AdSSTR2, AdSSTR2-EGFP, and AdEGFP are shown in Table 1. The data showed that, although there was a trend, there was no significant difference (P = 0.24) between AdSSTR2 (260 ± 68) and AdSSTR2-EGFP (687 ± 161), but there was a significant difference (P = 0.047) between AdSSTR2 and AdEGFP (997 ± 306). There was no significant difference (P = 0.49) between AdSSTR2-EGFP and AdEGFP.
Ex Vivo Fluorescent Imaging of Tissues 48 Hours After Direct Injection of Adenovirus Vectors into SCC-9 Tumors

Representative in vivo (A–C) and ex vivo (D–F) fluorescence imaging of mice bearing SCC-9 tumors injected directly with AdSSTR2 (A and D), AdSSTR2-EGFP (B and E), or AdEGFP (C and F) 2 d earlier. Tumor (arrow) was not visualized in vivo after injection of AdSSTR2 (A, negative control) but could be seen after injection of AdSSTR2-EGFP (B) or AdEGFP (C). In ex vivo studies, tumor had higher autofluorescence than liver and spleen (E), and fluorescence was observed in tumor injected with AdSSTR2-EGFP (D) or AdEGFP (F). au = arbitrary units.
DISCUSSION
The coupling of nuclear and optical reporter genes for multimodality imaging in living subjects has been previously reported (11). In general, these reporters are incorporated into gene expression vectors as separate reporters that are each expressed with their own promoters or with a single promoter and an internal ribosome entry site (20). The other general method for expressing these reporters involves fusion genes; in this method, the reporters are covalently linked so that they are expressed as a single protein (18,21). The majority of studies reported to date have used nuclear reporter proteins that consist of HSV1-TK (or mutant versions) or the sodium iodide symporter and that are expressed with the optical reporter protein as fusions or as individual proteins (5,12,13,22). Previous reports demonstrated the feasibility of using SSTR2 and GFP for multimodality imaging in which the reporter genes were driven by separate cytomegalovirus promoters (14,15).
In the present study, we demonstrated that a fusion of SSTR2 and EGFP can be used for both nuclear imaging and fluorescent imaging. Although not tested in the present study, the fusion protein has a potential advantage: There must be one-to-one expression of both SSTR2 and EGFP, which is not necessarily true when separate promoters or an internal ribosome entry site is used. However, because of differences in detection methods, one-to-one correspondence may not be observed, as we found for the spleen. In addition, a comparison of EGFP and SSTR2 was not performed to determine which modality was more sensitive for detecting small lesions in vivo.
One issue in creating a fusion gene is that the fusion protein may not be functional for both nuclear imaging and fluorescent imaging. Becker et al. created a stably transfected SSTR2-EGFP cell line to evaluate somatostatin analogs that were conjugated with near-infrared dyes to demonstrate that the receptor and the somatostatin analogs had similar internalization patterns in cell cultures (23). They did not specifically determine whether the fusion protein resulted in a lower affinity of the analogs for the receptor but did show that both SSTR2 and EGFP were functional. Similarly, Slice et al. created a cell line expressing a fusion protein (GRPR and GFP) and evaluated it in vitro (24). They demonstrated that wild-type GRPR and GRPR-GFP behaved similarly with respect to bombesin binding and internalization. These studies indicated that an adenovirus vector encoding an SSTR2-EGFP fusion protein could be created and used for nuclear and optical imaging in vivo.
In the present study, we demonstrated that 111In-DTPA-Y3-octreotate bound with the same affinity to both SSTR2 and SSTR2-EGFP after adenovirus infection and that the levels of expression of these proteins were not significantly different (Fig. 1). These findings are similar to those of Slice et al., who reported Kd values of 1.1 and 4.4 nM and Bmax values of 2.9 × 10⁵ and 3.3 × 10⁵ receptors per cell for bombesin binding to stable cell lines expressing GRPR and GRPR-GFP, respectively (24). We previously reported that modification of the extracellular N-terminal portion of SSTR2 by insertion of a hemagglutinin sequence did not significantly change the binding of a radiolabeled somatostatin analog relative to that of wild-type SSTR2 after adenovirus infection (17). In addition, we demonstrated that the fluorescence from cells infected with AdSSTR2-EGFP had the same photophysical properties as that from cells infected with AdEGFP. The fluorescence lifetimes of 2.46 and 2.59 ns are similar to the published EGFP lifetime of approximately 2.7 ns (25). Internalization assays demonstrated that the rate of 111In-DTPA-Y3-octreotate internalization into AdSSTR2-infected cells was greater than into AdSSTR2-EGFP–infected cells but that the maximum amounts of internalization were not significantly different (Fig. 2). Slice et al. reported similar data for the internalization of 125I-gastrin-releasing peptide into GRPR- or GRPR-GFP–expressing cells (24).
Biodistribution studies revealed good uptake of 111In-DTPA-Y3-octreotate into tumors directly injected with AdSSTR2 or AdSSTR2-EGFP at 4, 24, and 48 h (Fig. 3). This uptake was SSTR2 mediated because control tumors had significantly less uptake of 111In-DTPA-Y3-octreotate. We previously demonstrated similar tumor uptake (1.3 %ID/g) 6 h after injection of 111In-DTPA-d-F1-octreotide in mice bearing A-427 tumors directly injected with AdSSTR2 (26). McCart et al. reported tumor uptake of approximately 1 %ID/g at 4 and 24 h after injection of 111In-DTPA-d-F1-octreotide in mice that carried subcutaneous MC38 tumors and that had received an intraperitoneal injection of a vaccinia virus encoding SSTR2 6 d earlier (27). Yang et al. reported that HT1080 tumor xenografts stably expressing SSTR2 had 111In-DTPA-D-F1-octreotide uptake of approximately 1 %ID/g 24 h after injection (10). Thus, our results are comparable to those of other studies evaluating the uptake of 111In-labeled somatostatin analogs in tumors induced to express SSTR2.
The biodistribution data also revealed higher uptake of 111In-DTPA-Y3-octreotate in the liver and spleen of tumors injected with AdSSTR2 or AdSSTR2-EGFP than in the liver and spleen of control mice. Other studies have shown that adenovirus vectors can “leak” from the tumor after direct intratumoral injection and infect the liver and spleen because adenovirus vectors have a natural tropism for these normal tissues (28–30). Wang et al. demonstrated high liver expression of luciferase, EGFP, and interleukin-12 after intratumoral injection of adenovirus vectors encoding the respective genes driven by a constitutive promoter in several subcutaneous tumor models (29,30). Similarly, Lohr et al. reported high liver and spleen expression of EGFP and interleukin-12 after intratumoral injection of adenovirus vectors with constitutive promoters, and they found that this expression was dramatically reduced when a heat-inducible promoter was used (28).
SPECT revealed the uptake of 111In-DTPA-Y3-octreotate in tumors injected with AdSSTR2 or AdSSTR2-EGFP 4, 24, and 48 h after injection of the radiolabeled peptide, a finding that was not observed in control mice (Fig. 4). Tumors injected with AdSSTR2-EGFP or AdEGFP could be visualized in vivo and ex vivo by fluorescence imaging, whereas tumors injected with AdSSTR2 could not be visualized (Fig. 5). We did not see a correlation between the in vivo fluorescence signal for the tumors and the signal from the sliced tumors ex vivo. This was likely due to the heterogeneous expression of the protein within the tumor after direct adenovirus injection relative to stably transfected cell lines, where the expression is homogeneous (23). Protein expression toward the interior of the tumor is more difficult to detect in vivo because of the short emission wavelength associated with EGFP and the poor penetration of visible light through the tissue. However, this same tumor may show a strong signal ex vivo after it has been sliced. A more controlled method of slicing the tumor in these studies may have better accounted for surface versus internal EGFP expression. Planar fluorescence imaging generally lends greater weight to signal from the surface, leading to a qualitative contrast difference rather than a quantitative, full-thickness measurement. The selection of a longer-wavelength fluorescent protein may improve in vivo detection by optical imaging in future studies (16).
The variability in the ex vivo study made it difficult to draw conclusions regarding tumor fluorescence after the injection of AdSSTR2, AdSSTR2-EGFP, or AdEGFP. Because Figure 1B demonstrated the similarity of EGFP in the fusion protein to wild-type EGFP, the differences in the ex vivo study are likely due to differences between the expression of SSTR2-EGFP and the expression of EGFP. As in the biodistribution studies, the ex vivo fluorescence results showed that the liver was infected after the intratumoral injection of AdSSTR2-EGFP. It is not clear why this liver expression was not observed after the intratumoral injection of AdEGFP. Interestingly, fluorescence was not observed in the spleen after the intratumoral injection of AdSSTR2-EGFP or AdEGFP. It is not clear why this fluorescence was not observed, because there was uptake of 111In-DTPA-Y3-octreotate in the spleen of mice injected with AdSSTR2 or AdSSTR2-EGFP. A plausible explanation is that the preponderance of red pulp tissue in the spleen enhances light absorption in the optical window where EGFP fluoresces, leading to fluorescence attenuation. Another explanation is that because optical imaging is not quantitative in this assay, there can be differences from nuclear imaging. These can lead to confusion when interpreting data acquired with these methodologies.
CONCLUSION
We have shown in vivo nuclear and optical imaging of a reporter gene of a cell surface receptor fused with EGFP. SSTR2-EGFP demonstrated the same affinity for 111In-DTPA-Y3-octreotate as wild-type SSTR2 and fluorescence similar to that of wild-type EGFP in vitro. The internalization of 111In-DTPA-Y3-octreotate in SSTR2-EGFP–infected cells was slightly lower than that in wild-type SSTR2 in vitro, but the difference was not apparent in tumor uptake in vivo. We believe that coupling of this multimodality reporter gene with a therapeutic gene will enhance the evaluation of the efficacy of the therapeutic gene in vitro and in preclinical animal models. In addition, endoscopy may be used in the clinical setting to determine the presence of EGFP expression with a high resolution, and SPECT can be used to determine macromolecular disease.
Acknowledgments
This work was supported by the Department of Radiation Oncology, School of Medicine, Washington University, and NIH grants R01 EB04533, R01 EB1430, and P50 CA94056. We gratefully acknowledge Rebecca Andrews, Thomas Kelly, Kimberly Lears, Margaret Morris, and Nicole Fettig for their technical assistance. Also, Erin Smith and Scott Harpstrite of the Molecular Imaging Center at Washington University are acknowledged for their assistance with nano-SPECT imaging.
- © 2010 by Society of Nuclear Medicine
REFERENCES
- Received for publication February 25, 2009.
- Accepted for publication May 19, 2010.


