


Abstract
Recently, integrated small-animal PET/MRI prototypes that provide isochronous and coregistered datasets of morphology and function through the simultaneous acquisition of PET and MRI data have been developed. However, the need for MRI compatibility can constrain the technical design of the PET components and may lead to a lower sensitivity and lower spatial and temporal resolutions. The aim of this study was to evaluate the suitability of a prototype preclinical PET/MRI system for the simultaneous assessment of cardiac metabolism and function in mice. A stand-alone high-resolution small-animal PET scanner using the same evaluation protocols was used as a reference. Methods: Simultaneous PET/MR images of an infarct mouse model (21 animals plus 3 controls) were acquired. The imaging performance of the MRI-compatible PET insert was evaluated with respect to count sensitivity; myocardium-to-background contrast; suitability for the analysis of global left ventricular function; and uptake difference in scar, border-zone, and remote regions. The radiotracer 18F-FDG was used to acquire cardiac gated PET data, applying retrospective coincidence sorting. The PET insert data were coregistered to the MR images by determination of the appropriate transformation matrix. Results: An optimal registration of PET and MR images from the integrated system was achieved, and the reconstructed images showed a good visual correspondence in infarct areas between PET and MRI data. As expected, the PET insert showed a poorer performance with respect to counting rate and myocardium-to-background ratio than did the high-resolution PET. Assessment of left ventricular volumes was possible with the current PET/MRI prototype. A good correlation was found between PET and MRI (R > 0.95). Local PET uptake was successfully determined for different tissue, and a differentiation among remote, border-zone, and scar tissue was possible. However, the uptake difference for the PET/MRI prototype was lower than that for the high-resolution stand-alone PET system. Conclusion: A hybrid PET/MRI prototype was successfully used to assess cardiac parameters in an infarct mouse model, although performance was reduced when compared with a high-resolution animal PET scanner. Future technical improvements are expected to result in comparable performance while providing higher registration accuracy.
Because multimodal imaging offers the opportunity to gather complementary information from 2 or more imaging modalities at the same time, interest in this modality has intensified in the field of biomedical imaging, including cardiac imaging (1). The combination of functional and morphologic information significantly furthers a more thorough understanding of complex biologic mechanisms and is of significant value for both clinical routine imaging and preclinical research. Indeed, combined PET/CT and SPECT/CT systems are today firmly established in clinical routine imaging (2,3) and have also made inroads in preclinical imaging of small animals (4).
However, a combination of PET and MRI is desirable for different reasons. First, MRI offers better soft-tissue contrast than CT and is often superior in tissue characterization and functional assessment because of the large variety of different contrasts and the availability of advanced imaging techniques such as tissue tagging (5) and imaging of diffusion, flow, and perfusion (6,7). In cardiac imaging, MRI additionally allows for the assessment of myocardial fibrosis via visualization of delayed signal enhancement caused by a slower exchange of gadolinium-based contrast agents in fibrotic tissue (8). Second, MRI—compared with CT—does not lead to additional ionizing radiation exposure for the patient. Third, several PET/MRI designs allow for a simultaneous image acquisition (compared with a mere sequential acquisition that is possible with current PET/CT and SPECT/CT designs), with perfect temporal and much-improved spatial coregistration (9–12). All in all, combined PET/MRI is a promising technique, especially for the assessment of the heart in a variety of cardiovascular diseases such as coronary heart disease, dilated and hypertrophic cardiomyopathies, myocarditis, and metabolic disorders. The first hybrid PET/MRI approaches have recently been shown to allow for simultaneous PET and MRI measurements without reciprocal distortions, and the first successful simultaneous acquisitions have been conducted. In contrast to imaging of nonmoving organs and whole-body imaging, sophisticated imaging of the heart, however, requires gated data acquisition with respect to the heart motion. The suitability of combined PET/MRI approaches for cardiac imaging in mice has not yet been proven.
In this work, the feasibility and accuracy of metabolic and functional myocardial imaging with PET/MRI in a mouse model of myocardial infarction are evaluated using one of the first integrated prototype PET/MRI systems. The results are compared with a side-by-side approach using a dedicated high-resolution small-animal PET system to judge the performance of the combined system for myocardial mouse imaging.
Performance was assessed using count sensitivity; myocardium-to-background contrast; the accuracy of PET-based analysis of global left ventricular (LV) function; and the ability to distinguish tracer uptake in remote, border-zone, and scarred myocardium after myocardial infarction.
MATERIALS AND METHODS
Scanner Systems
The combined PET/MRI system used in this study consisted of a standard 7-T small-animal MRI scanner (ClinScan; Bruker BioSpin MRI) equipped with a custom-designed PET insert based on lutetium oxyorthosilicate scintillator crystals combined with avalanche photodiodes. A comprehensive overview was given in the study by Judenhofer et al. (9). These authors showed that reciprocal distortions during simultaneous PET/MR image acquisition are small. A quadrature volume coil for radiofrequency transmission and reception is positioned inside the PET insert. The use of avalanche photodiodes instead of photomultiplier tubes permits the whole PET block detector assembly to be located inside the MRI bore (13). Because of the technical constraints that are imposed on the design of a PET insert by the surrounding magnetic field, radiofrequency and gradient system interference, and limited available space, the performance is limited in this prototype system (resolution, 1.9 mm in full width at half maximum; detection sensitivity, 0.23%; and axial field of view [FOV], 19 mm). Further technical information is provided in the study by Judenhofer et al. (9).
The dedicated high-resolution PET system is based on rotating multiwire gas chambers instead of crystal blocks (quadHIDAC; Oxford Positron Systems) and offers a spatial resolution of 1.1 mm in full width at half maximum, sensitivity of 1.5%, and axial FOV of 280 mm. Details were provided by Schäfers et al. (14).
Experimental Protocol
In 21 C57BL/6 mice (Charles River), myocardial infarctions were induced by ligation of the left anterior descending coronary artery, leading to myocardial infarctions of different sizes due to the variable coronary anatomy. The animals were allowed 1 wk of recovery before being transported to the location of the PET/MRI prototype, where simultaneous PET/MRI scans with the radiotracer 18F-FDG were obtained after an additional day of rest. PET scans were repeated on the high-resolution scanner on average 6 d later. Three additional mice of the same group without prior surgery were also included in the imaging series. One animal had to be excluded from data analysis because of a functional anomaly, resulting in a total of 23 animals imaged.
The local ethics committees and the local authorities of both institutes in Münster and Tübingen approved the study, which was conducted in compliance with institutional guidelines.
Data Acquisition
Simultaneous PET/MRI.
Mice were anesthetized by the continuous inhalation of 1.5% isoflurane–oxygen gas at a flow of 0.7 L/min, and 25.1 ± 5.6 MBq of 18F-FDG were injected in the tail vein. After an unconscious uptake time of 1 h, the mice were placed on the scanner bed and positioned inside the PET insert, with the heart in the center of the combined PET/MRI FOV. The PET acquisition was started and continued throughout the MRI study. Image data were acquired in list mode, for which all coincidence events are stored on hard disk for post hoc sorting and reconstruction. Electrocardiogram and respiratory motion signals were recorded during the scan to monitor the physiologic condition of the mouse and to enable insertion of gating tags into the list-mode data for subsequent cardiac gated processing of the data (15). While the PET acquisition was ongoing, a series of MRI sequences was applied. Starting from a scout scan, short-axis views of the heart were planned and 6–8 contiguous slices covering the entire heart were acquired in cine mode using a fast low-angle shot sequence (flip angle, 25°; in-plane resolution, 0.09 mm; slice thickness, 1 mm; matrix size, 192 × 192). Depending on the heart rate and electrocardiogram pattern, the R-R interval was divided into 10–16 gates covering as much of the whole interval as possible.
For a subgroup of the animals (n = 10), an additional set of rotationally arranged long-axis MRI scans was acquired to assess local wall thickness of the myocardium (Fig. 1A). These slices were chosen for wall thickness assessment rather than short-axis views because they dissect the myocardium essentially perpendicularly and allow for a better delineation of the apical contour, which is averaged out in short-axis views because of the limited slice thickness. MR images were saved in the Digital Imaging and Communications in Medicine format. After termination of the PET list-mode acquisition, the PET raw data were sorted into 12 cardiac gates, corrected for random coincidences, normalized, and reconstructed with a 2-dimensional iterative ordered-subset expectation maximization algorithm (including Fourier rebinning; voxel size, 0.29 × 0.29 × 0.80 mm; matrix size, 128 × 128 × 23). An additional ungated image set was reconstructed for analysis of image quality and regional uptake.

(A) Orientation of rotationally arranged long-axis views. On previously defined short-axis views, orthogonal slices were positioned under different azimuth angles. For visual clarity, only 4 of 8 acquired slices are shown. (B) Example of line profiles for regional tracer uptake evaluation defined on long-axis slice.
High-Resolution PET.
Scans with the high-resolution scanner were carried out with a protocol similar to the PET acquisition with the hybrid PET/MRI scanner, as detailed above. Because of the higher sensitivity of the high-resolution system, the injected dose was reduced to 18.3 ± 2.5 MBq and the acquisition time was set to 30 min. The list-mode data were sorted and reconstructed into a gated image dataset (12 cardiac gates) using a 3-dimensional (3D) ordered-subset expectation maximization algorithm using in-house–developed algorithms (16) (including resolution recovery; voxel size, 0.40 × 0.40 × 0.40 mm; matrix size, 226 × 226 × 350). Data were reconstructed into an ungated image set also.
Data Processing
Simultaneous PET/MRI: Image Registration.
Although acquired in a combined system, the PET and MR images initially are not coregistered, because the modalities use different coordinate systems for image reconstruction. Hence, the system with the PET insert can have an offset and axis flips with respect to the MRI system and a rotation caused by a possible misalignment of the axes of symmetry of the 2 scanners. Coregistration was achieved using an additional combined measurement of a rod phantom filled with 18F. The 3D PET image dataset of the phantom was manually realigned to the MRI slices using appropriate software (AMIDE (17)), and the transformation matrix Mtra was stored. The mice were scanned in 2 groups at different times, with a demounting and remounting of the insert taking place in between. Therefore, the transformation matrix Mtra had to be determined twice.
All PET images were superimposed on the MR images by trilinear resampling of the original PET data images, according to the previously determined transformation and the individual slice parameters. However, a small registration error remained, which was due to the necessary manual registration of the alignment phantom. To determine the variability of the phantom alignment, 1 observer determined Mtra 3 times and 2 more observers repeated the process. The unique Euler angles corresponding to each transformation were determined, and their variability was evaluated.
High-Resolution PET: Post Hoc Coregistration with MRI
An exact registration of the MR images with the PET images acquired with the high-resolution PET scanner was not possible. Therefore, the transformation matrix was determined manually (AMIDE) by visual judgment, and images were resampled to the MR image in-plane resolution by trilinear interpolation. Inter- and intraobserver variabilities were determined in the same way as was done for the integrated PET/MRI scanner.
Image Analysis
Count Statistics.
The count statistics were determined from the ungated image datasets by counting the number of true coincidences detected throughout the scan. Because the FOV of the PET insert covers only part of the animal, whereas the high-resolution scanner images the whole body, the volume being analyzed was restricted to that represented by the short-axis MR image stack to obtain a common image volume and thus comparable count statistics. Because injected activity was higher and acquisition time varied for the PET insert, equivalent counts scaled to the high-resolution PET injected activities and scan duration were additionally calculated.
For the high-resolution scanner, the data were not corrected for random coincidences before reconstruction and thus the number of randoms was estimated in the following simple way: the overall random coincidences were calculated from the number of singles and assumed to be uniformly distributed over the scanner volume. The amount of randoms in a volume of interest was estimated by calculating the percentage of that volume with respect to the total imaging volume. The corrected count statistics were then used for performance comparison.
For each animal, the fraction of the counting rate from the PET insert with respect to the high-resolution PET scan was also calculated to eliminate the influence of the interobject-dependent uptake characteristics of each individual animal.
Myocardium-to-Background Contrast.
The image contrast was defined as the ratio of the mean intensity of the brightest areas in the myocardium (all voxels above a threshold of 70% of the maximum intensity in the myocardium) to the mean intensity in the background (regions of interest were manually placed in the background near the myocardium on the base of the registered high-resolution images, and the same regions of interest were used for the PET insert). Image contrast was calculated using:
Global LV Function.
For the analysis of global functional cardiac parameters from the PET data, the gated image sets were used. LV end-systolic volume (ESV), end-diastolic volume (EDV), and ejection fraction (EF) were determined in the following way.
For PET, the data were analyzed using an automated contour-finding algorithm, which was developed and validated against MRI data before (18). The algorithm, based on the deformation of an elastic surface, iteratively detects the inner and outer contours of the heart over all cardiac gates. Little user interaction is required for preparation, which includes a standardized orientation of the left ventricle and definition of the valve plane. Because the orientation was more difficult to determine from the lower-resolution images of the PET insert data, corresponding MR images were used to support the orientation of the PET images.
For MRI, end-systolic and end-diastolic gates were defined by visual inspection of the LV area in the cine images, and the corresponding image stacks were loaded into an image-processing tool (ImageJ; National Institutes of Health). On each short-axis slice, the endocardial contours were traced manually, and volumes were calculated by multiplying each area by the slice thickness and subsequently summing over all slices, which is commonly referred to as the Simpson rule (19). Tracing was performed independently by 2 investigators, and the mean of both studies was used for analysis.
Myocardial Uptake.
For the subgroup of animals in which additional rotationally arranged long-axis scans were obtained, wall thickness was determined from the MRI scan and compared with the corresponding uptake on the PET scan in a semiautomated procedure. PET data were coregistered to the MRI data as previously described. For each long-axis MRI slice, line profiles through the LV wall were defined by manually marking the epicardial and endocardial borders of the myocardium in the end-diastolic phase. This procedure was done in all regions of the left ventricle but only if the myocardium was unambiguously distinguishable from the surrounding tissue (Fig. 1B). For each line defined in this procedure, the region was classified as remote myocardium, border-zone, or scar area by visual inspection of the LV geometry and function. Wall thickness was calculated, and the maximum of the corresponding intensity profile in the coregistered ungated PET image was determined. The values for both the local wall thickness and the tracer uptake were normalized to the maximum value found in the particular animal to account for individual alterations in LV geometry and global uptake. Mean values of the normalized values were determined for each of the 3 tissue classes, and the results of the PET insert study were compared with those obtained from the high-resolution PET study.
Statistics
All results are provided as mean values, together with SD. Mean values obtained by the 2 PET scanners for identical anatomic, functional, or metabolic parameters are compared by the 2-sided Student t test for paired samples, as were mean values for analog PET-to-MRI comparisons. Mean values for different segments of the myocardium (i.e., remote, border zone, scar) were compared by the 2-sided Student t test for unpaired samples. P values less than 0.05 were considered statistically significant.
For the comparison of PET- and MRI-derived values, a linear regression was calculated using an orthogonal fit (assumed equal variances).
RESULTS
Image Quality and Coregistration
Visual inspection of the coregistered PET and MR images yielded a good correlation of the PET and MRI data (Fig. 2), especially with regard to infarct areas, suggesting that a correct and reproducible spatial registration technique had been developed. The interobserver variabilities as expressed in the SD of the Euler angles α, β, and γ (z-x-z convention) and translational offset x, y, and z were SD(α) = 0.39°, SD(β) = 0.50°, and SD(γ) = 0.00° and SD(x) = SD(y) = SD(z) = 0.00 mm. The intraobserver variabilities were SD(α) = 0.06°, SD(β) = 0.45°, and SD(γ) = 0.00° and SD(x) = SD(y) = 0.00 mm and SD(z) = 0.23 mm.

Sample coregistered PET and MR images. (A) Short-axis view. (B) Long-axis view. Threshold and trilinear interpolation were applied to PET images for visual clarity.
As expected, because of the lower resolution (1.9 vs. 1.1 mm in full width at half maximum), the images obtained with the PET insert showed a larger degree of blurring than did those obtained using the high-resolution scanner.
However, the variability of the registration was found to be larger for the high-resolution images, which had to be manually aligned to the MR images. The interobserver variabilities were SD(α) = 16.04°, SD(β) = 1.93°, SD(γ) = 0.87°, SD(x) = 0.20 mm, SD(y) = 0.42 mm, and SD(z) = 0.23 mm, and the intraobserver variabilities were SD(α) = 10.91°, SD(β) = 0.92°, SD(γ) = 0.53°, SD(x) = 0.20 mm, SD(y) = 0.20 mm, and SD(z) = 0.23 mm.
Count Statistics
The analysis of image count statistics showed a mean number of true coincidences of 1.69 × 10⁷ ± 0.97 × 10⁷ for the high-resolution scanner, and the PET insert yielded 0.24 × 10⁷ ± 0.11 × 10⁷ total counts. Normalized to the lower injected activity and different acquisition time of the high-resolution PET scanner, the equivalent counts for the PET insert were, on average, 0.19 × 10⁷ ± 0.15 × 10⁷ significantly lower than for the high-resolution scanner (P < 0.001). Plots of the absolute individual count statistics for both scanners as well as the relative count statistics of the PET insert normalized to the high-resolution PET are shown in Figures 3A and 3B. A drop in count statistics is noticed for the high-resolution scanner between animals 9 and 10, caused by the fact that when measuring animals 10–23, a substantial fraction of the detector modules had failed and therefore did not contribute to the count statistics.

(A) Total number of true coincidences obtained for each animal. (B) Ratios of observed counts showing relative performance of PET insert with respect to high-resolution PET. (C) Contrast defined as ratio of myocardium intensity to background intensity. highres = high resolution.
On average, for myocardial imaging in mice with the present imaging protocol, the PET insert yielded 15.7% ± 8.6% of the count statistics obtained with the high-resolution scanner, or 14.9% ± 16.5% for the scaled count statistics.
Myocardium-to-Background Contrast
The image contrast found for each animal is shown in Figure 3C. Contrast values were on average 24.53 ± 9.50 for the high-resolution PET and 12.79 ± 14.90 for the PET insert, significantly lower (P < 0.001). Contrast was then also normalized to the corresponding values obtained with the high-resolution PET. On average, a fraction of 0.47 ± 0.41 of the high-resolution PET scanner contrast between myocardium and background was achieved using the PET insert.
Global LV Function
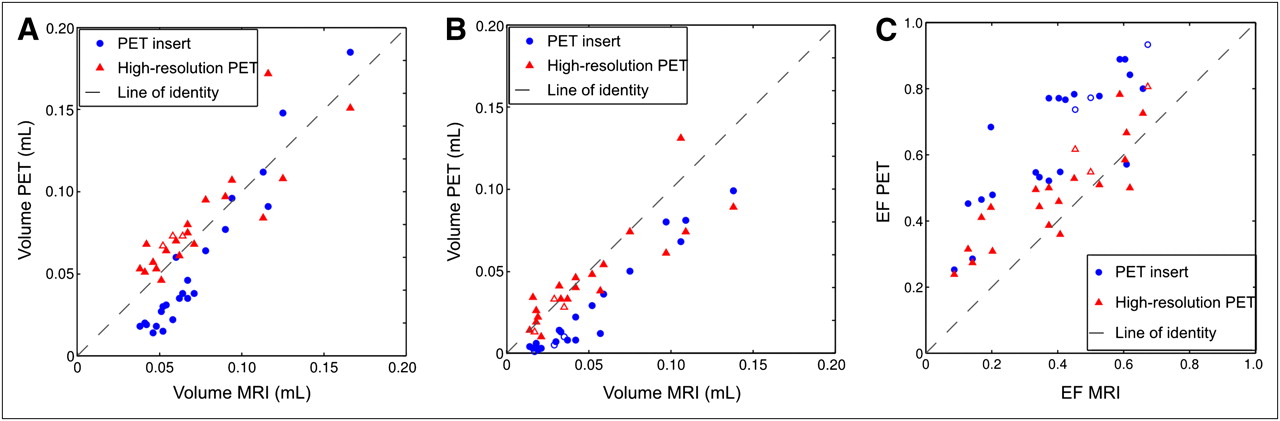
LV ESVs and EDVs and EF obtained from the PET insert and the high-resolution PET were compared with those obtained from the MRI component by calculating the correlation of the 2 datasets. Mean values found with the PET insert were ESV = 25 ± 30 μL, EDV = 54 ± 45 μL, and EF = 0.66 ± 0.20. Mean values found with the high-resolution PET were ESV = 44 ± 29 μL, EDV = 81 ± 32 μL, and EF = 0.50 ± 0.16. Mean values found with MRI were ESV = 48 ± 35 μL, EDV = 72 ± 32 μL, and EF = 0.40 ± 0.18.
Scatterplots of the results are shown in Figure 4. LV volumes obtained by the PET insert correlated well with the corresponding values for MRI (R = 0.97 in both cases). However, the absolute slope of the regression curve deviates significantly from unity for both end-systole (0.85) and end-diastole (1.44), and the fits show a strong negative offset (−0.02 mL in end-systole and −0.05 mL in end-diastole). This negative offset—which becomes more pronounced the smaller the actual volume is—indicates a general underestimation of the volumes. The values for the high-resolution PET are generally higher and located closer around the line of identity. A rather small offset (0.01 mL in end-diastole and end-systole) is observed, and the slopes are 0.97 in end-diastole and 0.78 in end-systole. However, the time difference of about a week between the 2 measurements needs to be considered when directly comparing these results. For the LV EF, a reasonable correlation was found between the PET insert and MRI data (R = 0.85), showing a slope of almost 1, which was due to a fortunate cancelling of the systematic errors observed in the behavior of ESV and EDV. The high-resolution PET yielded a correlation of R = 0.87, and the results are again, in general, closer to the line of identity.

Scatterplots of LV EDVs and ESVs (A and B) and EF (C). Values determined using contour-finding algorithm on PET data from PET insert and high-resolution PET are plotted against corresponding volumes found from MR images. Results for controls are shown as Δ and ○.
Regional Myocardial Uptake
A mean of 49 samples of the wall thickness per heart was taken, and the corresponding maximum uptake was determined. Wall segments classified as remote had a mean thickness of 0.72 ± 0.13 (normalized to the maximum thickness in the respective heart). Wall segments classified as scar, with a mean thickness of 0.32 ± 0.08 (P < 0.01), and border zone, with a mean thickness of 0.50 ± 0.11 (P < 0.01), were significantly thinner. The thickness difference of scar segments to border-zone segments was also significant (P < 0.01). The corresponding uptake values from the PET insert and the high-resolution PET are shown in Table 1, and histograms and box plots of observed uptake values can be seen in Figure 5. For both the PET insert and the high-resolution PET, the mean uptake values for remote segments, border zone, and scar tissue were significantly different (P < 0.01 in all cases). The uptake values in the different regions were, however, more clearly separated with the high-resolution PET than with the PET insert.
Wall Thickness and Regional Tracer Uptake in Different Parts of Myocardium After Myocardial Infarction

Histograms of observed uptake values of 3 different tissue types for PET insert (A) and high-resolution scanner (B). Normal tissue is depicted in green, scar in red, and border zone in blue. Box plots of uptake values found for remote, scar, and border-zone tissue for PET insert (C) and high-resolution PET (D). Red line indicates mean value, blue boxes indicate upper and lower quartiles, and whiskers extend to most extreme data points within 1.5 times interquartile range from upper and lower quartile. Outliers are marked with plusses.
DISCUSSION
Our study has shown that, compared with a stand-alone high-resolution PET system, the PET insert has significantly lower count sensitivity and achievable myocardium-to-background contrast. However, in many cases, these lower values are not a severe problem for myocardial imaging with high-uptake tracers, such as 18F-FDG, that are metabolically trapped. A higher amount of activity or a longer acquisition time can partially compensate for the lower sensitivity. Our images have shown that the myocardium-to-background contrast is still good enough for suitable assessment of myocardial uptake.
The study has also shown that the PET insert is suited for the assessment of global LV function. EDVs and ESVs and LV EF are important parameters to assess the cardiac performance after myocardial infarction. These parameters have strong prognostic significance, as has been shown in several patient studies (20,21). The measurement of regional myocardial glucose metabolism with 18F-FDG PET and global function at the same time are therefore valuable complementary data. The measurement of EDV, ESV, and EF with PET is clearly useful in stand-alone PET scanners; it is less so in hybrid PET/MRI scanners, in which the MRI component may be used for this task. However, the measurement of global functional parameters with PET in addition to regional tracer uptake is fast and convenient and comes more or less for free, whereas it is time-consuming with MRI. For many studies, it may be more useful to use the MRI scanner time for more advanced MRI studies. In this study, the functional assessment revealed the overall good performance of the PET insert with respect to electrocardiogram gating. It is clearly possible to distinguish functionally impaired ventricles from those with normal function, which is the main purpose of functional assessment. The PET- and MRI-obtained values showed excellent correlation for a wide range of values. Nevertheless, the deviation of the slope and y-intercept of the regression lines from 1 and 0, respectively, shows that the values for EDV, ESV, and EF obtained from the PET data can be compared within the PET modality but not with those obtained by other modalities or with literature values. Also, this means that a set of reference values has to be obtained specifically for this PET insert. The effect of underestimating small volumes can be associated with the greater impact of partial-volume effects in the low-resolution PET insert: the images suffer from blurring because of limited resolution. In curved shapes such as the left ventricle, this convolution tends to shift the signal intensity toward the center of the curvature. The shift becomes more pronounced as the curvature becomes more extreme, as is the case for smaller hearts or normal-sized hearts in end-systole. For large infarcts, a major part of the ventricle is metabolically inactive, and therefore only sparse information is left for the contour-finding algorithm to work on, possibly leading to a miscalculation in large EDVs.
The explanation of a lower resolution as the main reason for the underestimation of LV volumes and overestimation of EF is supported when the results are compared with the results of the high-resolution scanner. However, between high-resolution PET and MR images, there are remaining discrepancies in EDV and ESV that were not observed in a previous study using a similar setup and the same contour-finding algorithm (18).
The reason for these discrepancies is most likely to be found in the different study design: first, a limitation of this study is the time delay of about 1 wk between the combined PET/MRI measurements and data acquisition with the stand-alone high-resolution PET scanner and the intermediate animal transport. Even though most of the destruction of myocardium and subsequent structural changes have already taken place in the time between the surgery and first imaging study, as has been shown by Lutgens et al. (22), residual changes may have taken place between the combined PET/MRI and the dedicated PET acquisitions. Second, the software used for MRI contour detection in the study by Stegger et al. (18) was not accessible for this study, and contours were traced manually instead, leading to additional systematic deviances on the MRI side. Thus, the high-resolution PET images do not necessarily correlate with the MR images exactly as has been observed before.
With the PET insert, it is clearly possible to distinguish remote myocardium from border-zone and scar areas in mice after ligation of the left anterior descending coronary artery. For the high-resolution PET images, the coregistration to the MR images was performed manually, which may lead to a higher registration error for the definition of the tracer uptake in the border-zone regions. Despite this limitation, the high-resolution scanner has achieved a better separation of uptake in scar, border-zone, and remote regions.
These technical disadvantages of the PET insert—lower resolution and sensitivity—may, to a certain degree, be overcome by improving the performance of a next-generation PET insert in terms of FOV and spatial resolution. Also, using a 3D instead of a 2-dimensional reconstruction algorithm, which is currently the standard for the prototype scanner, may improve image quality. Compared with stand-alone PET systems, future combined PET/MRI systems with an improved spatial resolution are likely to allow for a more accurate exploration of small regions such as the infarct border zone, because registration errors and mismatch of organs due to repositioning can be minimized. In addition to the complementary information from 2 modalities, simultaneous PET/MRI reduces scanning time and ensures identical physiologic parameters for both acquisitions. Also, the well-coregistered MR image data can be used to develop methods for partial-volume and motion correction of the PET data. The decision between stand-alone PET and MRI systems with the best image quality and an integrated PET/MRI system will, in the end, depend on the particular experiment.
CONCLUSION
This study has shown for the first time, to our knowledge, that with the current PET/MRI technology, simultaneous electrocardiogram gated cardiac PET and MRI measurements are possible, and that metabolic and functional parameters of the infarcted mouse heart can be assessed with a good accuracy with the evaluated prototype scanner. Thus, preclinical cardiac imaging can benefit from the optimal spatial and temporal coregistration of the PET and MRI datasets offered by integrated devices. Future technical advances are expected to narrow the current gap between the PET component of PET/MRI devices and stand-alone PET scanners in terms of sensitivity and spatial resolution.
Acknowledgments
We thank Christine Bätza, Torsten Budumlu, and Fabian Gigengack for assistance in data acquisition and processing; the staff of the cyclotron and radiochemistry facilities of the University Hospital Münster and the University of Tübingen for radiotracer preparation; and Thomas Kösters for providing the 3D reconstruction software. This study was supported in part by the Deutsche Forschungsgemeinschaft (DFG), project GZ PI 771/1-1; SFB 656 “Cardiovascular Molecular Imaging,” Münster, Germany (projects C6, Z2, B3, and PM3); EU NoE “Diagnostic Molecular Imaging—DIMI” (WP 11.1 and 11.2); a travel grant from the Herzzentrum Münster e.V., Germany; the IZKF, Münster, core unit SmAP; and the Dr. Karl Kuhn Stiftung and U.S. National Institutes of Health R21 grant EB0044.
- © 2010 by Society of Nuclear Medicine
REFERENCES
- Received for publication February 22, 2010.
- Accepted for publication April 28, 2010.


