


Abstract
Radiolabeled amino acids are useful for brain tumor diagnosis, but unspecific uptake near the cerebral hematoma may complicate the differentiation of a neoplastic from a nonneoplastic origin of the hematoma. The aim of this study was to investigate the pattern and time course of O-(2-18F-fluorethyl)-l-tyrosine (18F-FET) and l-3H-methionine (3H-MET) uptake in rats with cerebral hematomas. Methods: Intracerebral hematomas were induced in the striatum of 25 Fischer 344 CDF rats by inoculation of bacterial collagenase. 18F-FET and 3H-MET were injected intravenously at different times up to 4 wk after bleeding. One hour after tracer injection, brains were cut in coronal sections and evaluated by dual-tracer autoradiography. Lesion-to-brain (L/B) ratios were calculated by dividing maximal uptake near the hematomas and mean uptake in normal brain tissue. An L/B ratio greater than 1.5 was considered as indicative of pathologic uptake. The autoradiograms were compared with histology and immunostainings for astrogliosis (glial fibrillary acidic protein) and macrophage infiltration (CD68). Results: 18F-FET exhibited significantly increased uptake near the hematomas between 3 and 14 d after bleeding. The time course of pathologic 3H-MET uptake was similar, but after 3–4 wk there was still borderline uptake in single animals. The L/B ratios exceeded the cutoff level of 1.5 in 10 of 23 animals for 18F-FET and in 12 of 22 animals for 3H-MET but did not exceed a value of 3. Immunostainings indicated that increased uptake of both tracers correlated with reactive astrogliosis, whereas 3H-MET uptake was additionally increased in areas with macrophage infiltration. Conclusion: 18F-FET, like 3H-MET, may exhibit significantly increased uptake near cerebral hematomas, especially during the first 2 wk after bleeding, complicating the differentiation between a neoplastic and a nonneoplastic origin of cerebral hematomas.
Intracerebral hemorrhage (ICH) may be an initial presenting sign of intracranial neoplasms, including primary brain tumors such as gliomas and metastatic lesions, in particular metastases from malignant melanoma and renal carcinoma. In such cases, the clinical presentation is identical to that of a hypertensive ICH and may possibly lead to an incorrect diagnosis and inadequate treatment. The primary brain tumors that have a propensity to present with hemorrhage include high-grade astrocytomas, oligodendrogliomas, and mixed oligoastrocytomas (1). In pathologic and radiologic studies, the frequency of spontaneous ICH in intracranial neoplasms ranges from 1.4% to 10% (2). 18F-fluoroethyl-l-tyrosine (18F-FET) is a well-established amino acid tracer for brain tumor diagnostics with PET that is applicable in a satellite concept such as 18F-FDG (3–6). In cerebral gliomas, combined 18F-FET PET and MRI allows a better delineation of tumor margins than MRI alone and improves the targeting of biopsy and radiotherapy and surgery planning (7,8). In addition, 18F-FET PET appears useful in distinguishing tumor recurrence from nonspecific posttherapeutic scar tissue, predicting prognosis in low-grade gliomas, and monitoring metabolic response during treatment (9–12).
Animal experiments have shown that 18F-FET, in contrast to 18F-FDG and 3H-methyl-l-methionine (3H-MET), exhibits no uptake in inflammatory cells and in inflammatory lymph nodes, promising a higher specificity for the detection of tumor cells (13–16). Nevertheless, increased uptake of 18F-FET has been observed in single cases of brain abscesses and in a demyelinating process (17). Furthermore, unspecific uptake of 18F-FET was demonstrated near cerebral ischemia in rats (18). For l-11C-methionine, unspecific uptake has also been reported near the cerebral hematoma that may complicate the differentiation of the neoplastic or nonneoplastic origin of the hematomas (19,20). So far, little is known concerning 18F-FET uptake in cerebral hematomas.
Experimental studies of cerebral hematomas have provided further insight in characterizing injury and its underlying mechanisms. There are 2 widely used rodent hematoma models. One involves infusing autologous whole blood, whereas the other uses bacterial collagenase (21,22). Similar to the situation in human ICH, the collagenase model is characterized by prolonged bleeding and produces a stronger inflammatory response than the blood-infusion model (22). Therefore, the collagenase model appeared to be a more appropriate choice to explore unspecific tracer uptake. In this study, the time course of 18F-FET and 3H-MET uptake in rat brain hematoma induced by collagenase was investigated using dual-tracer autoradiography and immunofluorescence imaging. 3H-MET, which can be considered the gold standard for amino acid imaging of brain tumors with PET, was chosen as the reference tracer.
MATERIALS AND METHODS
Radiopharmaceuticals
The amino acid 18F-FET was produced via phase transfer–mediated nucleophilic 18F-fluorination of N-trityl-O-(2-tosyloxyethyl)-l-tyrosine tert-butyl ester and subsequent deprotection with a specific radioactivity of greater than 200 GBq/μmol (6). The uncorrected yield of tracer was about 35%, and radiochemical purity was greater than 98%. The tracer was administered as an isotonic neutral solution.
[3H-methyl]-l-methionine with a specific radioactivity of 3 TBq/mmol and d-3H-deoxyglucose with a specific radioactivity of 300 GBq/mmol were obtained commercially from Amersham Biosciences Europe GmbH.
Animal Experiments
Twenty-five male Fischer 344 CDF rats (age, 7–11 wk; weight, 225–345 g; Charles River Wiga) were used in this study. The experiments were approved by the district government according to the German law on the Protection of Animals (Cologne, Germany, no. 8-87-50.10.35.08.209).
The animals were kept under standard conditions with free access to food and water. An ICH was induced in the corpus striatum of each animal using the collagenase method (21,22). Animals were sedated in an isoflurane atmosphere (2%−5%) and anesthetized with an intraperitoneal injection of ketamine (100 mg/kg)/xylazine (10 mg/kg). For the injection of collagenase, the animals were placed in a stereotactic frame, the skin of the skull was incised, and a 0.9-mm burr hole was drilled 2 mm posterior and 3 mm lateral to the bregma. We used a 10-μL Hamilton syringe to infuse bacterial collagenase from Clostridium histolyticum type VII (1.5 KU) (CO773; Sigma) into the striatum 5 mm deep from the external surface of the calvarium over 10 min (0.2 U in 1.0 μL of sterile saline). Subsequently, the syringe was removed at 10 min, and the incision was sutured.
At variable times up to 4 wk after induction of the ICH (Table 1), animals were reanesthetized for tracer injection. A mixture of 50–100 MBq of 18F-FET and 11 MBq of 3H-MET was injected via a jugular vein in each animal. For a few animals, 1 of the tracers was not available at the time of the experiment (2 for 18F-FET and 3 for 3H-MET; Table 1). In these cases, the data of the second tracer were included in the evaluation. One hour after tracer injection, animals were killed and the brains were removed immediately and frozen in 2-methylbutane at −50°C. Sections of the hematoma-bearing brain were produced (thickness, 20 μm) using a cryostat microtome (CM 3050; Leica Mikrosysteme Vertrieb GmbH).
Data on Animals with Cerebral Hematoma
Autoradiography
The tissue sections were placed on phosphor imaging plates (Raytest-Fuji) along with industrial tritium activity standards (Microscales; Amersham Biosciences) for 3H-studies and calibrated 18F liver paste standards made in-house. The first exposition to depict distribution of the 18F radioactivity was started within 2 h after tracer injection. This exposition was done on imaging plates insensitive to β−-particles of 3H (BAS-SR 2025; Raytest-Fuji). After decay of 18F (10 half-lives), the brain slices were exposed to 3H-sensitive imaging plates to obtain 3H distribution (BAS-TR 2025; Raytest-Fuji). On exposure, the imaging plates were scanned with a high-performance imaging plate reader (BAS 5000 BioImage Analyzer; Raytest-Fuji). Quantitative autoradiograms were generated (Bq/mg of wet weight of the tissue) using the software provided by the manufacturer and the known radioactivity concentrations of the standards. The autoradiograms were evaluated by circular regions of interest placed on areas with maximal tracer uptake near the ICH (size, 1.2 ± 0.7 mm2) and the contralateral normal brain tissue (size, 2 mm2). The position of the background region of interest was identical in all animals but different for the region of interest near the ICH in 6 animals. The animals with locally different maximums for the 2 tracers were animals 7–12, which were investigated between days 5 and 7 after bleeding. Standardized uptake values (SUVs) were calculated by normalization of the average uptake in the regions of interest of maximal tracer uptake in the lesion (maximum SUV [SUVmax]) with respect to average uptake in the contralateral gray matter (SUVbr) to injected dose and body weight. Lesion-to-brain (L/B) ratios were calculated by dividing the SUVmax in the lesion by SUVbr. On the basis of PET studies with 18F-FET and 11C-MET in brain tumor patients, an L/B ratio greater than 1.5 was considered as indicative of pathologic uptake (7,23).
Double Immunofluorescence Labeling and Histologic Staining
Double immunofluorescence labeling was performed to identify specific subtypes of cells involved in the process of tracer uptake. Macrophages were demonstrated with mouse antirat CD68 monoclonal antibodies (1:50; Serotec). Reactive astrocytes in brain slices were detected by staining for glial fibrillary acidic protein (GFAP) using rabbit antirat GFAP polyclonal antibodies (1:1,000; Abcam). As secondary antibodies, goat antirabbit Alexa Fluor 568 or goat antimouse Alexa Fluor 488 (1:300; Invitrogen) were used. Tissue slices were counterstained with 4′,6′-diamidino-2-phenylindole hydrochloride (2 μg/mL), which is known to form fluorescent complexes with double-stranded DNA (Sigma-Aldrich Chemie GmbH). In addition, tissue slices were histologically stained by toluidine blue or hematoxylin in serial slices.
MRI
To compare the distribution of 18F-FET and 3H-MET with conventional MRI and blood–brain barrier disruption as determined by contrast enhancement after injection of the paramagnetic contrast agent gadolinium–diethylenetriaminepentaacetic acid (DTPA), 10 animals (Table 1) were investigated additionally by MRI before 18F-FET and 3H-MET injection. MRI examinations were performed with a 9.4-T animal scanner. The scanner comprised a superconducting magnet (Magnex) with a 16-cm bore and was equipped with a 10-cm-inner-diameter gradient coil (Magnex), with a maximum field strength of 270 mT/m/axis, and a Unity Inova console (Varian). A surface coil (diameter, 3 cm) was used for both radiofrequency transmit and signal receive. The animals were anesthetized by injection of ketamine as described for the animal experiments before the MRI scan and were positioned in an acrylic holder equipped with a bite bar and ear restraints. The radiofrequency coil was placed in a fixed geometry immediately above the skull of the animal. A T1-weighted protocol was used before and 2 min after injection of 150 μL of gadolinium-DTPA (Magnevist). The measurement parameters for the spin-echo sequence included a repetition time of 1,000 ms, an echo time of 10.5 ms, a field of view of 30 × 30 mm, a matrix size of 256 × 256, close to whole-brain coverage using 2 sets of 16 slices of 0.5-mm thickness and 0.5-mm gap, and 3 averages. The total acquisition time of the MRI protocol, before and after contrast, was approximately 50 min.
Statistical Analysis
Values are expressed as mean ± SD. Statistical methods used were t test for group comparisons and the Pearson correlation coefficient. Probability values less than 0.05 were considered significant.
RESULTS
Circumscribed hematomas were produced in all animals. The maximal diameter of the hematomas as measured in histologic slices ranged from 1.9 to 12.1 mm. The SUVs and L/B ratios of 18F-FET and 3H-MET uptake near the cerebral hematomas are given in Table 1. 18F-FET exhibited significantly lower SUVs than did 3H-MET, both near the hematomas (SUVmax, 0.7 ± 0.3, n = 23, vs. 1.6 ± 0.6, n = 22; P < 0.01) and in the normal brain (SUVbr, 0.5 ± 0.2, n = 23, vs. 1.1 ± 0.3, n = 22; P < 0.01). The mean values of the L/B ratios of 18F-FET and 3H-MET, however, were the same, at 1.6 ± 0.6 for both.
The time course of L/B ratios of 18F-FET and 3H-MET uptake is shown in Figures 1A and 1B, respectively. 18F-FET exhibited increased uptake near the hematomas between 3 and 14 d after bleeding. The time course of maximal 18F-FET and 3H-MET uptake near the hematomas was similar, but after 3–4 wk there was still borderline uptake for 3H-MET in some animals. The L/B ratios of 18F-FET and 3H-MET uptake near the hematomas were significantly higher at 3, 5–6, and 7–9 d after bleeding than those at 1 and 28 d after bleeding (P < 0.05, Fig. 1). The L/B ratios exceeded the cutoff level of 1.5 in 10 of 23 animals for 18F-FET and in 12 of 22 animals for 3H-MET but did not exceed a value of 3 for both tracers. There was a significant correlation between the L/B ratios of 18F-FET and 3H-MET uptake (r = 0.98, P < 0.001) near the hematomas (Fig. 2).

Distribution of L/B for 18F-FET (A) and 3H-MET (B) at variable times after induction of cerebral hematoma. Cutoff level of 1.5 was used to indicate pathologic uptake. L/B ratios of 18F-FET and 3H-MET uptake near hematomas were significantly higher at 3, 5–6, and 7–9 d after bleeding than at 1 and 28 d after bleeding. Time course of 3H-MET uptake is similar to that of 18F-FET, but after 3–4 wk there was still borderline uptake in some animals. *P < 0.05.
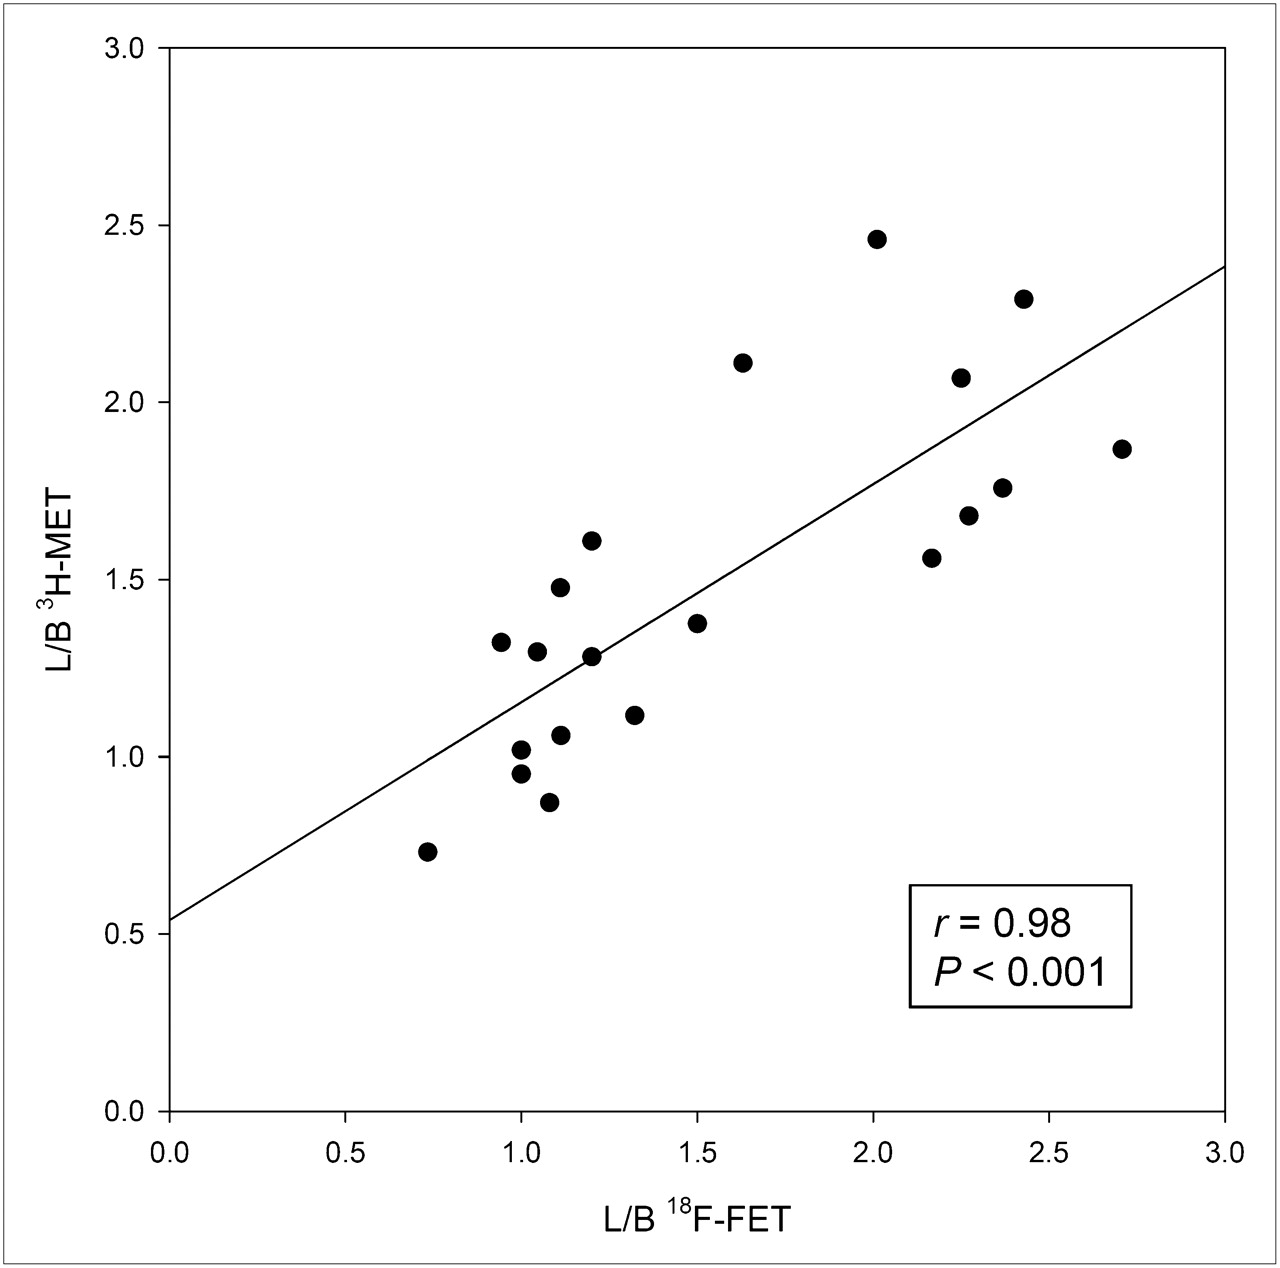
Comparison of L/B ratios of 18F-FET and 3H-MET uptake in areas with high tracer uptake near hematomas. There is significant correlation.
One day after bleeding, there was no pathologic uptake of either tracer near the hematomas and there was no pathologic contrast enhancement in MRI. Also, immunofluorescent imaging showed no major abnormalities in CD68 and GFAP staining. An example is shown in Figure 3. Some unspecific uptake of 18F-FET and 3H-MET and corresponding contrast enhancement in MRI was present at the brain surface originating from the injury caused by inoculation of collagenase. After 3 d, widespread diffusely increased uptake of both tracers was noted surrounding the hematomas and correlating with the distribution of a GFAP-positive reactive astrogliosis on immunofluorescent imaging (Fig. 4). Furthermore, increased staining for CD68 at the edge of the hematoma was noted, indicating beginning macrophage infiltration. No pathologic contrast enhancement in MRI was observed. After 5 d, a discrepancy of pathologic 18F-FET and 3H-MET uptake was noted in some animals (Fig. 5). Immunofluorescent imaging indicated that pathologic 18F-FET uptake correlated with GFAP-positive astrogliosis, whereas increased 3H-MET more closely correlated with the area of macrophage infiltration as shown by CD68 staining (Supplemental Fig. 1; supplemental materials are available online only at http://jnm.snmjournals.org). At that stage, contrast enhancement in MRI matched with increased 3H-MET uptake but not with pathologic 18F-FET uptake. At 3 wk after bleeding, 18F-FET uptake returned to the level of the normal brain whereas 3H-MET showed still borderline uptake in single animals that matched with areas of CD68 staining. After 4 wk, a sharp GFAP-positive band at the edge of the hematoma and some GFAP-positive agglomerations in the surroundings of the hematoma that showed contrast enhancement in MRI (Fig. 6) were observed. Also, some CD68-positive cell agglomerations were noted in the center of the hematoma. Uptake of both tracers in those areas was low.
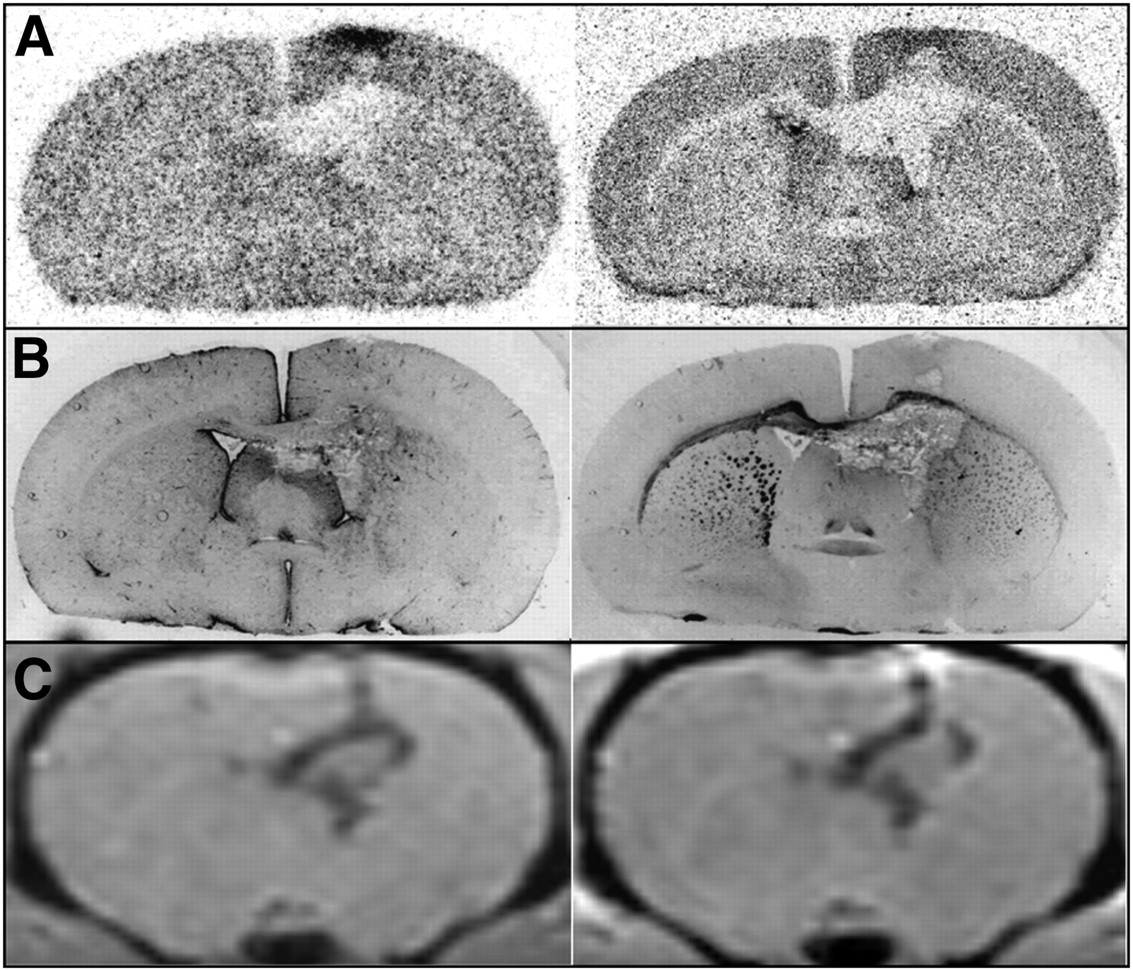
Coronal brain slices of rat 4 at 1 d after ICH. (A) Autoradiography (left, 18F-FET; right, 3H-MET). (B) Immunofluorescent imaging (left, GFAP; right, CD68). (C) MRI (left, T1-weighted; right, contrast-enhanced T1-weighted after intravenous injection of gadolinium-DTPA). MRI shows some unspecific uptake of 18F-FET and 3H-MET and corresponding contrast enhancement at brain surface originating from injury caused by inoculation of collagenase, whereas uptake of both tracers near hematoma is similar to that of normal brain tissue.

Coronal brain slices of rat 5 at 3 d after ICH. (A) Autoradiography (left, 18F-FET; right, 3H-MET). (B) Immunofluorescent imaging (left, GFAP; right, CD68). Diffusely increased uptake of both tracers near hematoma correlates with distribution of GFAP-positive astrogliosis in immunofluorescent imaging. Furthermore, positive staining for CD68 at edge of hematoma indicates macrophage infiltration.

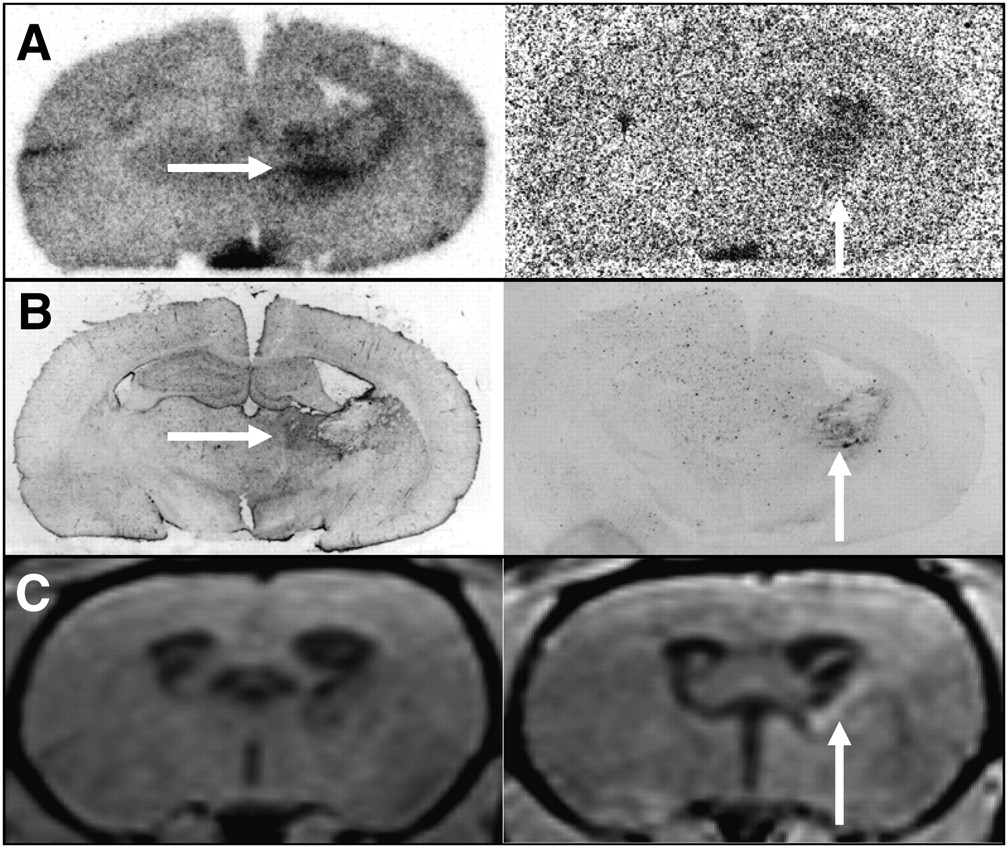
Coronal brain slices of rat 7 at 5 d after ICH. (A) Autoradiography (left, 18F-FET; right, 3H-MET). (B) Immunofluorescent imaging (left, GFAP; right, CD68). (C) MRI (left, T1-weighted; right, contrast-enhanced T1-weighted after intravenous injection of gadolinium-DTPA). Discrepancy is seen between pathologic 18F-FET and 3H-MET uptake. Although pathologic 18F-FET uptake correlated with GFAP-positive astrogliosis (horizontal arrows in A and B), increased 3H-MET uptake was more closely correlated with area of macrophage infiltration as shown in CD68 immunofluorescent imaging (vertical arrows in A and B). MRI shows some contrast enhancement in same area (vertical arrow in C).

Coronal brain slices of rat 22 at 28 d after ICH. (A) Autoradiography (left, 18F-FET; right, 3H-MET). (B) Immunofluorescent imaging (left, GFAP; right, CD68). (C) MRI (left, T1-weighted; right, contrast-enhanced T1-weighted after intravenous injection of gadolinium-DTPA). Uptake of both tracers near hematoma has returned to normal and is similar to that of normal brain. However, area of abnormal GFAP staining, with corresponding contrast enhancement on MRI (black arrow in B and C), shows no tracer accumulation on autoradiography.
DISCUSSION
The distinction between hemorrhagic intracranial neoplasms and nonneoplastic hematomas remains a challenge because of considerable overlap in neuroradiologic imaging findings (24,25). PET using radiolabeled amino acids is helpful in the diagnostic work-up of cerebral gliomas, and 18F-FET PET may be considered as an additional diagnostic tool when the differentiation of a neoplastic from a nonneoplastic origin of a hematoma is unclear. The uptake of 18F-FET, however, is not absolutely specific for brain tumor tissue and, similar to the uptake for other amino acid tracers, unspecific uptake may occur in various other brain pathologies. The purpose of this study was to elucidate the uptake behavior of 18F-FET and its time course near the brain hematomas.
In this study, we used the collagenase model, which is considered a particularly elegant rat model. Intrastriatal injection of bacterial collagenase disrupts the basal lamina of cerebral capillaries and causes bleeding into the brain tissue (21). This model is widely used because of its simplicity and the belief that the model results in bleedings that are more consistent with the situation in humans than the blood-infusion model.
The evolution of ICH has previously been categorized into 4 stages using a canine model (26). In the acute stage (days 1–3), only a mild perivascular inflammatory reaction and a narrow zone of neuron death may occur. In the subacute stage (days 4–8), inflammation peaks, macrophages, and fibroblasts appear in the periphery of the hematoma, and reactive astrocytes appear in the surrounding brain. During the capsule stage (days 9–13), macrophages and fibroblasts increase, and vascular proliferation begins to encroach on the hematoma from the periphery. The formation of a dense capsule at the edge of the hematoma and a less organized collagen proliferation in the center of the hematoma occur in the organization stage (days 13 and on). A similar histologic progression has also been reported using the collagenase model in rats (27).
In this study, during the acute stage at day 1 after bleeding, uptake of both tracers near the hematoma showed no significant changes, compared with that of the normal brain tissue. No major abnormalities were observed in immunofluorescent imaging, which is in line with the mild inflammatory reaction reported in previous studies (26). In the subacute stage and early capsule stage between 3 and 14 d after bleeding, however, uptake of both tracers near the hematomas exceeded the threshold of the L/B ratio of 1.5 in most cases and was significantly higher than in the acute stage and in the organization stage 4 wk after bleeding. This finding indicates that the differentiation between neoplastic and nonneoplastic origin of the hematoma using 18F-FET or 11C-MET PET may be difficult between 3 and 14 d after bleeding. Tracer uptake, however, did not exceed an L/B ratio of 3, which is exceeded in at least 30% of the gliomas (7). This is in line with clinical studies using 11C-MET that showed a maximal L/B ratio of 2.2 in nonneoplastic hematoma (19,20). Therefore, L/B ratios above 3 may indicate a brain tumor. A further differentiation of unspecific 18F-FET uptake may be achieved by dynamic imaging, which was not available in our experimental setup. Recent studies have shown that high-grade gliomas are characterized by an early peak around 10–15 min after injection, followed by a decrease of 18F-FET uptake while time–activity curves slightly and steadily increase in low-grade tumors and benign lesions (4,10).
Immunofluorescent imaging at day 3 after bleeding showed that the area of increased uptake was similar to the area of GFAP-positive astrogliosis in the surrounding brain. At 5 d after bleeding, however, a discrepancy of abnormal 18F-FET and 3H-MET uptake was noted in single animals. At that stage, pathologic 18F-FET still overlapped with GFAP-positive astrogliosis, whereas increased 3H-MET was more closely associated with the area of macrophage infiltration, as shown in CD68 immunofluorescent imaging. A similar discrepancy in the uptake behavior of the 2 tracers has also been observed in experimental cerebral ischemia using the photothrombosis model (18). In that study, focal uptake of 18F-FET was observed up to 7 d after ischemia, whereas 3H-MET uptake persisted up to 6 wk and a different pattern of uptake was seen in some animals. These differences were caused by differential uptake of the 2 tracers in different cell populations, namely by preferential uptake of 18F-FET in GFAP-positive reactive astrocytes but correlation of 3H-MET uptake with CD68-positive macrophage infiltration. Similar differences between 18F-FET and 3H-MET uptake were also observed in an experimental abscess model (15). Thus, the results of the present study confirm the observation of nonspecific uptake of 18F-FET in brain areas with reactive astrogliosis, and 3H-MET obviously shows additional uptake in areas with macrophage infiltration. On the other hand, positive staining with GFAP or CD68 in the late stage of the hematoma is not necessarily linked with increased uptake of 18F-FET or 3H-MET (Fig. 6). This may indicate a variable affinity of astroglia or macrophages for amino acids in different stages of activation.
After 2 wk, the L/B ratios of 18F-FET uptake were below the cutoff level of 1.5 so that at later stages unspecific uptake of 18F-FET may be less critical. For 3H-MET, borderline uptake near the hematomas was present in some cases up to 4 wk, indicating that pathologic uptake may persist for a longer period than for 18F-FET, which may be caused by the longer persistence of macrophage infiltration in the capsule stage. This observation is supported by 2 clinical studies that reported on pathologic 11C-MET uptake in patients with nonneoplastic brain hematomas up to 45 d after the bleeding episode (19,20).
The temporal changes in MRI in hematoma models in the rat have been described in detail in previous studies (27,28). Additional MRI scans were obtained in our study to test whether pathologic tracer uptake was correlated with contrast enhancement. No contrast enhancement was noted in the areas with increased 18F-FET uptake that correlated with reactive astrocytosis. This confirms the general finding that pathologic 18F-FET uptake is not necessarily linked to areas with blood–brain barrier disruption. For 3H-MET, the situation was different and some contrast enhancement was present on the MR image in areas with macrophage infiltration that showed increased 3H-MET uptake.
The discordant uptake of 18F-FET and 3H-MET in macrophages indicates differences in the uptake mechanisms of the 2 amino acids. Experimental studies suggested that the transport mechanisms of 18F-FET and 3H-MET in glioma cells in vitro were comparable in principle (29). Studies in patients with peripheral tumors, however, found no uptake of 18F-FET in most of the peripheral tumors, especially in lymphomas and most adenocarcinomas, which is in contrast to the results obtained with 11C-MET and different tyrosine derivatives (30). It was speculated that 18F-FET may be transported via a specific subtype of the system L amino acid transporter, which is not ubiquitously expressed.
Another tracer-based method that has been tested in distinguishing neoplastic from nonneoplastic brain hematomas is 99mTc-methoxyisobutylisonitrile SPECT (31,32). It was found that nonneoplastic ICH showed no 99mTc-methoxyisobutylisonitrile uptake within 2 d after bleeding, whereas at later stages there was increased tracer uptake. It was concluded that 99mTc-methoxyisobutylisonitrile SPECT can clearly differentiate neoplastic and nonneoplastic ICH only during the acute phase, and examinations should be started early after the onset of symptoms. It is rather likely that this conclusion also holds true for amino acid PET. Unfortunately, it is still difficult to organize the rarely available PET investigations with radiolabeled amino acids in urgent situations.
Finally, some shortcomings of this experimental study need to be discussed. The comparability of MRI scans that were acquired in vivo to those of the ex vivo autoradiograms of the rat brain is hampered by the deformation of the brain after removal from the body. The visual comparison of the scans based on anatomic structures, however, appears to be sufficient to allow the conclusions drawn from these data.
Although rats have been the most commonly used species for ICH studies, their paucity of white matter limits relevance for the human disorder (33). In the collagenase model, the cause of the hemorrhage (widespread dissolution of the endothelial basement membrane) differs from that of a spontaneous ICH, and the enzyme has toxic effects on brain parenchymal cells. Furthermore, the time resolution of the hematoma is shorter in the rat than in larger species (27). Therefore, the validity of these experimental data for the situation in humans has to be considered with caution, and clinical studies are needed to confirm these observations in humans. Another limitation of our study concerns the arbitrary cutoff level of 1.5 that was chosen to define pathologic uptake of 18F-FET and 3H-MET. For 18F-FET, this value is based on a previous biopsy-controlled study in patients with gliomas. In that study, for tissue samples corresponding to normal and peritumoral tissues an L/B ratio for 18F-FET uptake of 1.2 ± 0.4, with a threshold of 1.5 separating glioma tissue from normal brain tissue, was found (7). For 11C-methionine, another study determined a threshold value of 1.47 to differentiate tumor from benign lesions (23). The inflammatory or reparatory processes in the rat brain may differ in time and intensity but are in principle similar to those observed in the human brain (21,22). It is rather likely that increased uptake of amino acid tracers induced by reparative processes in the rat brain is similar to that in the human brain. Therefore, an L/B ratio greater than 1.5 appears to be a reasonable threshold to indicate pathologic uptake of both tracers that is characteristic for human gliomas.
CONCLUSION
Our results in experimental brain hematomas demonstrate that 18F-FET, like 3H-MET, may exhibit significantly increased uptake near the cerebral hematomas, especially during the first 2 wk after bleeding, complicating the differentiation of a neoplastic from a nonneoplastic origin of cerebral hematomas. The critical time window appears to be shorter for 18F-FET than for 3H-MET. Tracer uptake, however, did not exceed an L/B ratio of 3 so it could be hypothesized that L/B ratios above 3 may indicate a brain tumor.
Acknowledgments
We thank Stephanie Klein for technical assistance; Norbert Hartwigsen for animal husbandry; and Erika Wabbals, Silke Grafmüller, and Sascha Rehbein for technical assistance in radiosynthesis of 18F-FET. This work was supported by the Deutsche Forschungsgemeinschaft (grant La-1263/1-3) and by the Brain Imaging Center West (BICW). The facility for magnetic resonance imaging at the Institute of Medicine, Research Center Jülich, was supported by the Bundesministerium für Bildung und Forschung grant BMBF 01GO0104.
Footnotes
-
COPYRIGHT © 2010 by the Society of Nuclear Medicine, Inc.
References
- Received for publication October 9, 2009.
- Accepted for publication January 26, 2010.


Jump to section
Related Articles
Cited By...
- Treatment-Related Uptake of O-(2-18F-Fluoroethyl)-L-Tyrosine and L-[Methyl-3H]-Methionine After Tumor Resection in Rat Glioma Models
- Epileptic Activity Increases Cerebral Amino Acid Transport Assessed by 18F-Fluoroethyl-L-Tyrosine Amino Acid PET: A Potential Brain Tumor Mimic
- The Usefulness of Dynamic O-(2-18F-Fluoroethyl)-L-Tyrosine PET in the Clinical Evaluation of Brain Tumors in Children and Adolescents
- Replay: Being Sensitive: to Specify When Amino Acid Tracers Accumulate in a Brain Lesion