


Article Figures & Data
Figures
- FIGURE 1.
11C-CUMI binding. (Top) MR images of subject. (Middle) Sum of last 60 min (6 frames) of PET acquisition. (Bottom) BPF value of every voxel within brain slices (calculated using EBEGA), with color bar indicating values of BPF data shown.
- FIGURE 2.
Hippocampal time–activity curve fits. On left side, 2TC (iterative, 2TC; noniterative, 2TCNI; constrained, 2TCC) model fits are indicated. Raw data are shown with diamonds. On right side, raw data are shown (◆) transformed into space used for graphical interpretation. Cp is concentration of ligand in plasma, and CROI is concentration of ligand in hippocampus. 1TC = 1 tissue compartment; 1TC-NI = 1 tissue compartment, noniterative; SUV = standardized uptake value.
- FIGURE 3.
BPF TS. BPF was calculated using 5 models at 6 scan durations. For each region, percentage of total scans (n = 14) in which calculated BPF was within 5% of BPF calculated at 120 min was determined. This plot shows average of these percentages over all regions tested. Error bars indicate SD. Constr = constrained.
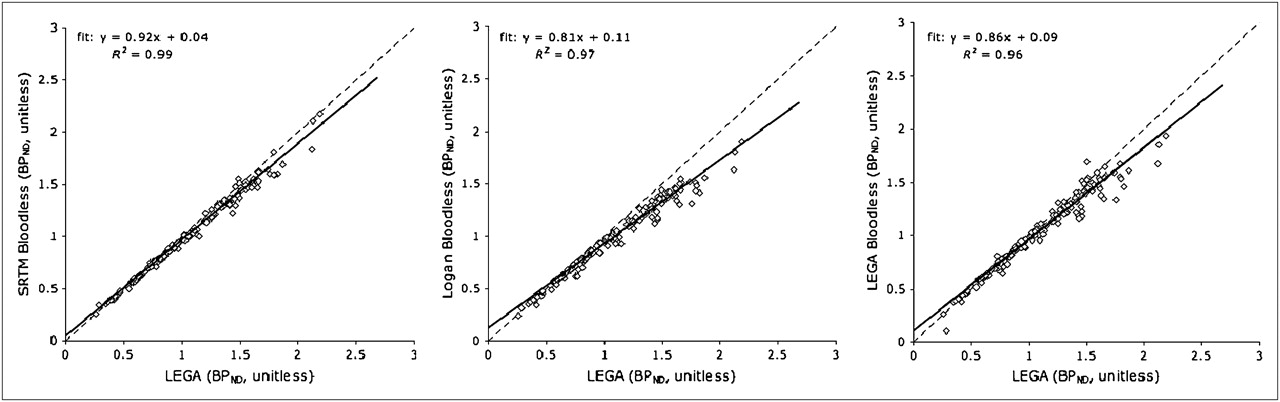
- FIGURE 4.
LEGA BPND with plasma input, compared with BPND values calculated by RR approaches. All high-binding ROIs listed in Table 1 are included. Identity lines are plotted (dashed lines) for reference.
- FIGURE 5.
Comparison of ROI and voxel analysis. VT (left) and BPND (right) values as found by ROI analysis vs. average of all voxels within ROI as found using voxel analysis. Identity lines are plotted (dashed lines) for reference.
- FIGURE 6.
VT TS. VT values were calculated using LEGA and scan times ranging from 70 to 120 min. At each time period, percentage error between regional VT at that scan duration and VT calculated using 120 min of scan duration was calculated and averaged. Error bars are omitted for clarity. CGM = cerebellar gray matter; ENT = entorhinal cortex; HIP = hippocampus; INS = insula.


Tables
ROI Average BPF of each ROI (mL/cm3) PD (%) WSMSS (mL/cm3) ICC (unitless) SD (%) Identifiability (mL/cm3) Entorhinal cortex* 32.62 3.86 ± 12.42 6.32 0.87 20.79 4.68 Hippocampus 31.66 6.85 ± 5.98 3.90 0.90 18.86 4.70 Insula 28.61 5.44 ± 11.42 5.50 0.64 13.27 3.42 Posterior parahippocampal gyrus* 26.10 2.37 ± 9.52 3.22 0.86 17.48 3.28 Temporal lobe* 25.50 7.82 ± 10.14 3.79 0.79 16.01 2.99 Amygdala 21.20 6.25 ± 9.79 3.16 0.90 25.45 3.09 Cingulate* 18.48 0.33 ± 14.42 2.58 0.77 17.65 1.85 Medial prefrontal cortex* 17.14 7.09 ± 11.68 2.37 0.67 15.33 1.69 Orbital prefrontal cortex* 14.87 18.34 ± 22.73 5.35 0.59 23.84 1.53 Parietal lobe* 14.06 4.40 ± 10.97 1.16 0.70 13.59 1.28 Dorsolateral prefrontal cortex* 13.69 10.20 ± 13.89 2.32 0.56 16.47 1.29 Raphe 12.42 16.54 ± 19.26 2.96 0.80 29.96 1.77 Occipital lobe* 9.70 8.25 ± 16.35 1.05 0.55 15.40 0.90 ↵* Gray-matter–masked regions.
Average PD, WSMSS, ICC, %SD, and identifiability estimates are based on BPF measurements.
Metric 2TC 2TCC Logan analysis LEGA 2TCNI PD (%) 8.45 ± 15.17 8.32 ± 13.05 7.08 ± 14.62 7.52 ± 13.63 6.43 ± 16.53 WSMSS (mL/cm3) 7.00 ± 10.54 3.85 ± 1.69 3.32 ± 1.62 3.36 ± 1.60 7.78 ± 7.74 ICC (unitless) 0.65 ± 0.17 0.72 ± 0.16 0.74 ± 0.13 0.74 ± 0.13 0.68 ± 0.13 SD (%) 20.45 ± 6.38 19.24 ± 4.29 19.13 ± 5.92 18.78 ± 4.96 22.53 ± 7.38 Identifiability (mL/cm3) 2.73 ± 3.02 3.42 ± 3.32 2.64 ± 2.36 2.50 ± 2.39 3.31 ± 3.54 Mean ± SD across all subjects and all regions is shown. Models that attain best mean result in each category are in bold.
Metric 2TC 2TCC Logan analysis LEGA 2TCNI PD (%) 13.22 ± 13.66 13.10 ± 11.38 11.85 ± 13.25 13.29 ± 12.37 11.19 ± 15.16 WSMSS (mL/cm3) 0.81 ± 1.13 0.49 ± 0.26 0.42 ± 0.22 0.43 ± 0.23 0.78 ± 0.68 ICC (unitless) 0.61 ± 0.15 0.66 ± 0.16 0.70 ± 0.11 0.69 ± 0.11 0.65 ± 0.14 SD (%) 21.57 ± 5.98 20.15 ± 3.92 20.22 ± 5.54 19.81 ± 4.54 23.12 ± 6.15 Identifiability (mL/cm3) 0.82 ± 0.94 1.02 ± 0.99 0.79 ± 0.70 0.75 ± 0.71 0.99 ± 1.05 Mean ± SD across all subjects and all regions is shown. Models that attain best mean result in each category are in bold.
ROI Average VT of each ROI (mL/cm3) PD (%) WSMSS (mL/cm3) ICC (unitless) SD (%) Identifiability (mL/cm3) Entorhinal cortex 15.41 5.57 ± 8.75 1.09 0.83 15.78 1.85 Hippocampus 15.17 7.28 ± 3.89 0.77 0.87 15.28 1.88 Insula 14.25 6.23 ± 5.28 0.65 0.77 11.45 1.52 Posterior parahippocampal gyrus 13.53 4.32 ± 4.81 0.41 0.90 14.68 1.49 Temporal lobe 13.36 7.22 ± 6.27 0.73 0.79 13.48 1.36 Amygdala 12.03 6.1 ± 4.95 0.45 0.90 17.45 1.41 Cingulate 11.27 2.87 ± 5.47 0.22 0.92 14.00 1.05 Medial prefrontal cortex 10.87 5.71 ± 5.42 0.35 0.82 12.42 1.00 Orbital prefrontal cortex 10.21 9.05 ± 7.20 0.60 0.72 13.84 0.94 Parietal lobe 9.95 4.05 ± 4.51 0.17 0.88 11.41 0.86 Dorsolateral prefrontal cortex 9.85 6.31 ± 5.72 0.33 0.79 12.37 0.87 Raphe 9.49 7.33 ± 7.59 0.40 0.83 15.66 0.94 Occipital lobe 8.65 4.44 ± 6.80 0.21 0.75 10.28 0.75 CGM 5.77 0.42 ± 4.80 0.04 0.92 11.56 0.48 - TABLE 5
Average and SD of Kinetic Rate Constants Using 120-Minute Scan and 2-TC Noniterative Method
ROI K1 k2 k3 k4 Entorhinal cortex 0.31 ± 0.18 0.08 ± 0.11 0.09 ± 0.10 0.03 ± 0.02 Hippocampus 0.34 ± 0.20 0.12 ± 0.11 0.13 ± 0.10 0.03 ± 0.01 Insula 0.39 ± 0.17 0.11 ± 0.08 0.12 ± 0.09 0.04 ± 0.02 Posterior parahippocampal gyrus 0.34 ± 0.16 0.08 ± 0.08 0.08 ± 0.07 0.04 ± 0.02 Temporal lobe 0.40 ± 0.24 0.10 ± 0.10 0.10 ± 0.06 0.05 ± 0.02 Amygdala 0.30 ± 0.17 0.07 ± 0.08 0.07 ± 0.09 0.03 ± 0.02 Cingulate 0.41 ± 0.19 0.11 ± 0.08 0.09 ± 0.05 0.05 ± 0.02 Medial prefrontal cortex 0.42 ± 0.20 0.10 ± 0.07 0.09 ± 0.06 0.06 ± 0.03 Orbital prefrontal cortex 0.39 ± 0.20 0.10 ± 0.09 0.08 ± 0.07 0.05 ± 0.02 Parietal lobe 0.44 ± 0.22 0.13 ± 0.10 0.10 ± 0.07 0.06 ± 0.02 Dorsolateral prefrontal cortex 0.41 ± 0.19 0.11 ± 0.08 0.09 ± 0.07 0.06 ± 0.02 Raphe 0.34 ± 0.21 0.11 ± 0.10 0.07 ± 0.08 0.04 ± 0.02 Occipital lobe 0.45 ± 0.23 0.15 ± 0.10 0.08 ± 0.06 0.05 ± 0.02 CGM 0.42 ± 0.22 0.15 ± 0.10 0.05 ± 0.03 0.05 ± 0.02 Scan length (min) 70 80 90 100 110 120 ROI BPF VT BPF VT BPF VT BPF VT BPF VT BPF VT Entorhinal cortex 36 50 50 57 43 71 50 64 86 86 100 100 Hippocampus 29 43 57 64 57 64 57 71 79 100 100 100 Insula 43 43 57 71 86 86 86 86 100 100 100 100 Posterior parahippocampal gyrus 36 29 50 64 57 71 64 79 79 93 100 100 Temporal lobe 50 64 43 57 64 71 71 86 93 100 100 100 Amygdala 36 50 43 57 43 71 43 71 79 93 100 100 Cingulate 64 64 57 79 71 86 71 100 100 100 100 100 Medial prefrontal cortex 64 64 71 71 71 79 71 100 100 100 100 100 Orbital prefrontal cortex 50 57 50 79 57 71 57 86 79 100 100 100 Parietal lobe 79 79 86 93 79 100 93 100 100 100 100 100 Dorsolateral prefrontal cortex 64 64 64 79 64 79 71 100 100 100 100 100 Raphe 21 36 21 64 50 79 43 71 71 100 100 100 Occipital lobe 50 64 57 93 50 93 64 93 93 100 100 100 For each region, percentages of BPF or VT (of 14 PET scans) are indicated; values are estimated using indicated scan lengths, which fall within ±5% of BPF or VT values estimated using 120-min scan.
Metric SRTM Bloodless Logan analysis Bloodless LEGA PD (%) 9.67 ± 11.63 10.47 ± 11.38 11.59 ± 17.35 WSMSS (unitless) 0.008 ± 0.003 0.007 ± 0.003 0.010 ± 0.006 ICC (unitless) 0.65 ± 0.13 0.59 ± 0.16 0.56 ± 0.16 SD (%) 15.68 ± 5.44 14.93 ± 5.74 15.75 ± 6.50 Mean % bias −3.47 ± 3.60 −7.32 ± 5.86 −3.95 ± 7.31 Mean ± SD across all subjects and all regions is shown. Models that attain best average result in each category are in bold.


Jump to section
Related Articles
Cited By...
- Synthesis of Patient-Specific Transmission Data for PET Attenuation Correction for PET/MRI Neuroimaging Using a Convolutional Neural Network
- 11C-CUMI-101, a PET Radioligand, Behaves as a Serotonin 1A Receptor Antagonist and Also Binds to {alpha}1 Adrenoceptors in Brain
- Radiosynthesis and Preclinical Evaluation of 18F-F13714 as a Fluorinated 5-HT1A Receptor Agonist Radioligand for PET Neuroimaging
- Plasma A{beta} and PET PiB binding are inversely related in mild cognitive impairment
- SEP-225289 Serotonin and Dopamine Transporter Occupancy: A PET Study