


Article Figures & Data
Figures
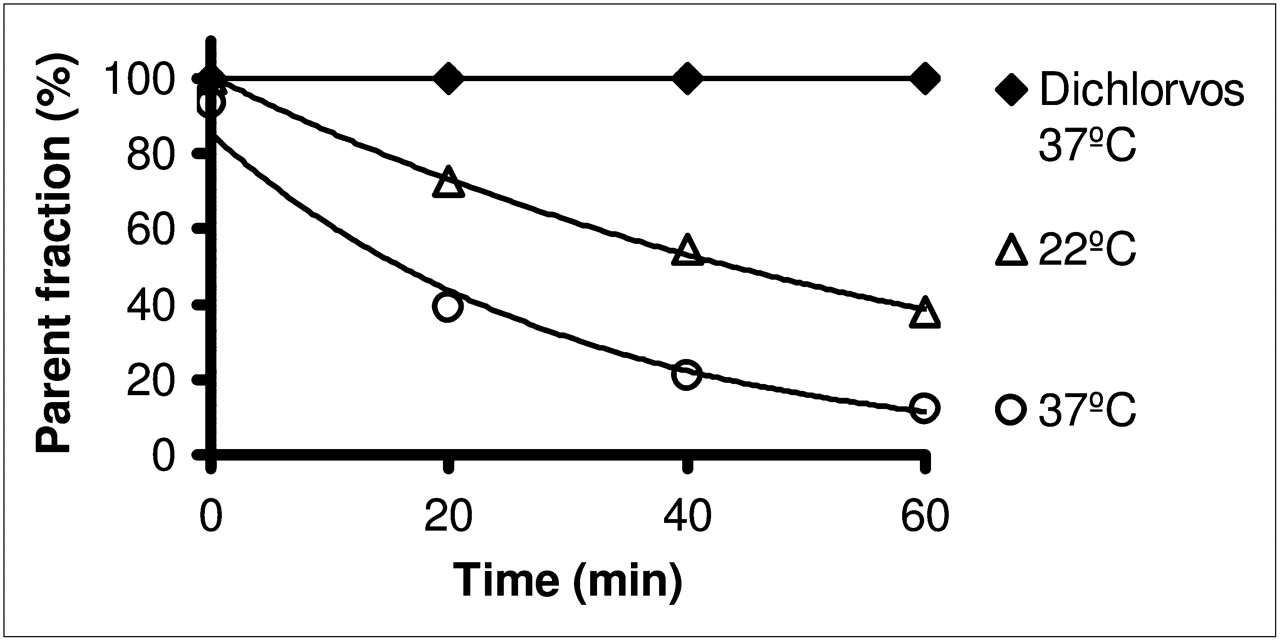
- FIGURE 1.
Time-dependent metabolism of 11C-SB207145 in plasma at 22°C and 37°C. Metabolism is prevented when dichlorvos is added. Exponential fits correspond to half-lives of 18 min at 22°C and 44 min at 37°C.
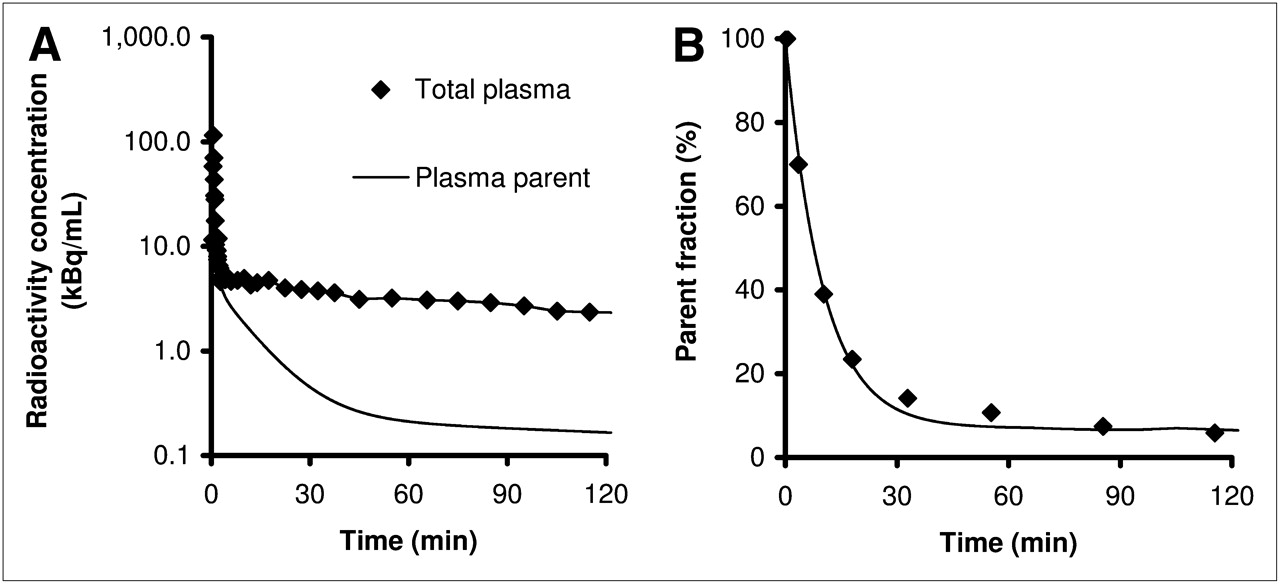
- FIGURE 2.
(A) Total radioactivity concentration in plasma and metabolite-corrected plasma radioactivity from 36-y-old 69-kg woman after injection of 512 MBq of 11C-SB207145. (B) Metabolite measurements of representative subject. Fit is constrained biexponential function (25).
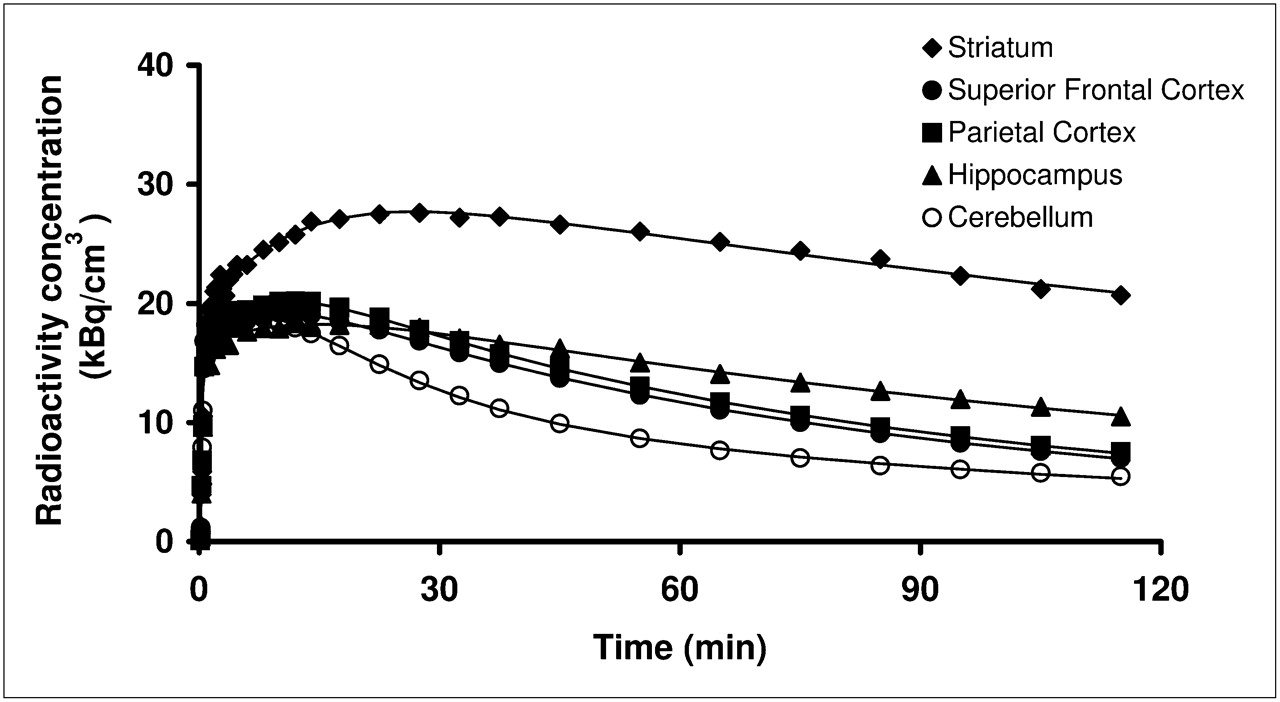
- FIGURE 3.
Regional time–activity curves after injection of 512 MBq of 11C-SB207145. Striatum shows highest and latest peak and slowest washout because of high density of receptors, whereas superior frontal and parietal cortices show faster washout. Cerebellum devoid of specific binding has fastest washout. Fits with 2-tissue-compartment modeling are shown.
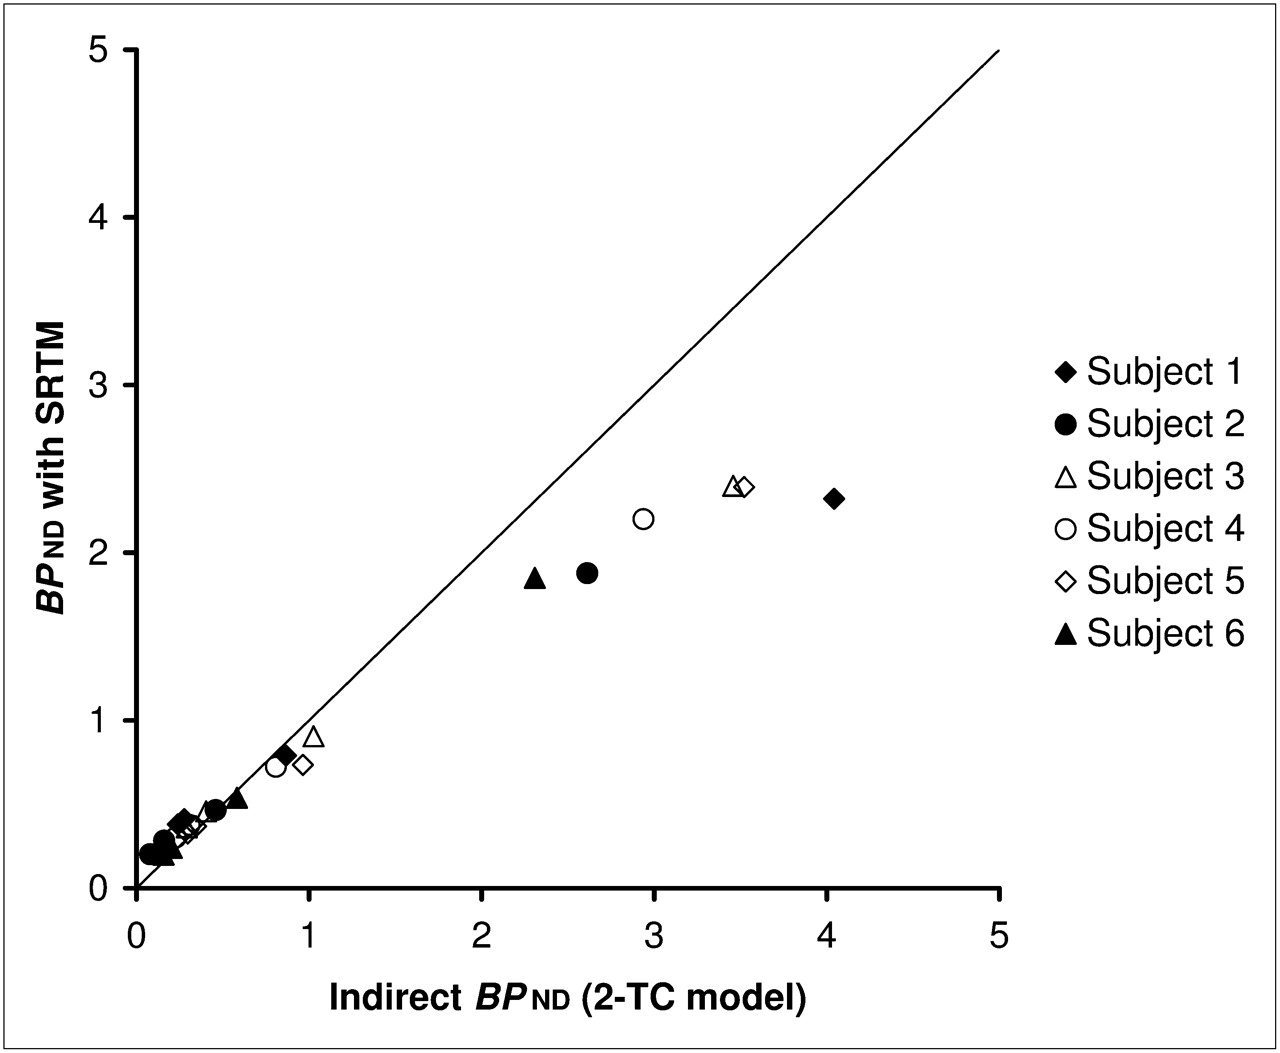
- FIGURE 4.
BPND estimated with SRTM, compared with BPND determined indirectly from VT (2-tissue-compartment model [2-TC] with arterial input) using test scans of test–retest dataset. Graph shows that bias is introduced in areas of high binding with SRTM (on average, 30%; range, 20%−43%). Solid line is line of identity.
- FIGURE 5.
Time stability using 2-tissue-compartment model (2-TC) (A and C) and SRTM (B and D) for striatum (A and B) and for hippocampus (C and D) for test and retest scans. Error bars represent 1 SD.
- FIGURE 6.
Baseline (A) and blocked (B) 11C-SB207145 scan of 29-y-old man before and after oral administration of piboserod (SB207266). Mean images from 30 to 120 min after injection are normalized to injected dose (ID) to obtain normalized uptake value. Chosen orthogonal sections pass through striatum.
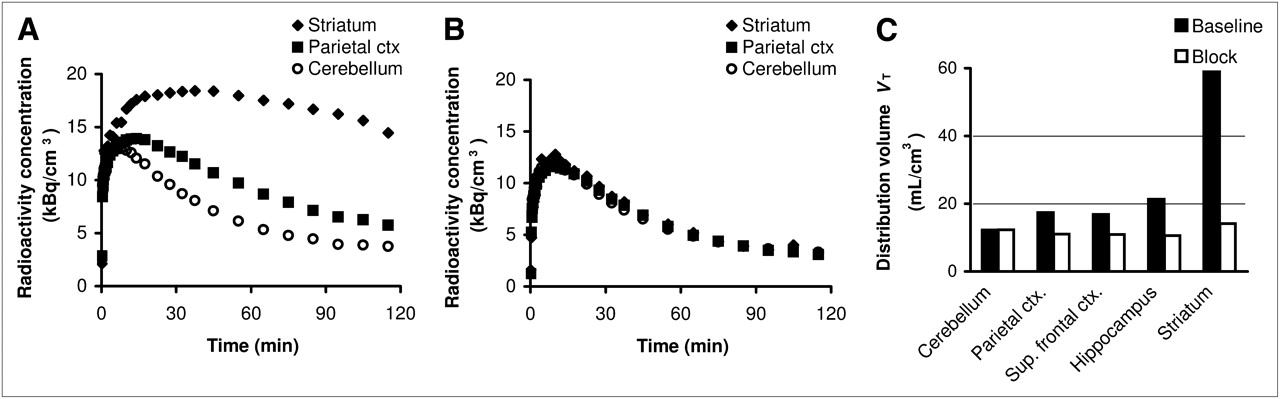
- FIGURE 7.
Time–activity curves for baseline (A) and blocked (B) scans of 29-y-old man. After 150-mg oral administration of structurally dissimilar compound piboserod (SB207266), 11C-SB207145 distribution volumes (C) are reduced to level of cerebellum at baseline (n = 2). Ctx = cortex; sup = superior.


Tables
Test–retest Blocking Parameter Test (n = 6) Retest (n = 6) Baseline (n = 2) Block (n = 2) Age (y) 34.6 ± 7.0 34.6 ± 7.0 37, 29 37, 29 Body weight (kg) 75.0 ± 17 75.0 ± 17 67.2, 75.8 67.2, 75.8 Injected dose (MBq) 566 ± 41 577 ± 26 329, 370 389, 335 Injected mass (μg) 4.09 ± 1.2 4.47 ± 0.92 4.31, 4.39 4.16, 5.87 Parent plasma clearance (L/h) 191 ± 28 214 ± 55 164, 324 178, 236 Data are either mean ± SD or individual values.
Model Region K1 (mL cm−3 min−1) k2 (min−1) k3 (min−1) k4 (min−1) VT (mL/cm3) BPND BPP (mL/cm3) Akaike information criterion Relative diff BPND (%) Average diff BPND (%) ICC BPND Relative diff BPP (%) Average diff BPP (%) ICC BPP 1-TC Cerebellum 0.19 ± 0.07 0.023 ± 0.003 — — 7.86 ± 2.23 — — 586 ± 20 — — — — — — Parietal ctx 0.19 ± 0.07 0.016 ± 0.003 — — 11.8 ± 3.26 0.51 ± 0.10 3.97 ± 1.22 542 ± 26 7.50 13.2 0.82 11.6* 10.7 0.88 Sup. fr. ctx 0.19 ± 0.07 0.016 ± 0.003 — — 11.3 ± 3.17 0.43 ± 0.10 3.39 ± 1.16 541 ± 23 8.08 12.5 0.87 12.2* 9.70 0.89 Hippocampus 0.17 ± 0.06 0.010 ± 0.002 — — 16.2 ± 4.59 1.07 ± 0.21 8.38 ± 2.63 569 ± 13 6.27 13.0 0.80 10.4* 7.53 0.91 Striatum 0.23 ± 0.08 0.006 ± 0.002 — — 40.4 ± 11.7 4.20 ± 0.93 32.5 ± 10.1 536 ± 27 11.4† 8.2 0.84 15.5* 8.69 0.80 2-TC Cerebellum 0.24 ± 0.08 0.056 ± 0.009 0.021 ± 0.006 0.018 ± 0.003 9.50 ± 2.58 — — 510 ± 28 — — — — — — Parietal ctx 0.23 ± 0.08 0.054 ± 0.019 0.099 ± 0.079 0.050 ± 0.023 12.3 ± 3.42 0.30 ± 0.08 2.83 ± 1.02 506 ± 30 11.9 13.6 0.80 13.8* 10.7 0.87 Sup. fr. ctx 0.22 ± 0.08 0.057 ± 0.021 0.108 ± 0.083 0.050 ± 0.023 11.7 ± 3.32 0.23 ± 0.08 2.22 ± 0.95 504 ± 26 17.7 19.4 0.79 19.7* 11.8 0.84 Hippocampus 0.23 ± 0.07 0.110 ± 0.032 0.178 ± 0.058 0.026 ± 0.008 17.3 ± 5.01 0.82 ± 0.19 7.81 ± 2.73 517 ± 21 10.9 12.9 0.82 12.8* 5.95 0.90 Striatum 0.27 ± 0.09 0.066 ± 0.032 0.364 ± 0.133 0.060 ± 0.063 41.4 ± 12.0 3.38 ± 0.72 31.9 ± 10.0 519 ± 31 13.9* 7.9 0.68 15.8† 7.82 0.81 SRTM Cerebellum — 0.016 ± 0.012 — — — — — — — — — — — — Parietal ctx — 0.069 ± 0.011 — — — 0.36 ± 0.06 — 449 ± 25 5.73 13.6 0.77 — — — Sup. fr. ctx — 0.067 ± 0.008 — — — 0.30 ± 0.07 — 467 ± 20 6.60 12.6 0.84 — — — Hippocampus — 0.037 ± 0.005 — — — 0.70 ± 0.13 — 517 ± 14 4.00 9.92 0.88 — — — Striatum — 0.054 ± 0.004 — — — 2.21 ± 0.21 — 496 ± 28 3.74 6.06 0.76 — — — ↵* P < 0.05.
↵† P < 0.01 (paired Student t test between first and second scans).
Diff = difference; TC = tissue compartment; sup. fr. = superior frontal; ctx = cortex.
Minimum Akaike information criterion indicates more statistically appropriate model. Relative test–retest difference is Δ% = 2 × (scan 2 − scan 1)/(scan 1 + scan 2) × 100%. Average test–retest difference is SD of Δ%. Data are either mean ± SD or individual values.
Test–retest Blocking Region VT (mL/cm3) BPND VT (mL/cm3) BPND Cerebellum 9.50 ± 2.58 — 9.14, 15.3 — Parietal cortex 12.3 ± 3.42 0.30 ± 0.08 12.6, 22.1 0.38, 0.45 Superior frontal cortex 11.7 ± 3.32 0.23 ± 0.08 12.8, 21.0 0.40, 0.38 Hippocampus 17.3 ± 5.01 0.82 ± 0.19 16.6, 26.0 0.82, 0.70 Striatum 41.4 ± 12.0 3.38 ± 0.72 48.5, 69.5 4.30, 3.55 Data are either mean ± SD or individual values.


Jump to section
Related Articles
Cited By...
- Evidence for a serotonergic subtype of major depressive disorder: A NeuroPharm-1 study
- International Union of Basic and Clinical Pharmacology. CX. Classification of Receptors for 5-hydroxytryptamine; Pharmacology and Function
- In Vivo Evaluation of 18F-MNI698: An 18F-Labeled Radiotracer for Imaging of Serotonin 4 Receptors in Brain
- The 5-Hydroxytryptamine4 Receptor Agonists Prucalopride and PRX-03140 Increase Acetylcholine and Histamine Levels in the Rat Prefrontal Cortex and the Power of Stimulated Hippocampal {theta} Oscillations